| Param | Original file | Final file |
|---|---|---|
| Filename | modeM0/AS1A10_071T44_9000004434_30722cztM0_level2.evt | modeM0/AS1A10_071T44_9000004434_30722cztM0_level2_quad_clean.evt |
| Size (bytes) | 620,127,360 | 74,301,120 |
| Size | 591.4 MB | 70.9 MB |
| Events in quadrant A | 3,087,862 | 477,500 |
| Events in quadrant B | 5,005,635 | 471,794 |
| Events in quadrant C | 3,211,352 | 454,702 |
| Events in quadrant D | 7,077,286 | 432,886 |
| Mode SS | |||
|---|---|---|---|
| Quadrant | BADHDUFLAG | Total packets | Discarded packets |
| A | 0 | 118 | 0 |
| B | 0 | 118 | 0 |
| C | 0 | 118 | 0 |
| D | 0 | 118 | 0 |
| Mode M0 | |||
|---|---|---|---|
| Quadrant | BADHDUFLAG | Total packets | Discarded packets |
| A | 0 | 12728 | 1 |
| B | 0 | 18843 | 2 |
| C | 0 | 13107 | 1 |
| D | 0 | 25206 | 1 |
| Quadrant | Total seconds | Saturated seconds | Saturation percentage |
|---|---|---|---|
| A | 5908 | 40 | 0.677048% |
| B | 5907 | 194 | 3.284239% |
| C | 5908 | 133 | 2.251185% |
| D | 5908 | 319 | 5.399458% |
Noise dominated data is calculated using 1-second bins in cleaned event files. If a bin has >2000 counts, and if more than 50% of those come from <1% of pixels, then it is considered to be noise-dominated and hence unusable.
| Quadrant | # 1 sec bins | Bins with >0 counts | Bins with >2000 counts | High rate bins dominated by noise | Noise dominated (total time) | Noise dominated (detector-on time) | Marked lightcurve |
|---|---|---|---|---|---|---|---|
| A | 5908 | 5908 | 0 | 0 | 0.00% | 0.00% | 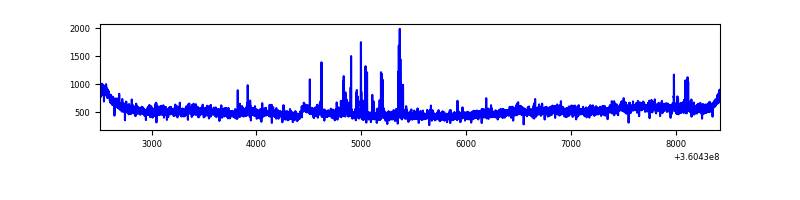 |
| B | 5907 | 5907 | 44 | 44 | 0.74% | 0.74% | 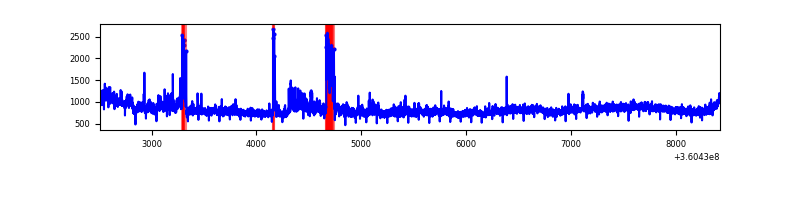 |
| C | 5908 | 5908 | 28 | 28 | 0.47% | 0.47% | 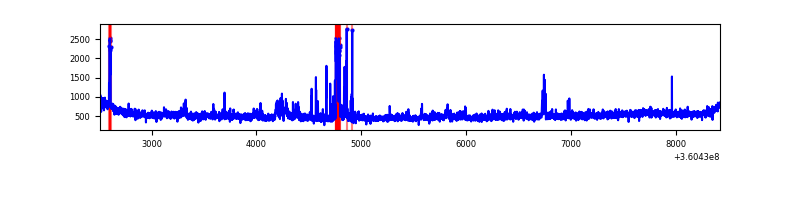 |
| D | 5908 | 5908 | 415 | 415 | 7.02% | 7.02% | 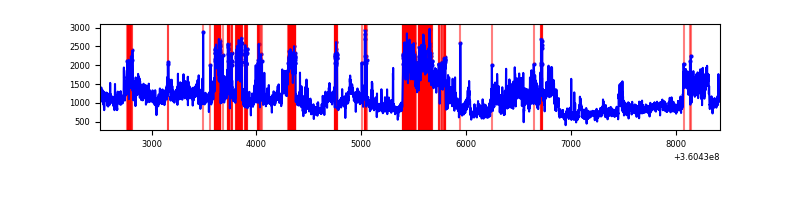 |
Top three noisy pixels from each quadrant. If the there are fewer than three noisy pixels in the level2.evt file, extra rows are filled as -1
| Pixel properties | Quadrant properties | ||||||
|---|---|---|---|---|---|---|---|
| Quadrant | DetID | PixID | Counts | Sigma | Mean | Median | Sigma |
| A | 8 | 192 | 180221 | 1191.21 | 735 | 719 | 150.7 |
| A | 0 | 13 | 71266 | 468.16 | 735 | 719 | 150.7 |
| A | 13 | 254 | 11098 | 68.88 | 735 | 719 | 150.7 |
| B | 6 | 159 | 1675877 | 11884.42 | 720 | 702 | 141.0 |
| B | 6 | 36 | 341212 | 2415.73 | 720 | 702 | 141.0 |
| B | 5 | 255 | 64229 | 450.69 | 720 | 702 | 141.0 |
| C | 3 | 233 | 192999 | 1154.05 | 699 | 705 | 166.6 |
| C | 10 | 22 | 147344 | 880.05 | 699 | 705 | 166.6 |
| C | 14 | 238 | 112637 | 671.76 | 699 | 705 | 166.6 |
| D | 8 | 195 | 3582127 | 21116.76 | 701 | 681 | 169.6 |
| D | 10 | 253 | 653049 | 3846.46 | 701 | 681 | 169.6 |
| D | 13 | 249 | 101995 | 597.36 | 701 | 681 | 169.6 |
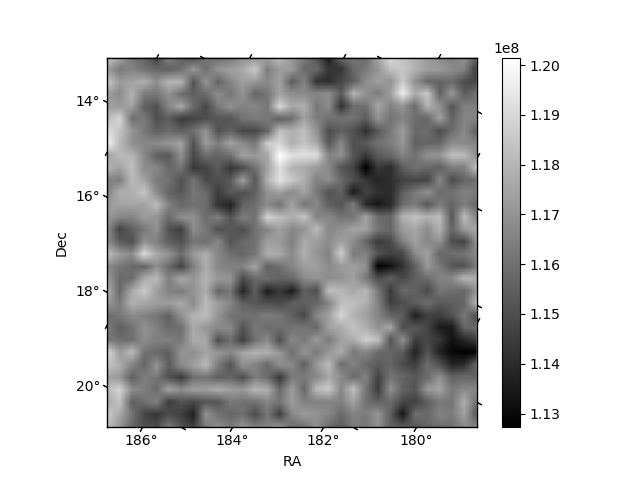
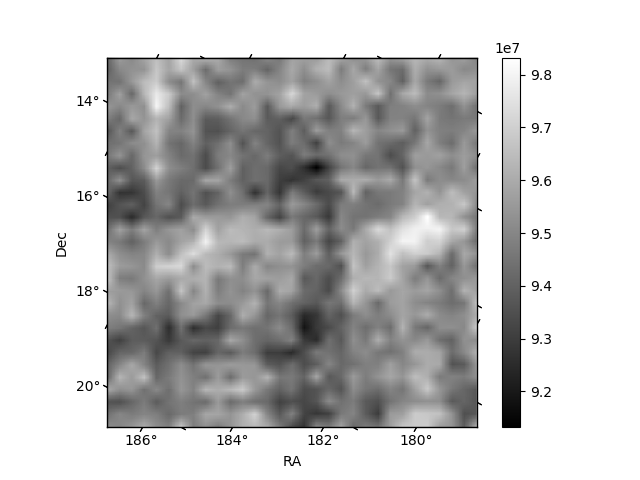
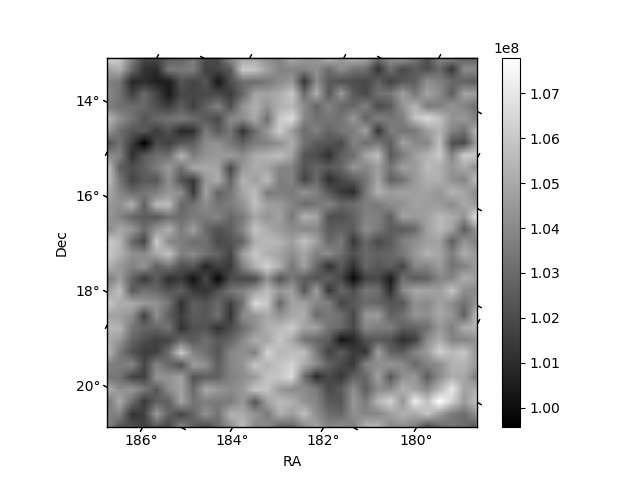
Histogram calculated using DETX and DETY for each event in the final _common_clean file
| Quadrant A | 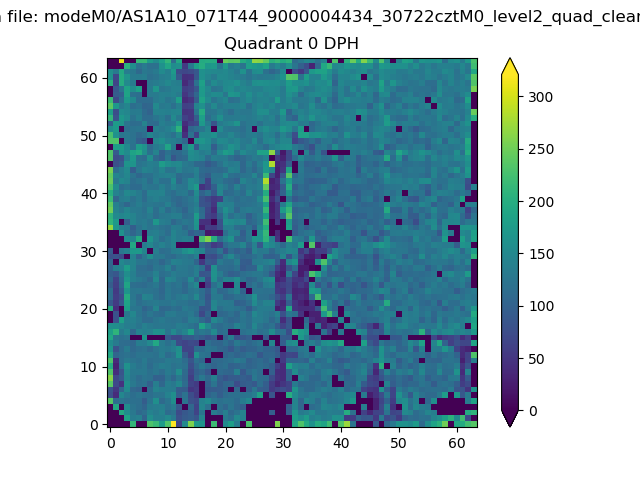 |
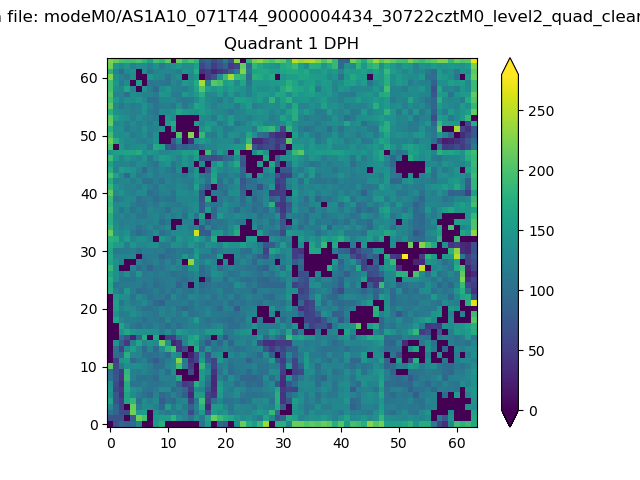 |
Quadrant B |
|---|---|---|---|
| Quadrant D | 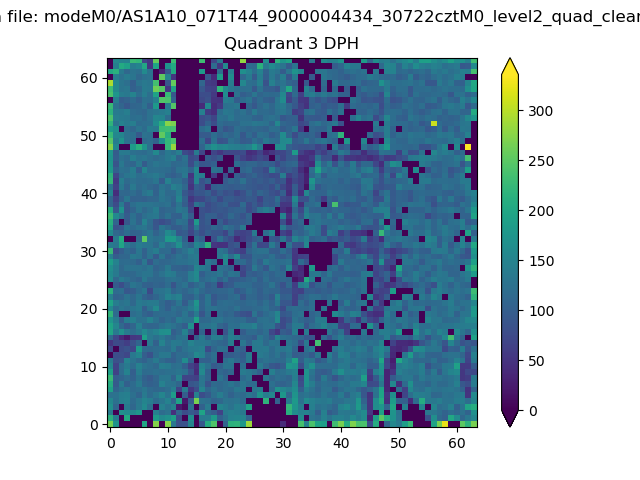 |
 |
Quadrant C |
| Plot type | Count rate plots | Images |
|---|---|---|
| Comparison with Poisson distribution Blue bars denote a histogram of data divided into 1 sec bins. Red curve is a Poisson curve with rate = median count rate of data. |
 |
 |
| Quadrant-wise count rates Data is divided into 100 sec bins |
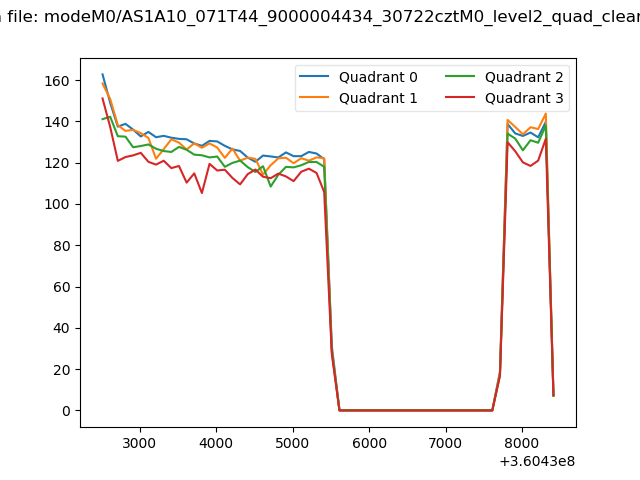 |
|
| Module-wise count rates for Quadrant A Data is divided into 100 sec bins |
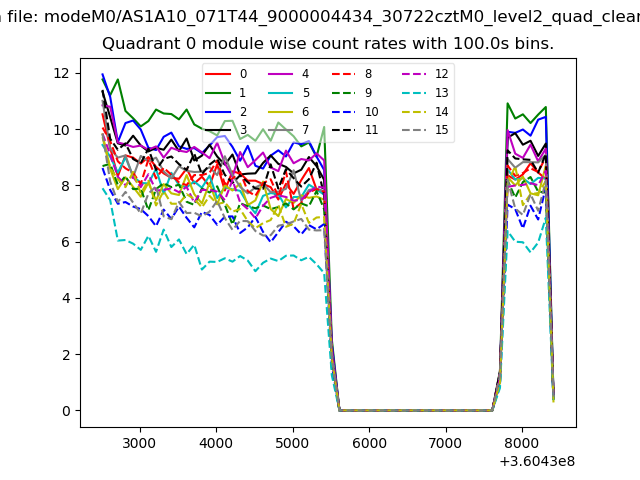 |
 |
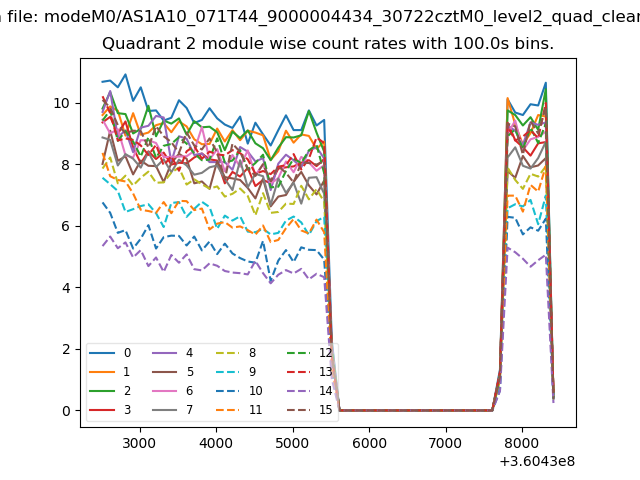
| Module-wise count rates for Quadrant B Data is divided into 100 sec bins |
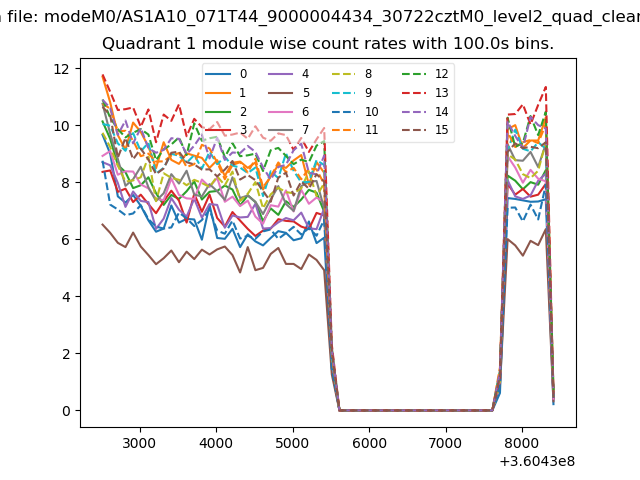 |
 |
| Module-wise count rates for Quadrant C Data is divided into 100 sec bins |
 |
 |
| Module-wise count rates for Quadrant D Data is divided into 100 sec bins |
 |
 |
| Parameter | Plot |
|---|---|
| CZT HV Monitor | 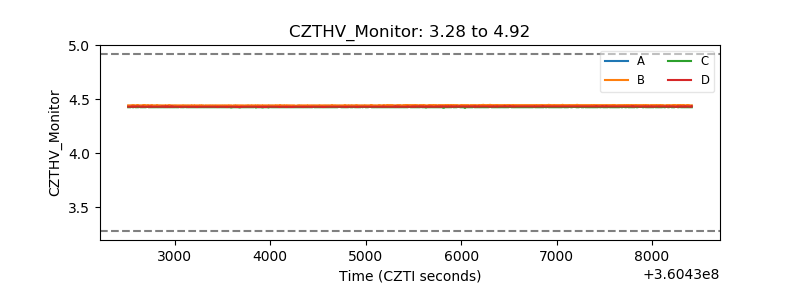 |
| D_VDD | 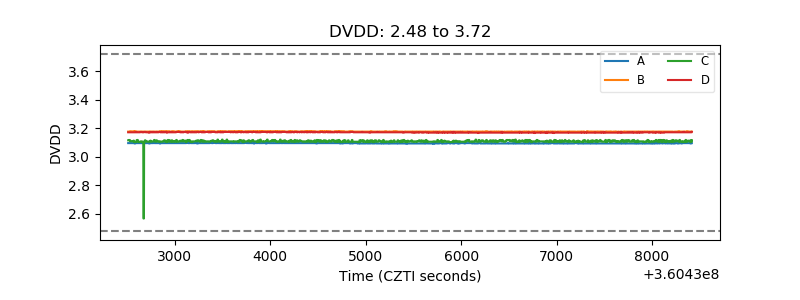 |
| Temperature 1 | 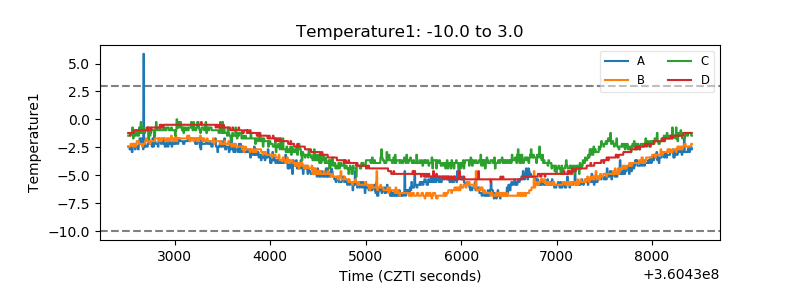 |
| Veto HV Monitor | 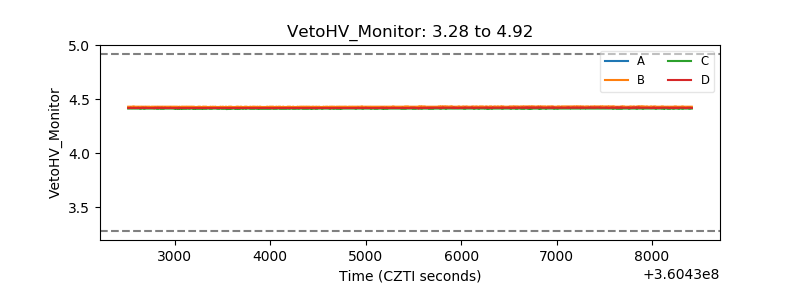 |
| Veto LLD | 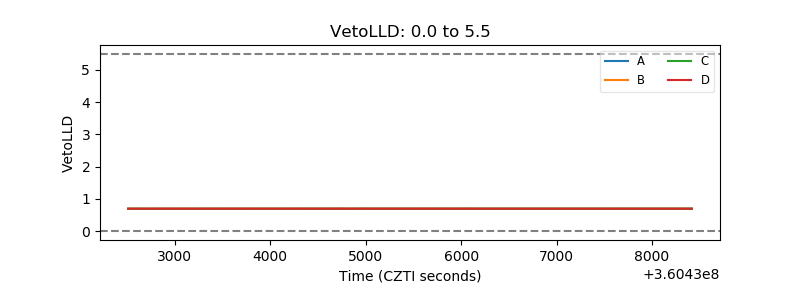 |
| Alpha Counter | 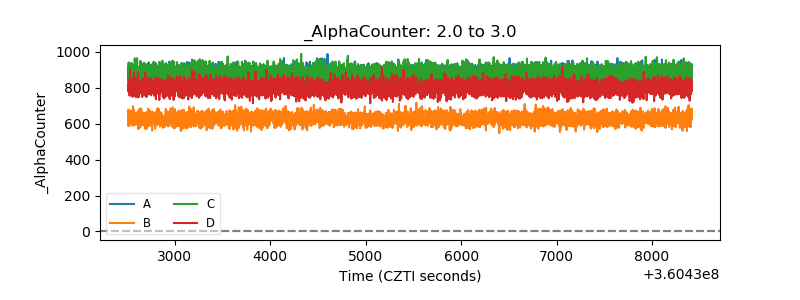 |
| _CPM_Rate | 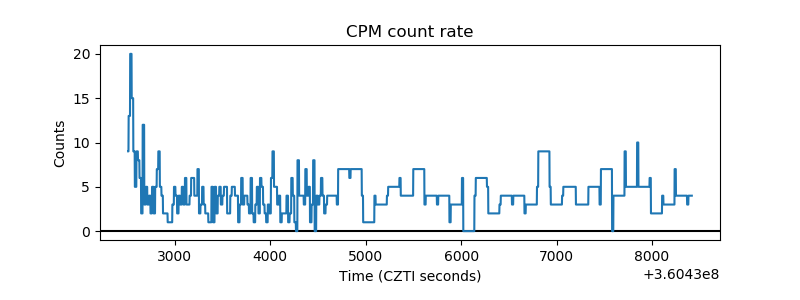 |
| CZT Counter | 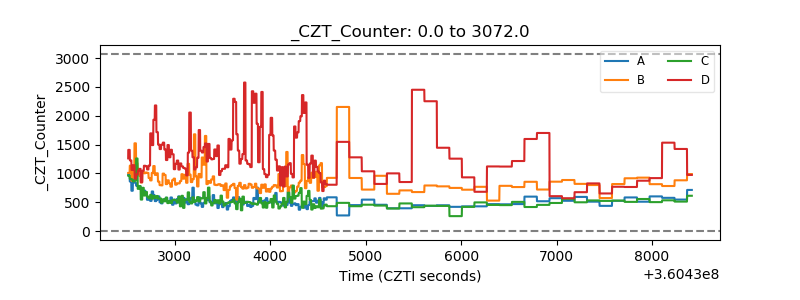 |
| +2.5 Volts monitor |  |
| +5 Volts monitor |  |
| _ROLL_ROT |  |
| _Roll_DEC |  |
| _Roll_RA | 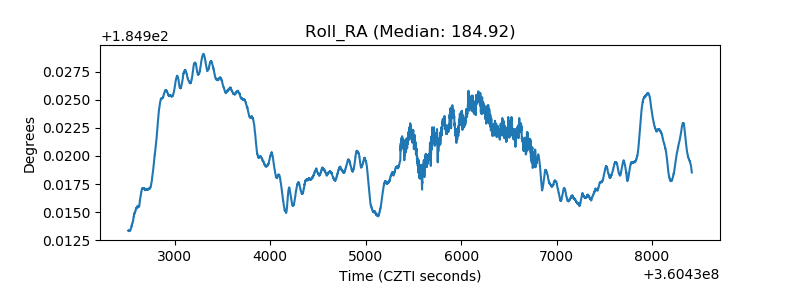 |
| Veto Counter |  |