| Param | Original file | Final file |
|---|---|---|
| Filename | modeM0/AS1C05_008T01_9000004432cztM0_level2.fits | modeM0/AS1C05_008T01_9000004432cztM0_level2_quad_clean.evt |
| Size (bytes) | 103,838,400 | 101,571,840 |
| Size | 99.0 MB | 96.9 MB |
| Events in quadrant A | 643,208 | 617,979 |
| Events in quadrant B | 603,038 | 605,716 |
| Events in quadrant C | 617,408 | 573,550 |
| Events in quadrant D | 518,600 | 516,113 |
| Mode M0 | |||
|---|---|---|---|
| Quadrant | BADHDUFLAG | Total packets | Discarded packets |
| A | 0 | 23756 | 0 |
| B | 0 | 33864 | 0 |
| C | 0 | 25753 | 0 |
| D | 0 | 46222 | 0 |
| Mode M9 | |||
|---|---|---|---|
| Quadrant | BADHDUFLAG | Total packets | Discarded packets |
| A | 0 | 15 | 0 |
| B | 0 | 15 | 0 |
| C | 0 | 15 | 0 |
| D | 0 | 15 | 0 |
| Mode SS | |||
|---|---|---|---|
| Quadrant | BADHDUFLAG | Total packets | Discarded packets |
| A | 0 | 224 | 0 |
| B | 0 | 224 | 0 |
| C | 0 | 224 | 0 |
| D | 0 | 224 | 0 |
| Quadrant | Total seconds | Saturated seconds | Saturation percentage |
|---|---|---|---|
| A | 11010 | 100 | 0.908265% |
| B | 11010 | 243 | 2.207084% |
| C | 11010 | 312 | 2.833787% |
| D | 11010 | 1157 | 10.508629% |
Noise dominated data is calculated using 1-second bins in cleaned event files. If a bin has >2000 counts, and if more than 50% of those come from <1% of pixels, then it is considered to be noise-dominated and hence unusable.
| Quadrant | # 1 sec bins | Bins with >0 counts | Bins with >2000 counts | High rate bins dominated by noise | Noise dominated (total time) | Noise dominated (detector-on time) | Marked lightcurve |
|---|---|---|---|---|---|---|---|
| A | 12514 | 11007 | 0 | 0 | 0.00% | 0.00% | 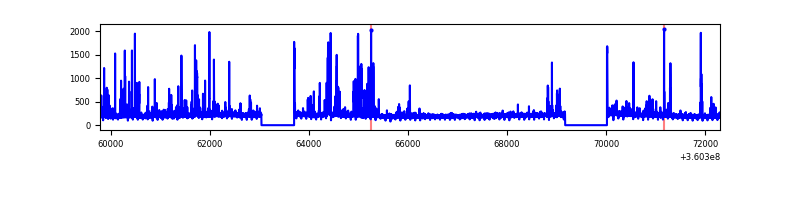 |
| B | 12514 | 11006 | 0 | 0 | 0.00% | 0.00% | 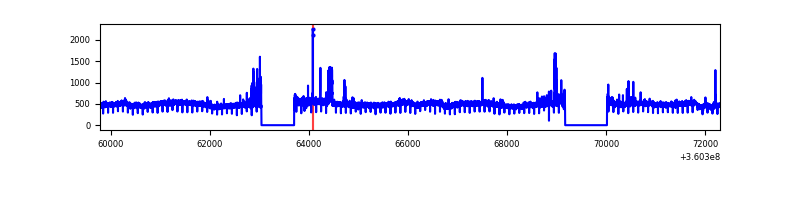 |
| C | 12515 | 11005 | 0 | 0 | 0.00% | 0.00% |  |
| D | 12515 | 11008 | 0 | 0 | 0.00% | 0.00% |  |
Top three noisy pixels from each quadrant. If the there are fewer than three noisy pixels in the level2.evt file, extra rows are filled as -1
| Pixel properties | Quadrant properties | ||||||
|---|---|---|---|---|---|---|---|
| Quadrant | DetID | PixID | Counts | Sigma | Mean | Median | Sigma |
| A | 0 | 29 | 575 | 9.66 | 167 | 158 | 43.2 |
| A | 7 | 110 | 514 | 8.25 | 167 | 158 | 43.2 |
| A | 14 | 79 | 476 | 7.37 | 167 | 158 | 43.2 |
| B | 2 | 9 | 437 | 8.22 | 159 | 152 | 34.7 |
| B | 3 | 17 | 424 | 7.84 | 159 | 152 | 34.7 |
| B | 3 | 80 | 399 | 7.12 | 159 | 152 | 34.7 |
| C | 12 | 241 | 450 | 6.74 | 163 | 152 | 44.2 |
| C | 3 | 126 | 439 | 6.49 | 163 | 152 | 44.2 |
| C | 3 | 187 | 425 | 6.18 | 163 | 152 | 44.2 |
| D | 6 | 231 | 380 | 5.93 | 148 | 135 | 41.3 |
| D | 15 | 46 | 374 | 5.78 | 148 | 135 | 41.3 |
| D | 12 | 6 | 367 | 5.62 | 148 | 135 | 41.3 |
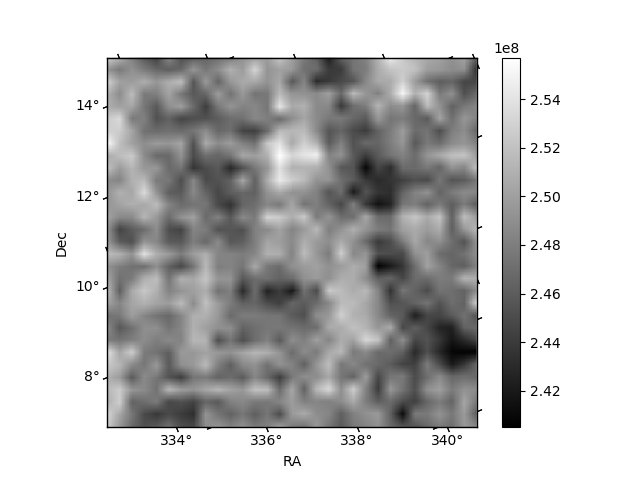
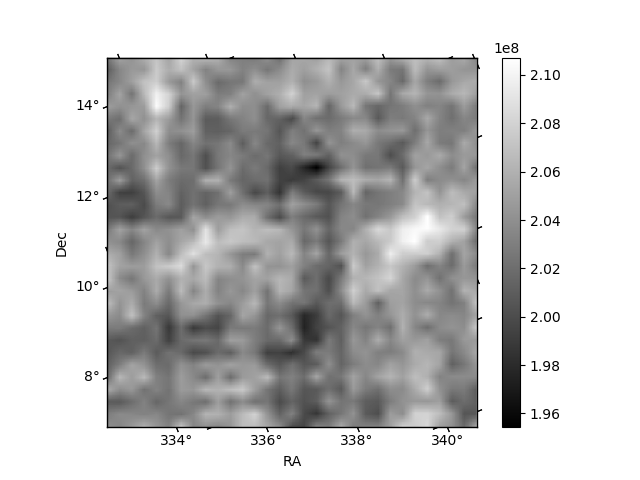
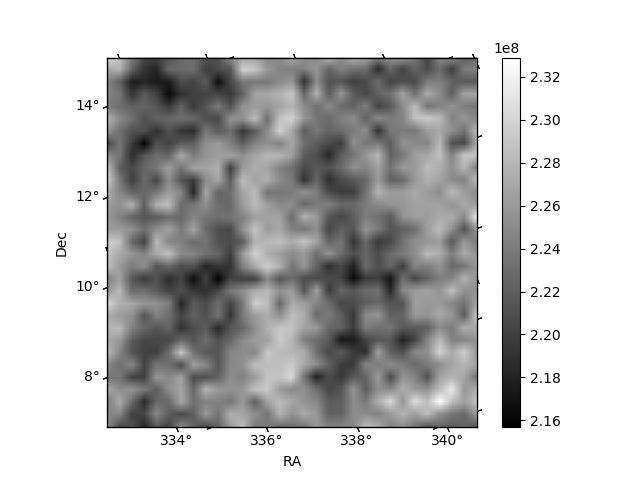
Histogram calculated using DETX and DETY for each event in the final _common_clean file
| Quadrant A |  |
 |
Quadrant B |
|---|---|---|---|
| Quadrant D | 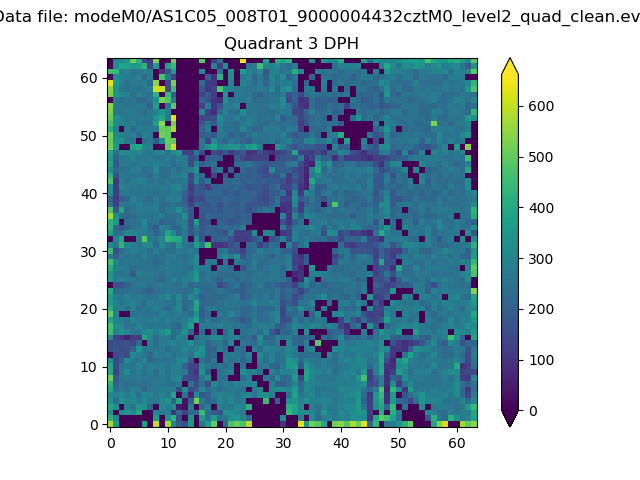 |
 |
Quadrant C |
| Plot type | Count rate plots | Images |
|---|---|---|
| Comparison with Poisson distribution Blue bars denote a histogram of data divided into 1 sec bins. Red curve is a Poisson curve with rate = median count rate of data. |
 |
 |
| Quadrant-wise count rates Data is divided into 100 sec bins |
 |
|
| Module-wise count rates for Quadrant A Data is divided into 100 sec bins |
 |
 |
| Module-wise count rates for Quadrant B Data is divided into 100 sec bins |
 |
 |
| Module-wise count rates for Quadrant C Data is divided into 100 sec bins |
 |
 |
| Module-wise count rates for Quadrant D Data is divided into 100 sec bins |
 |
 |
| Parameter | Plot |
|---|---|
| CZT HV Monitor |  |
| D_VDD |  |
| Temperature 1 | 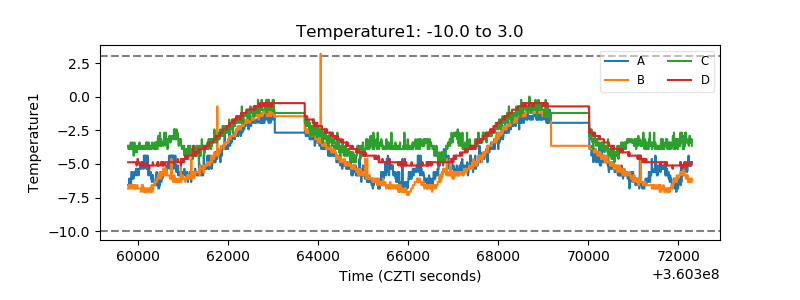 |
| Veto HV Monitor |  |
| Veto LLD | 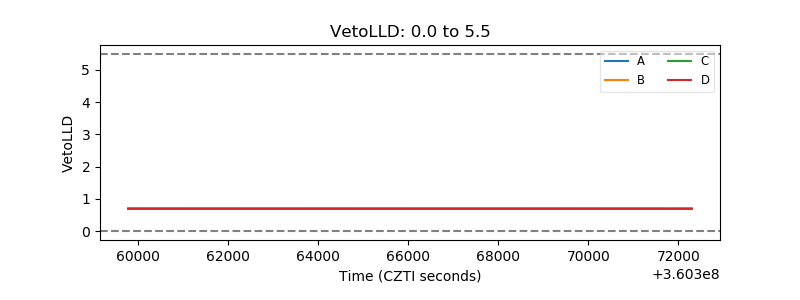 |
| Alpha Counter | 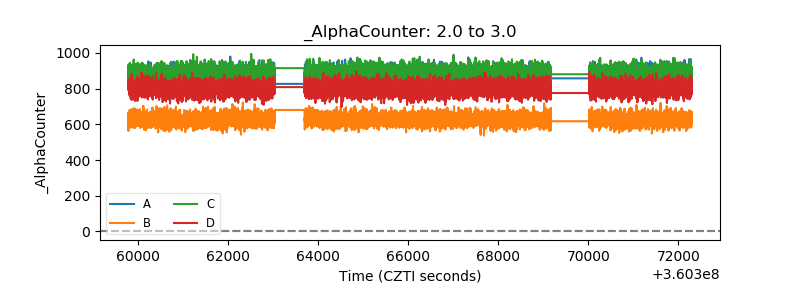 |
| _CPM_Rate | 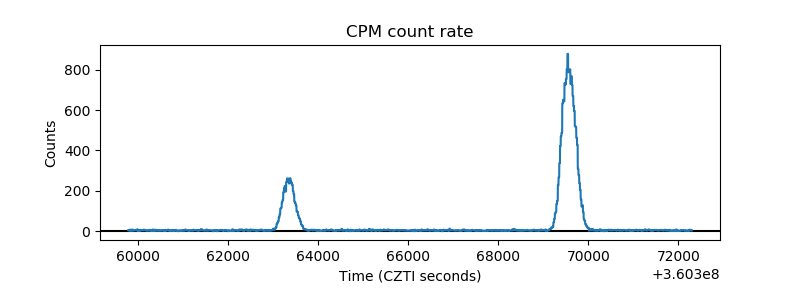 |
| CZT Counter |  |
| +2.5 Volts monitor |  |
| +5 Volts monitor | 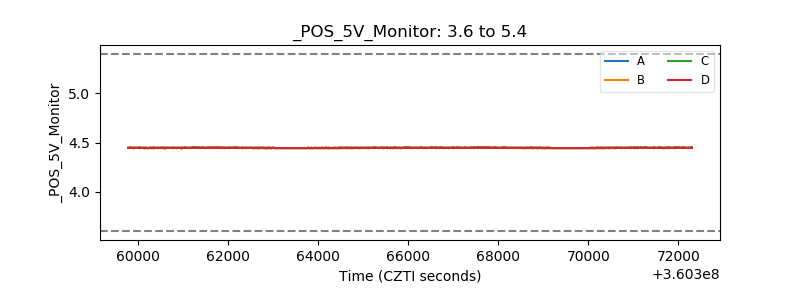 |
| _ROLL_ROT |  |
| _Roll_DEC |  |
| _Roll_RA |  |
| Veto Counter | 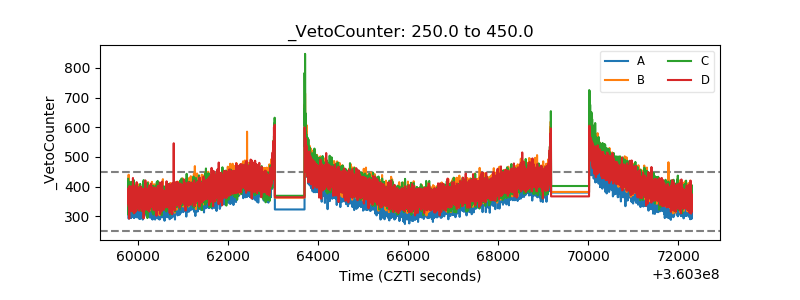 |