| Param | Original file | Final file |
|---|---|---|
| Filename | modeM0/AS1C05_008T01_9000004432_30710cztM0_level2.evt | modeM0/AS1C05_008T01_9000004432_30710cztM0_level2_quad_clean.evt |
| Size (bytes) | 1,058,204,160 | 139,703,040 |
| Size | 1009.2 MB | 133.2 MB |
| Events in quadrant A | 5,212,378 | 911,402 |
| Events in quadrant B | 8,057,189 | 904,989 |
| Events in quadrant C | 5,929,212 | 874,458 |
| Events in quadrant D | 12,165,268 | 835,764 |
| Mode M0 | |||
|---|---|---|---|
| Quadrant | BADHDUFLAG | Total packets | Discarded packets |
| A | 0 | 22022 | 2 |
| B | 0 | 31337 | 2 |
| C | 0 | 23932 | 2 |
| D | 0 | 43343 | 2 |
| Mode M9 | |||
|---|---|---|---|
| Quadrant | BADHDUFLAG | Total packets | Discarded packets |
| A | 0 | 15 | 0 |
| B | 0 | 15 | 0 |
| C | 0 | 15 | 0 |
| D | 0 | 15 | 0 |
| Mode SS | |||
|---|---|---|---|
| Quadrant | BADHDUFLAG | Total packets | Discarded packets |
| A | 0 | 208 | 0 |
| B | 0 | 208 | 0 |
| C | 0 | 208 | 0 |
| D | 0 | 208 | 0 |
| Quadrant | Total seconds | Saturated seconds | Saturation percentage |
|---|---|---|---|
| A | 10164 | 100 | 0.983865% |
| B | 10163 | 240 | 2.361507% |
| C | 10163 | 311 | 3.060120% |
| D | 10163 | 1157 | 11.384434% |
Noise dominated data is calculated using 1-second bins in cleaned event files. If a bin has >2000 counts, and if more than 50% of those come from <1% of pixels, then it is considered to be noise-dominated and hence unusable.
| Quadrant | # 1 sec bins | Bins with >0 counts | Bins with >2000 counts | High rate bins dominated by noise | Noise dominated (total time) | Noise dominated (detector-on time) | Marked lightcurve |
|---|---|---|---|---|---|---|---|
| A | 11669 | 10164 | 52 | 52 | 0.45% | 0.51% | 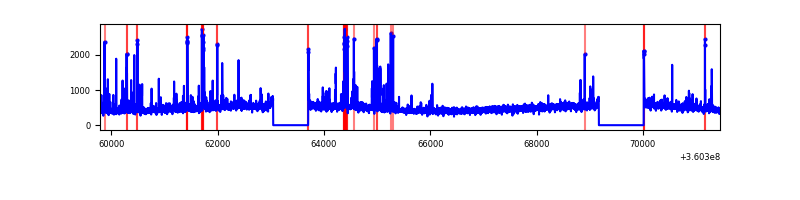 |
| B | 11668 | 10163 | 71 | 71 | 0.61% | 0.70% | 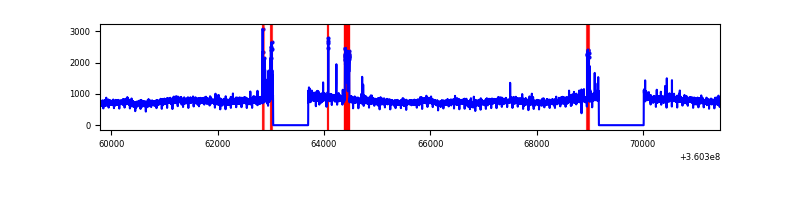 |
| C | 11668 | 10163 | 122 | 122 | 1.05% | 1.20% |  |
| D | 11668 | 10163 | 1027 | 1027 | 8.80% | 10.11% | 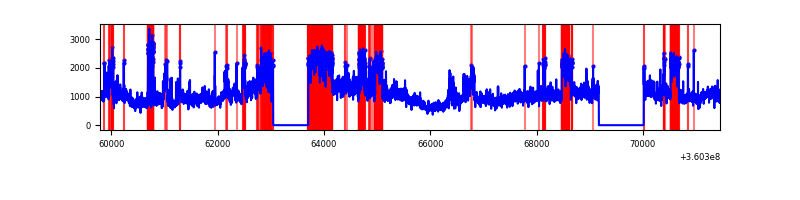 |
Top three noisy pixels from each quadrant. If the there are fewer than three noisy pixels in the level2.evt file, extra rows are filled as -1
| Pixel properties | Quadrant properties | ||||||
|---|---|---|---|---|---|---|---|
| Quadrant | DetID | PixID | Counts | Sigma | Mean | Median | Sigma |
| A | 0 | 13 | 393091 | 1570.04 | 1242 | 1218 | 249.6 |
| A | 8 | 192 | 25105 | 95.7 | 1242 | 1218 | 249.6 |
| A | 13 | 254 | 18409 | 68.87 | 1242 | 1218 | 249.6 |
| B | 6 | 159 | 2934364 | 12463.34 | 1225 | 1192 | 235.3 |
| B | 6 | 36 | 127668 | 537.41 | 1225 | 1192 | 235.3 |
| B | 5 | 172 | 71434 | 298.47 | 1225 | 1192 | 235.3 |
| C | 10 | 22 | 762995 | 2742.74 | 1184 | 1193 | 277.8 |
| C | 3 | 233 | 269411 | 965.67 | 1184 | 1193 | 277.8 |
| C | 14 | 238 | 190536 | 681.7 | 1184 | 1193 | 277.8 |
| D | 8 | 195 | 6181787 | 22339.72 | 1161 | 1131 | 276.7 |
| D | 1 | 52 | 1201613 | 4339.09 | 1161 | 1131 | 276.7 |
| D | 10 | 253 | 170858 | 613.47 | 1161 | 1131 | 276.7 |
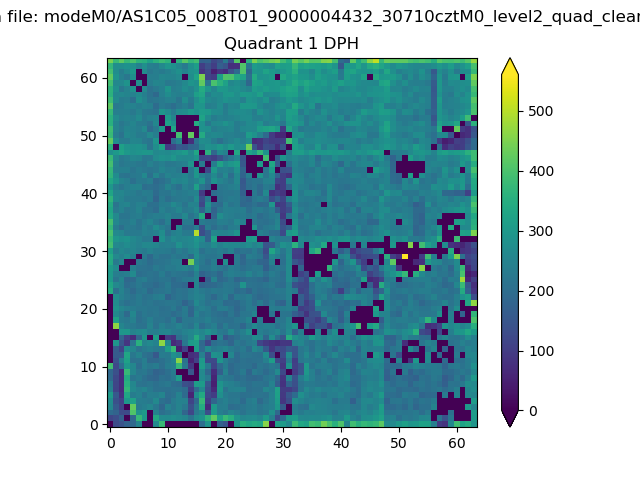
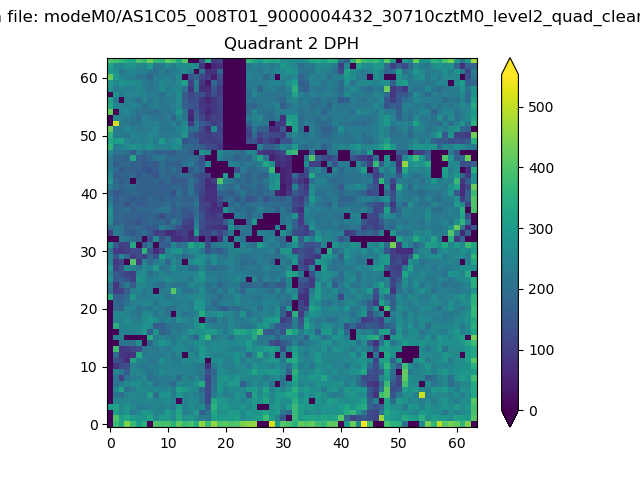
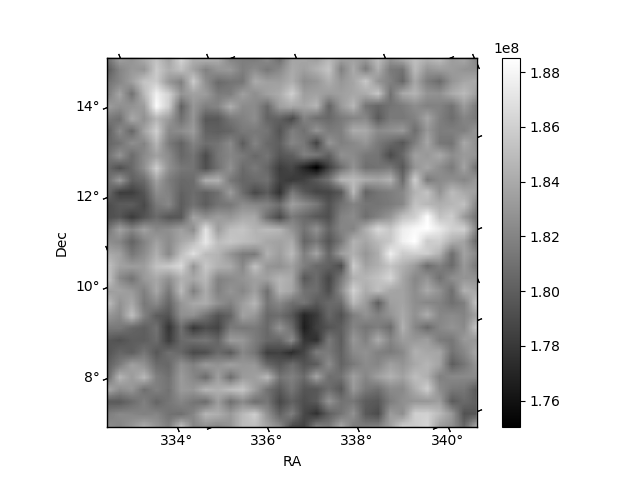
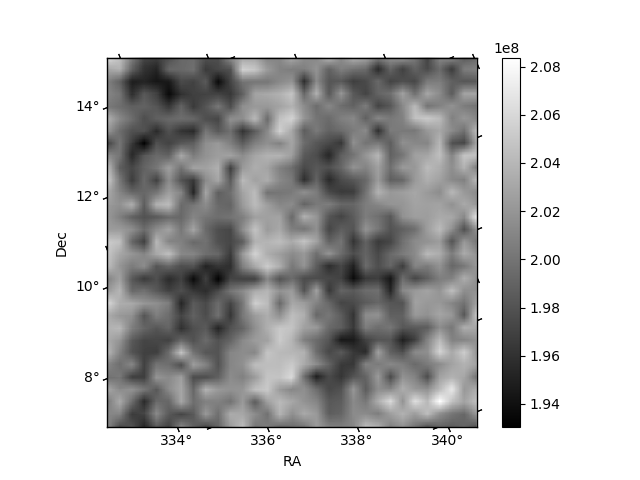
Histogram calculated using DETX and DETY for each event in the final _common_clean file
| Quadrant A |  |
 |
Quadrant B |
|---|---|---|---|
| Quadrant D | 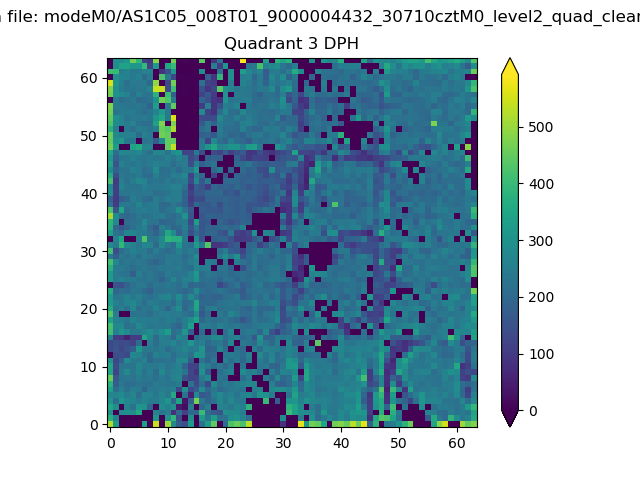 |
 |
Quadrant C |
| Plot type | Count rate plots | Images |
|---|---|---|
| Comparison with Poisson distribution Blue bars denote a histogram of data divided into 1 sec bins. Red curve is a Poisson curve with rate = median count rate of data. |
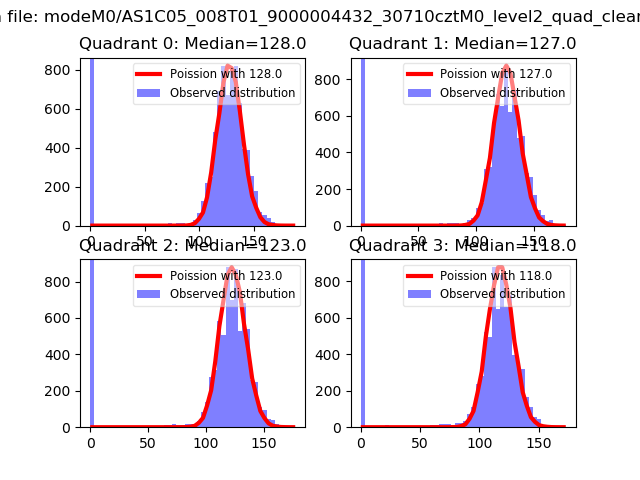 |
 |
| Quadrant-wise count rates Data is divided into 100 sec bins |
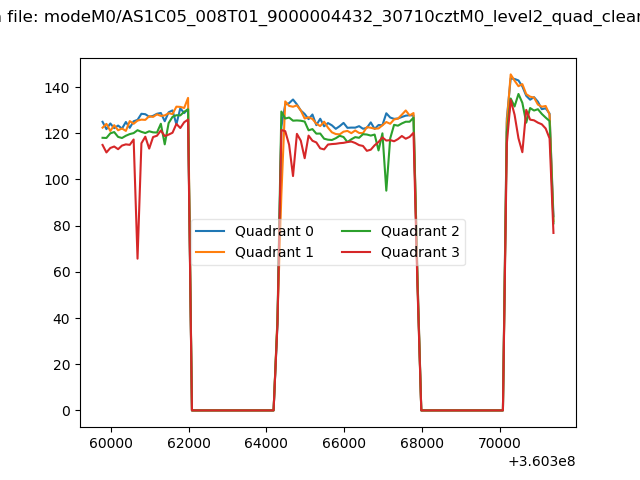 |
|
| Module-wise count rates for Quadrant A Data is divided into 100 sec bins |
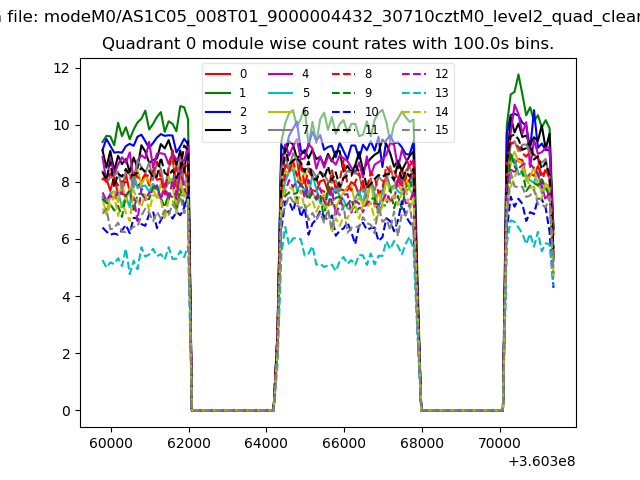 |
 |
| Module-wise count rates for Quadrant B Data is divided into 100 sec bins |
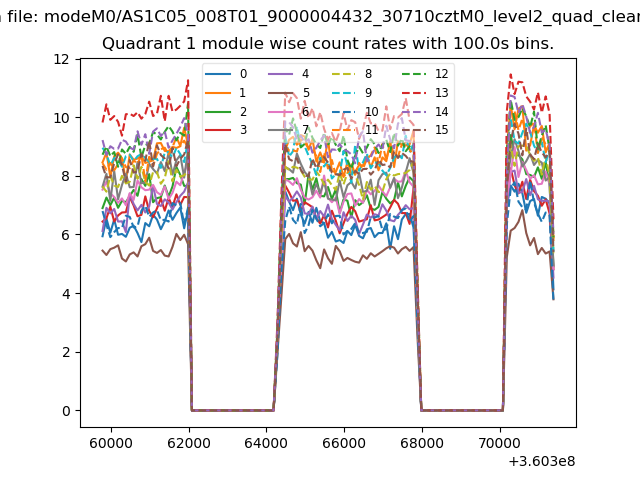 |
 |
| Module-wise count rates for Quadrant C Data is divided into 100 sec bins |
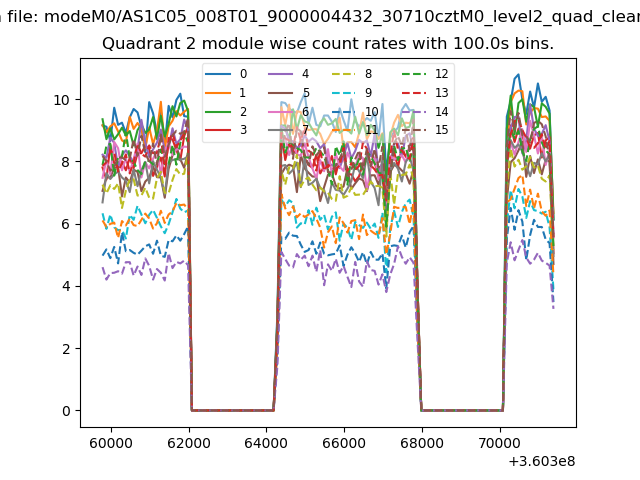 |
 |
| Module-wise count rates for Quadrant D Data is divided into 100 sec bins |
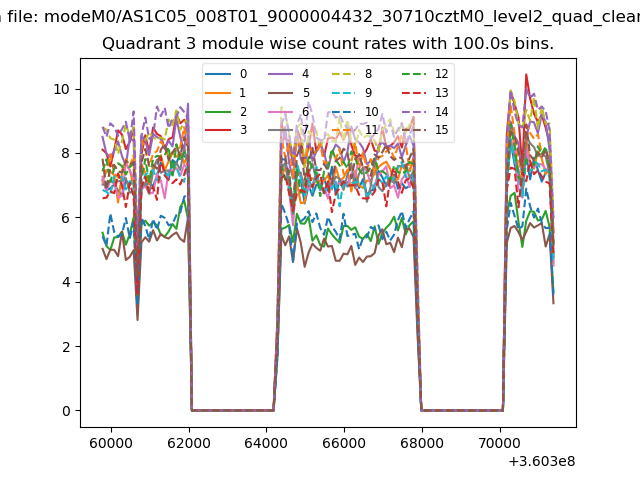 |
 |
| Parameter | Plot |
|---|---|
| CZT HV Monitor |  |
| D_VDD | 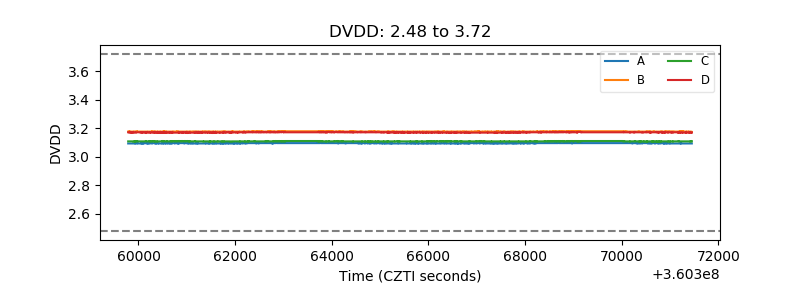 |
| Temperature 1 | 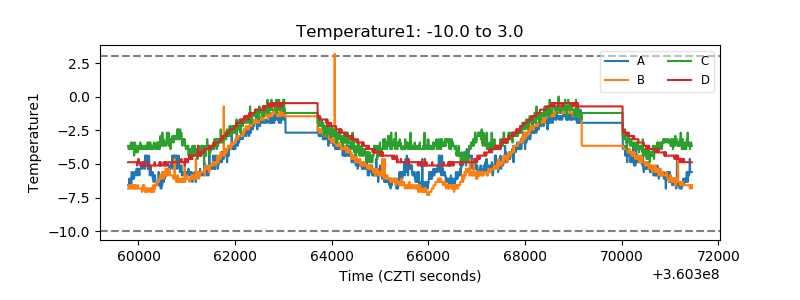 |
| Veto HV Monitor | 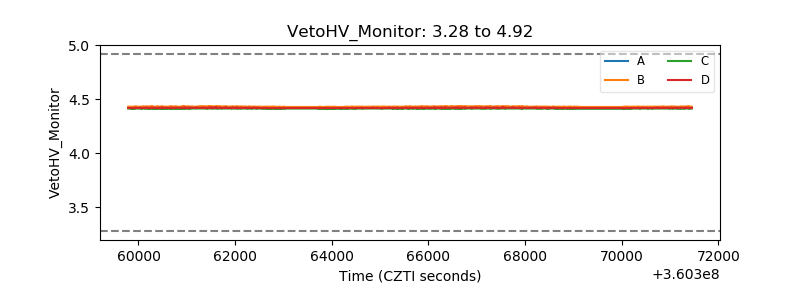 |
| Veto LLD | 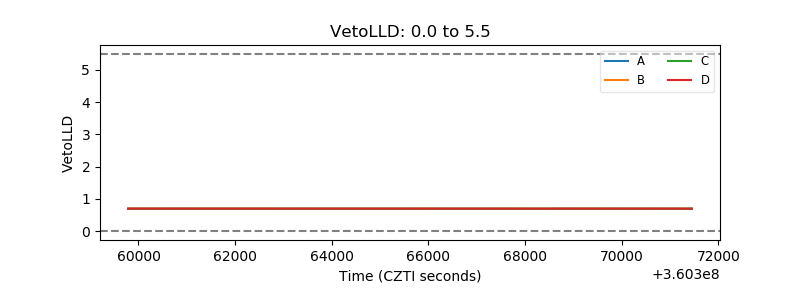 |
| Alpha Counter | 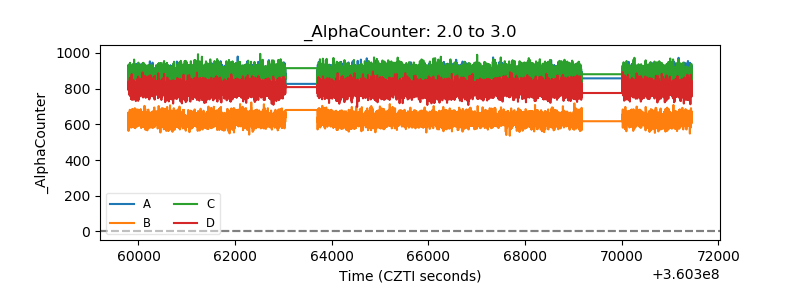 |
| _CPM_Rate | 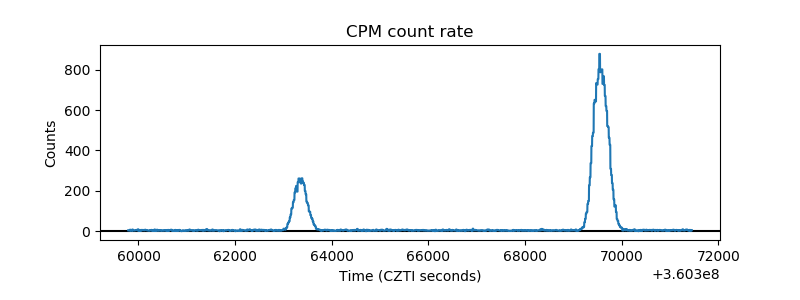 |
| CZT Counter | 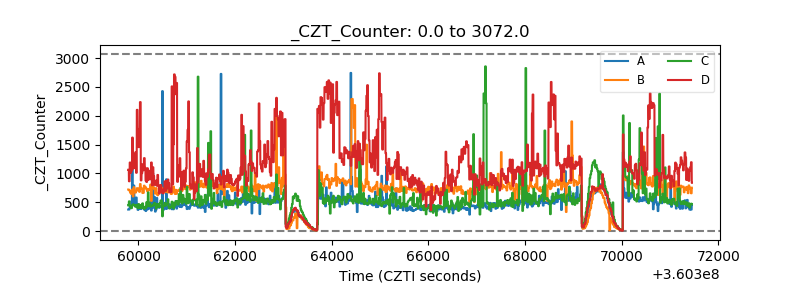 |
| +2.5 Volts monitor | 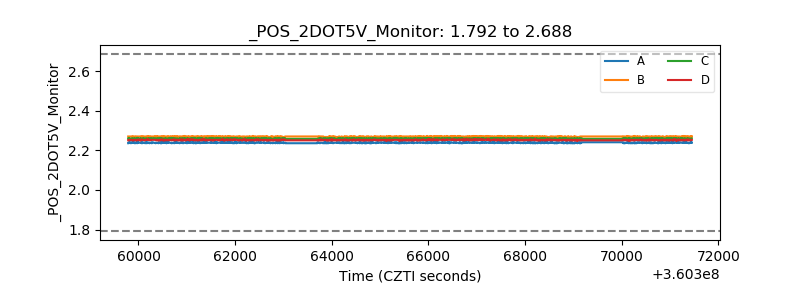 |
| +5 Volts monitor |  |
| _ROLL_ROT | 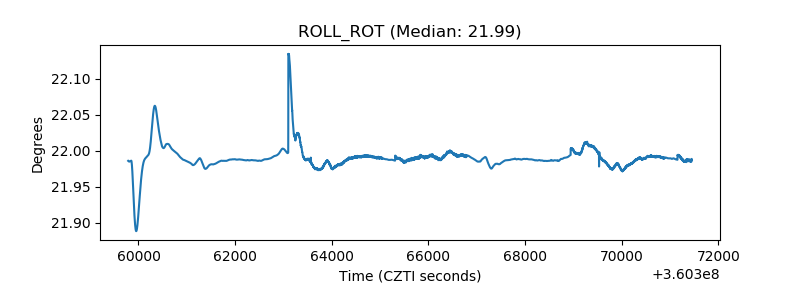 |
| _Roll_DEC | 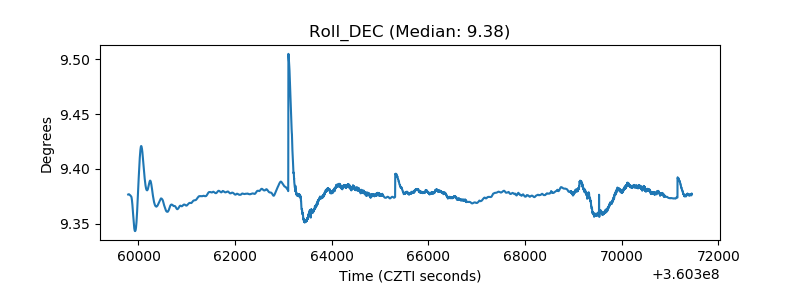 |
| _Roll_RA | 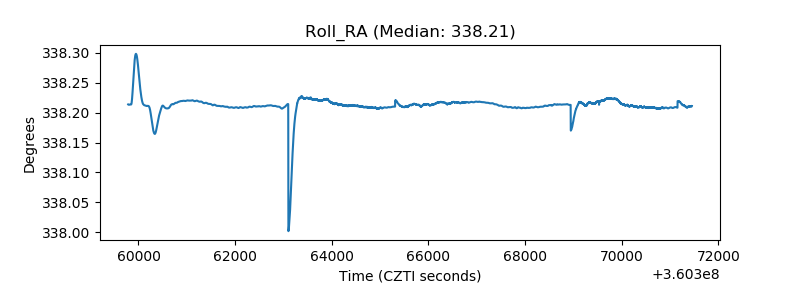 |
| Veto Counter | 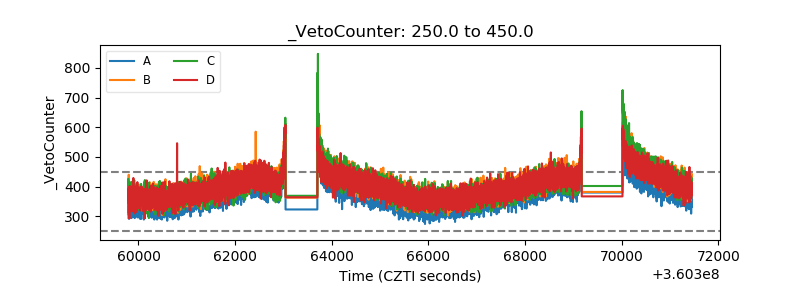 |