| Param | Original file | Final file |
|---|---|---|
| Filename | modeM0/AS1C05_008T01_9000004432_30711cztM0_level2.evt | modeM0/AS1C05_008T01_9000004432_30711cztM0_level2_quad_clean.evt |
| Size (bytes) | 230,463,360 | 40,703,040 |
| Size | 219.8 MB | 38.8 MB |
| Events in quadrant A | 1,139,632 | 276,272 |
| Events in quadrant B | 1,768,855 | 274,275 |
| Events in quadrant C | 1,433,943 | 264,496 |
| Events in quadrant D | 2,480,646 | 252,506 |
| Mode M0 | |||
|---|---|---|---|
| Quadrant | BADHDUFLAG | Total packets | Discarded packets |
| A | 0 | 4921 | 1 |
| B | 0 | 6923 | 1 |
| C | 0 | 5748 | 1 |
| D | 0 | 8969 | 1 |
| Mode M9 | |||
|---|---|---|---|
| Quadrant | BADHDUFLAG | Total packets | Discarded packets |
| A | 0 | 6 | 0 |
| B | 0 | 7 | 0 |
| C | 0 | 7 | 0 |
| D | 0 | 7 | 0 |
| Mode SS | |||
|---|---|---|---|
| Quadrant | BADHDUFLAG | Total packets | Discarded packets |
| A | 0 | 46 | 0 |
| B | 0 | 46 | 0 |
| C | 0 | 46 | 0 |
| D | 0 | 46 | 0 |
| Quadrant | Total seconds | Saturated seconds | Saturation percentage |
|---|---|---|---|
| A | 2282 | 12 | 0.525855% |
| B | 2282 | 16 | 0.701139% |
| C | 2282 | 121 | 5.302366% |
| D | 2282 | 149 | 6.529360% |
Noise dominated data is calculated using 1-second bins in cleaned event files. If a bin has >2000 counts, and if more than 50% of those come from <1% of pixels, then it is considered to be noise-dominated and hence unusable.
| Quadrant | # 1 sec bins | Bins with >0 counts | Bins with >2000 counts | High rate bins dominated by noise | Noise dominated (total time) | Noise dominated (detector-on time) | Marked lightcurve |
|---|---|---|---|---|---|---|---|
| A | 2282 | 2282 | 6 | 6 | 0.26% | 0.26% | 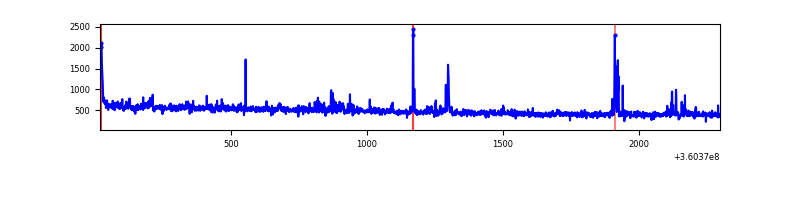 |
| B | 2282 | 2282 | 1 | 1 | 0.04% | 0.04% | 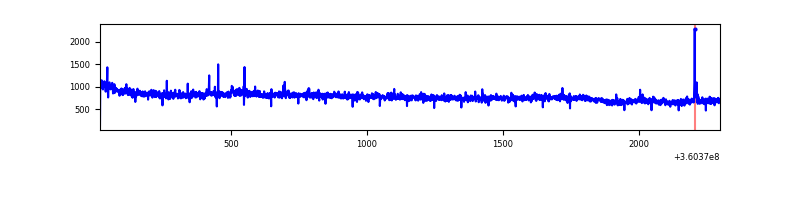 |
| C | 2282 | 2282 | 35 | 35 | 1.53% | 1.53% | 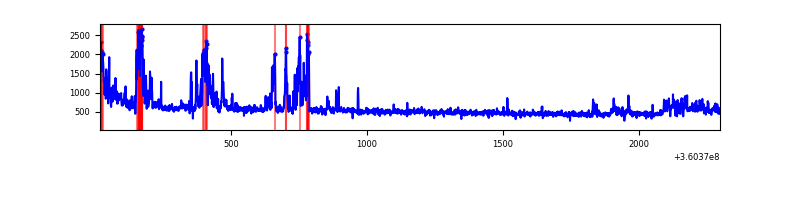 |
| D | 2282 | 2282 | 138 | 138 | 6.05% | 6.05% | 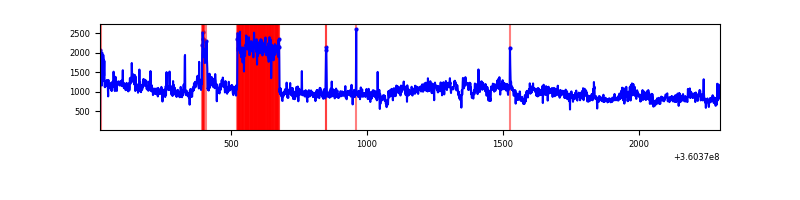 |
Top three noisy pixels from each quadrant. If the there are fewer than three noisy pixels in the level2.evt file, extra rows are filled as -1
| Pixel properties | Quadrant properties | ||||||
|---|---|---|---|---|---|---|---|
| Quadrant | DetID | PixID | Counts | Sigma | Mean | Median | Sigma |
| A | 0 | 13 | 61108 | 1060.87 | 275 | 270 | 57.3 |
| A | 8 | 192 | 12295 | 209.69 | 275 | 270 | 57.3 |
| A | 13 | 254 | 3906 | 63.4 | 275 | 270 | 57.3 |
| B | 6 | 159 | 657870 | 11846.86 | 277 | 271 | 55.5 |
| B | 0 | 190 | 8789 | 153.45 | 277 | 271 | 55.5 |
| B | 12 | 111 | 6662 | 115.14 | 277 | 271 | 55.5 |
| C | 10 | 22 | 278357 | 4276.71 | 269 | 271 | 65.0 |
| C | 14 | 238 | 43434 | 663.81 | 269 | 271 | 65.0 |
| C | 0 | 10 | 33860 | 516.57 | 269 | 271 | 65.0 |
| D | 8 | 195 | 1416133 | 21914.4 | 267 | 260 | 64.6 |
| D | 13 | 174 | 13969 | 212.18 | 267 | 260 | 64.6 |
| D | 2 | 234 | 9233 | 138.88 | 267 | 260 | 64.6 |
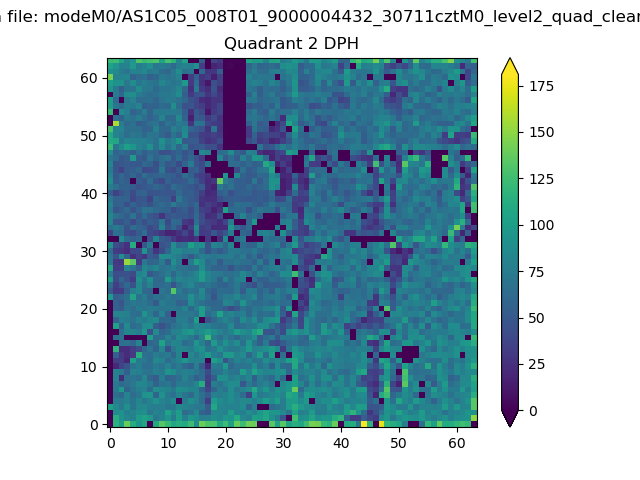
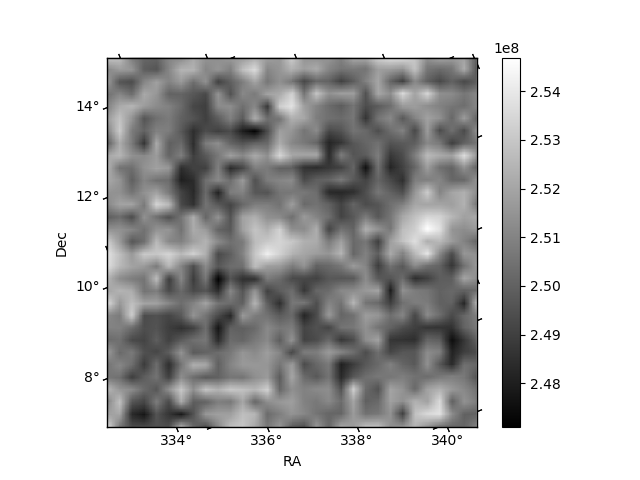
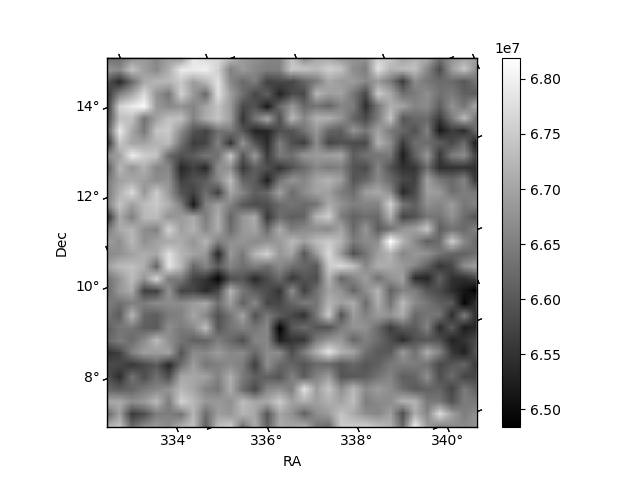
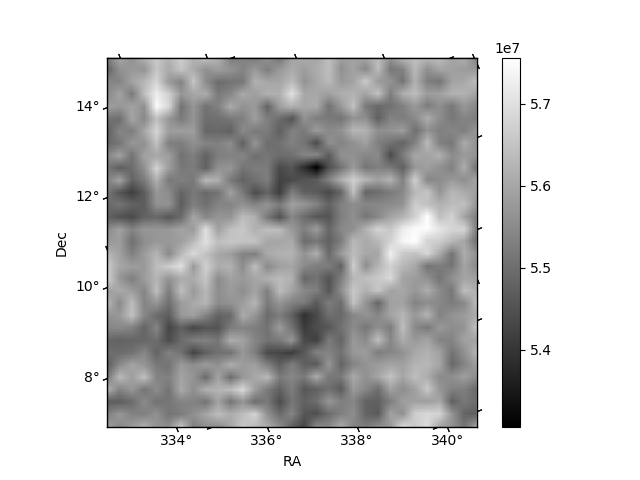
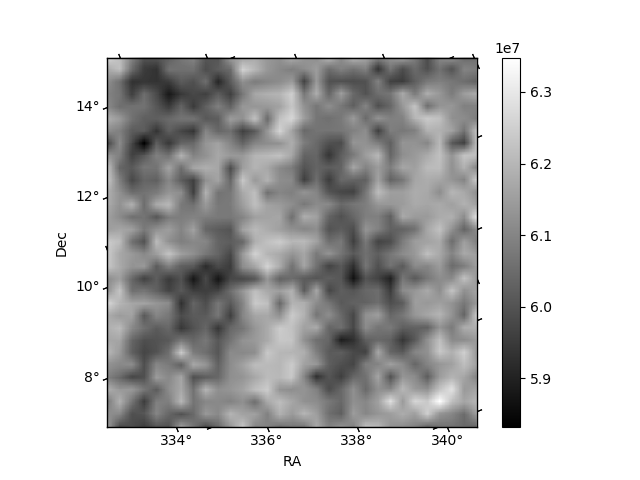
Histogram calculated using DETX and DETY for each event in the final _common_clean file
| Quadrant A | 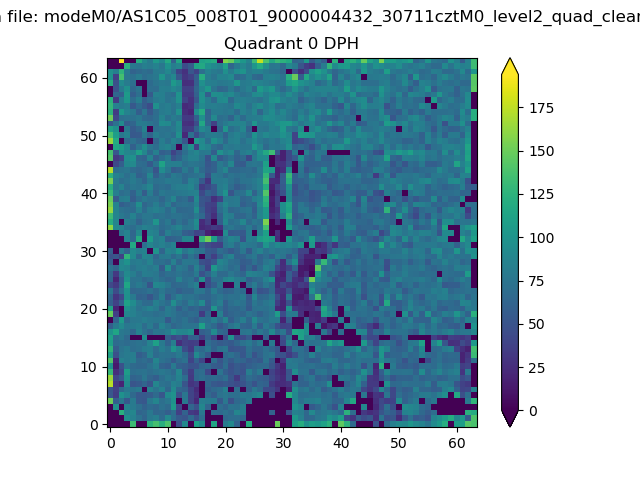 |
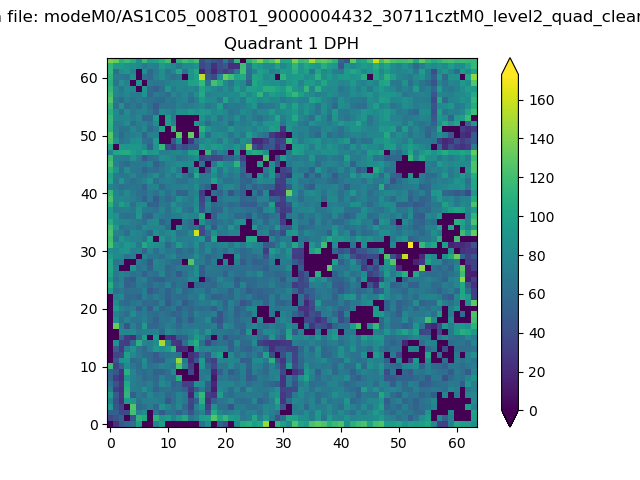 |
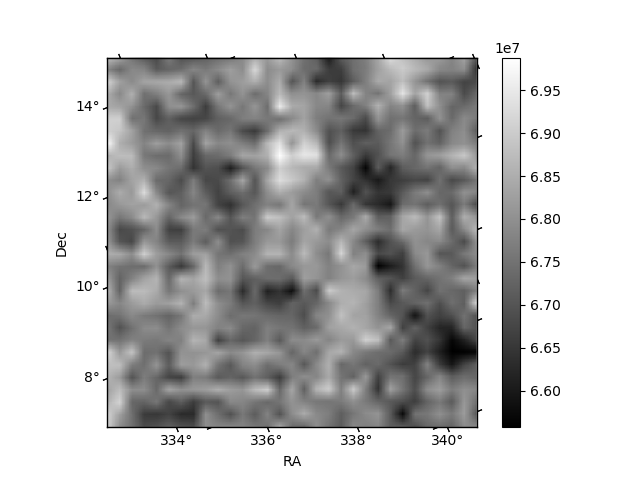
Quadrant B |
|---|---|---|---|
| Quadrant D | 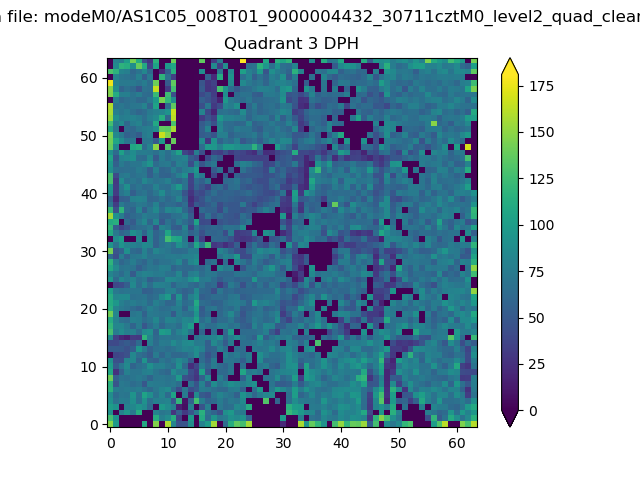 |
 |
Quadrant C |
| Plot type | Count rate plots | Images |
|---|---|---|
| Comparison with Poisson distribution Blue bars denote a histogram of data divided into 1 sec bins. Red curve is a Poisson curve with rate = median count rate of data. |
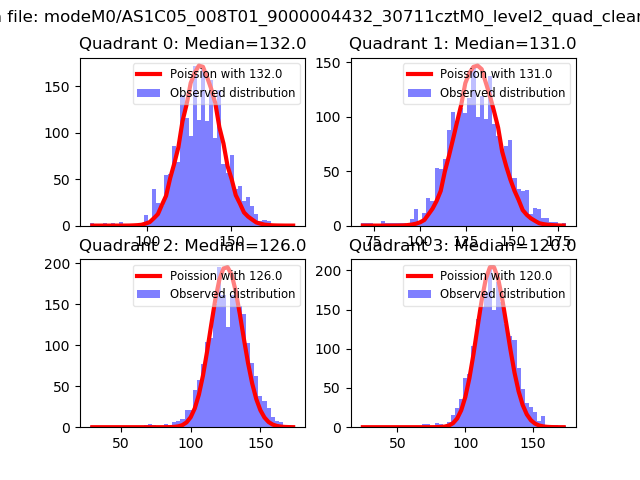 |
 |
| Quadrant-wise count rates Data is divided into 100 sec bins |
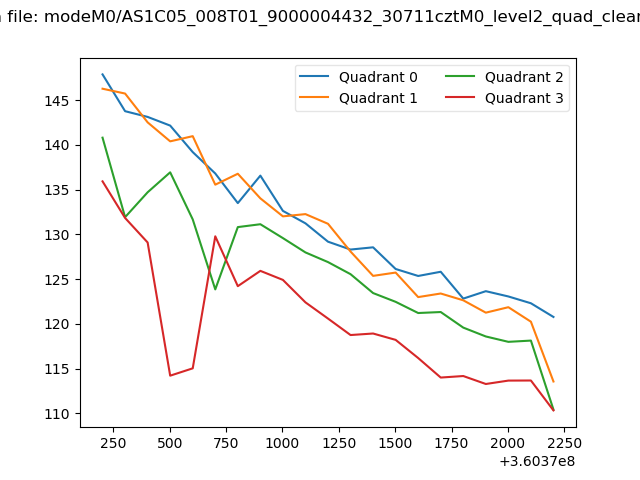 |
|
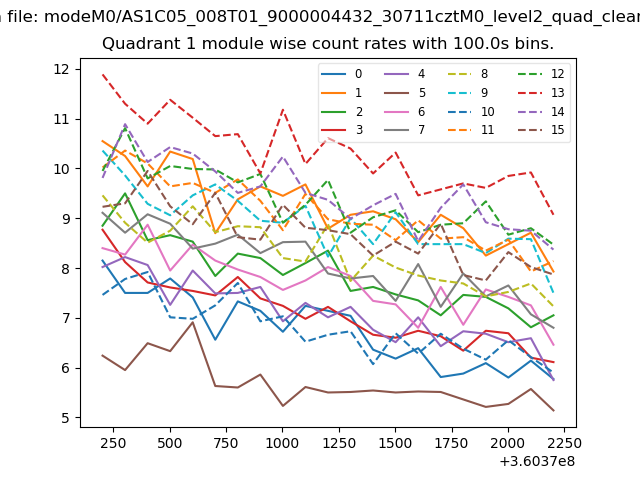
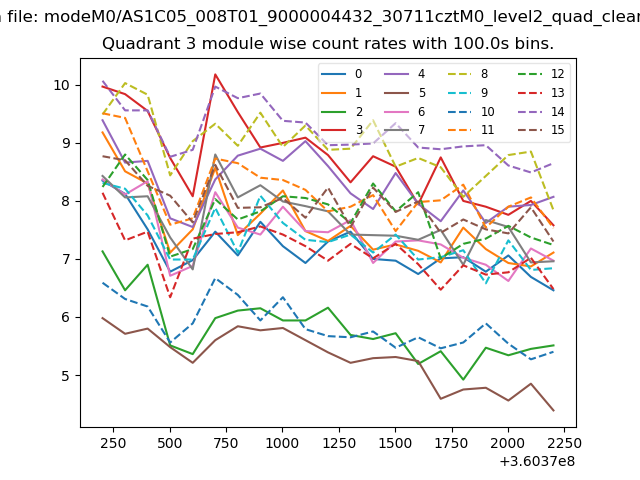
| Module-wise count rates for Quadrant A Data is divided into 100 sec bins |
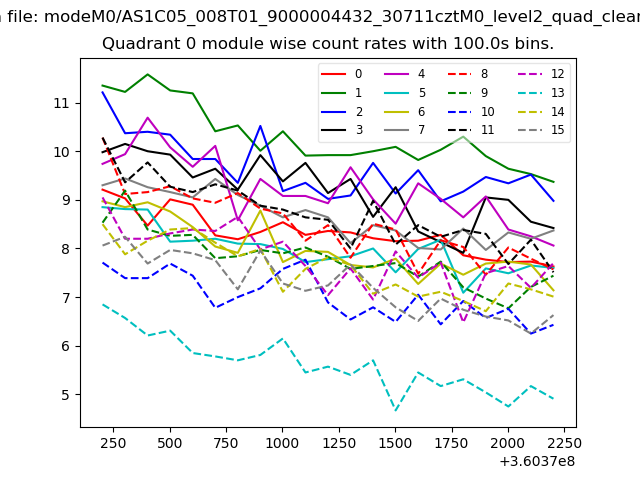 |
 |
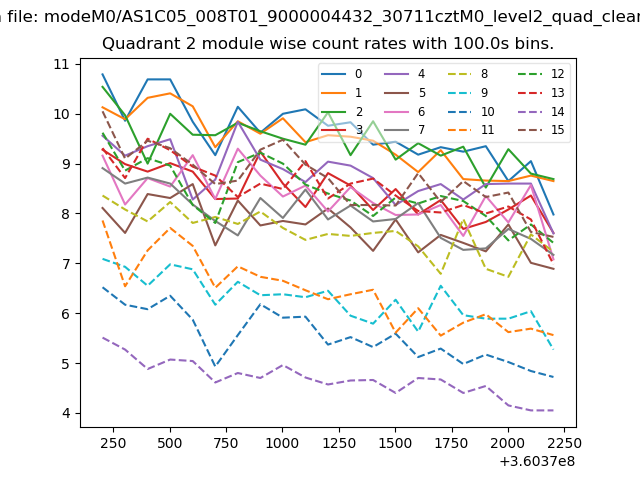
| Module-wise count rates for Quadrant B Data is divided into 100 sec bins |
 |
 |
| Module-wise count rates for Quadrant C Data is divided into 100 sec bins |
 |
 |
| Module-wise count rates for Quadrant D Data is divided into 100 sec bins |
 |
 |
| Parameter | Plot |
|---|---|
| CZT HV Monitor |  |
| D_VDD | 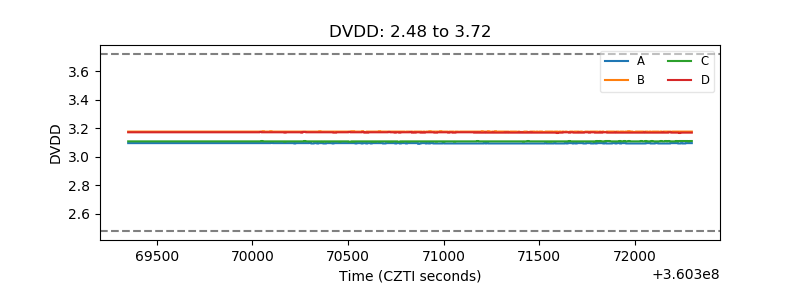 |
| Temperature 1 | 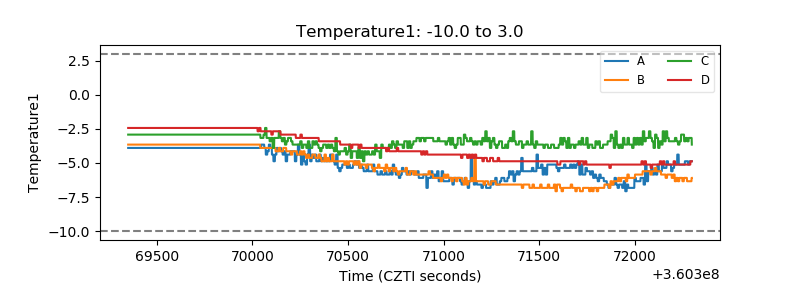 |
| Veto HV Monitor | 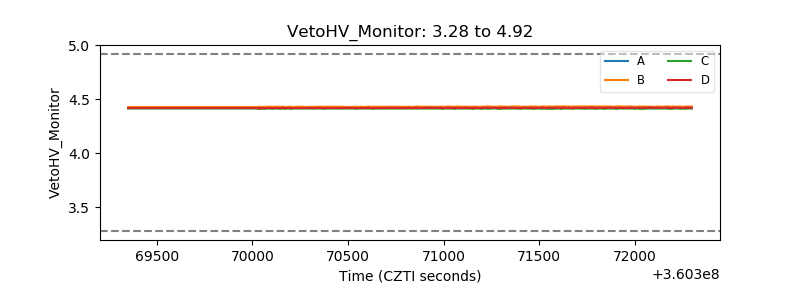 |
| Veto LLD | 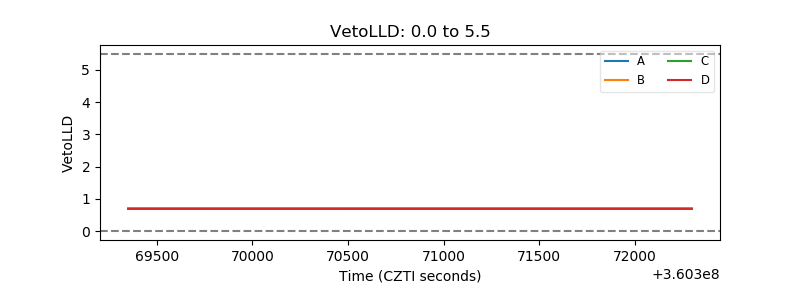 |
| Alpha Counter | 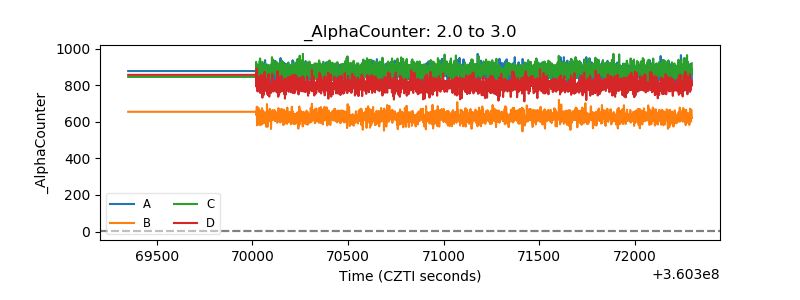 |
| _CPM_Rate | 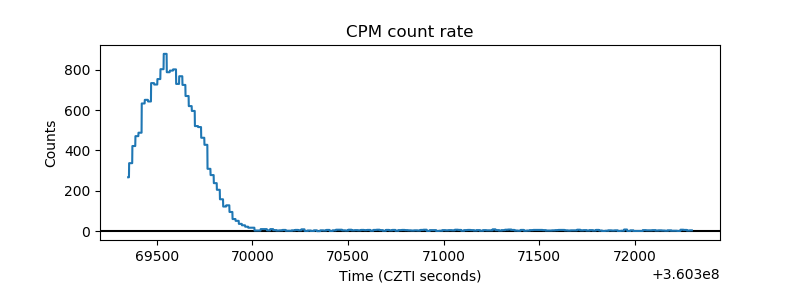 |
| CZT Counter | 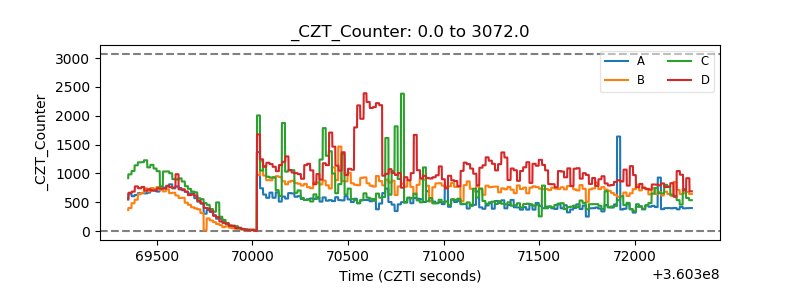 |
| +2.5 Volts monitor |  |
| +5 Volts monitor |  |
| _ROLL_ROT | 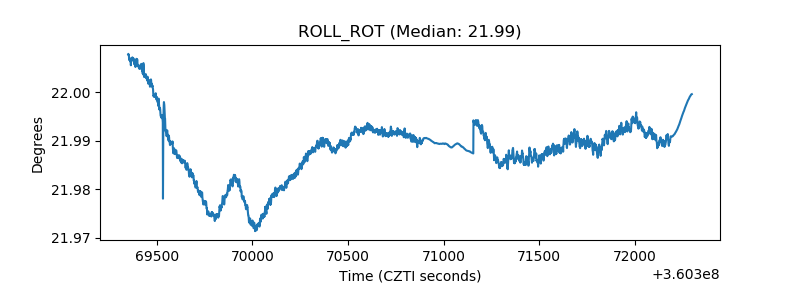 |
| _Roll_DEC | 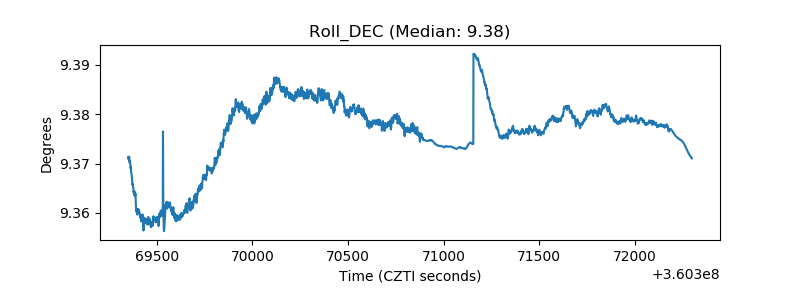 |
| _Roll_RA | 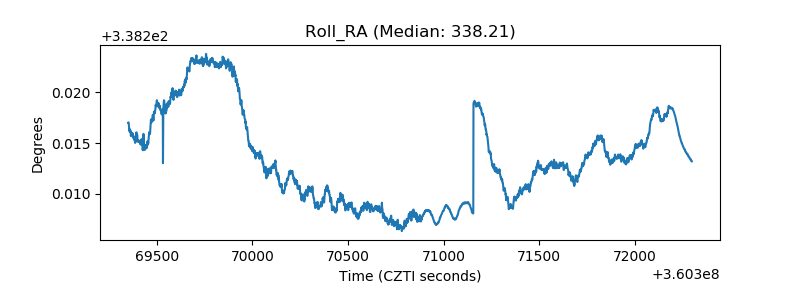 |
| Veto Counter | 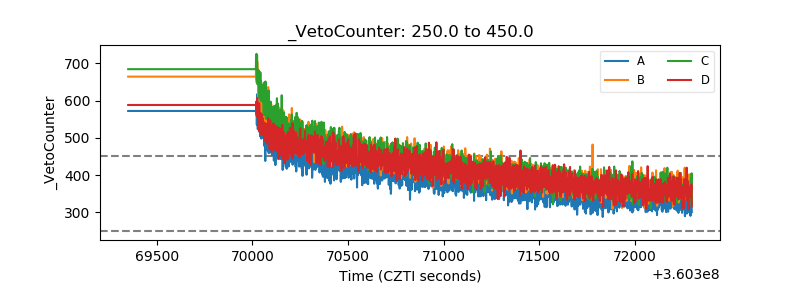 |