| Param | Original file | Final file |
|---|---|---|
| Filename | modeM0/AS1A10_071T11_9000004436_30724cztM0_level2.evt | modeM0/AS1A10_071T11_9000004436_30724cztM0_level2_quad_clean.evt |
| Size (bytes) | 459,256,320 | 58,803,840 |
| Size | 438.0 MB | 56.1 MB |
| Events in quadrant A | 2,524,799 | 371,459 |
| Events in quadrant B | 3,838,300 | 369,805 |
| Events in quadrant C | 2,463,945 | 354,956 |
| Events in quadrant D | 4,744,335 | 334,846 |
| Mode SS | |||
|---|---|---|---|
| Quadrant | BADHDUFLAG | Total packets | Discarded packets |
| A | 0 | 102 | 0 |
| B | 0 | 102 | 0 |
| C | 0 | 102 | 0 |
| D | 0 | 102 | 0 |
| Mode M9 | |||
|---|---|---|---|
| Quadrant | BADHDUFLAG | Total packets | Discarded packets |
| A | 0 | 7 | 0 |
| B | 0 | 7 | 0 |
| C | 0 | 7 | 0 |
| D | 0 | 7 | 0 |
| Mode M0 | |||
|---|---|---|---|
| Quadrant | BADHDUFLAG | Total packets | Discarded packets |
| A | 0 | 10656 | 1 |
| B | 0 | 14973 | 2 |
| C | 0 | 10369 | 1 |
| D | 0 | 17756 | 1 |
| Quadrant | Total seconds | Saturated seconds | Saturation percentage |
|---|---|---|---|
| A | 4978 | 29 | 0.582563% |
| B | 4977 | 76 | 1.527024% |
| C | 4977 | 61 | 1.225638% |
| D | 4977 | 189 | 3.797468% |
Noise dominated data is calculated using 1-second bins in cleaned event files. If a bin has >2000 counts, and if more than 50% of those come from <1% of pixels, then it is considered to be noise-dominated and hence unusable.
| Quadrant | # 1 sec bins | Bins with >0 counts | Bins with >2000 counts | High rate bins dominated by noise | Noise dominated (total time) | Noise dominated (detector-on time) | Marked lightcurve |
|---|---|---|---|---|---|---|---|
| A | 5708 | 4978 | 5 | 5 | 0.09% | 0.10% | 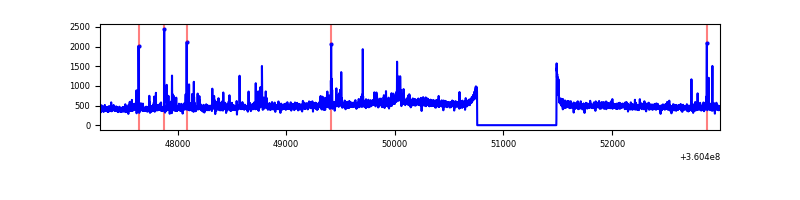 |
| B | 5707 | 4977 | 0 | 0 | 0.00% | 0.00% | 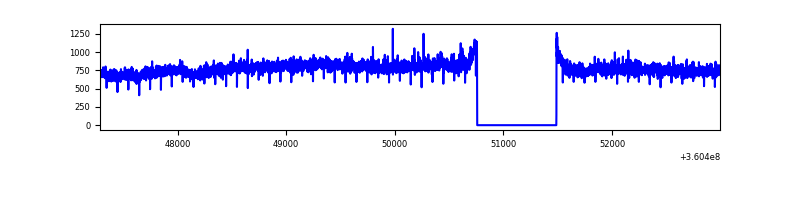 |
| C | 5707 | 4977 | 0 | 0 | 0.00% | 0.00% | 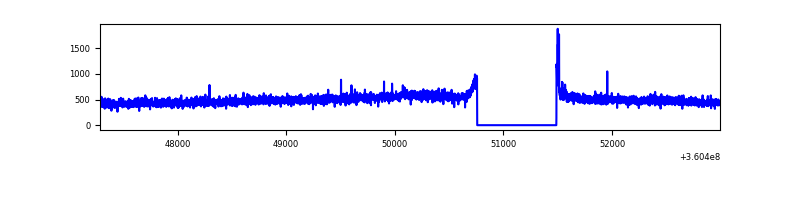 |
| D | 5707 | 4977 | 134 | 134 | 2.35% | 2.69% | 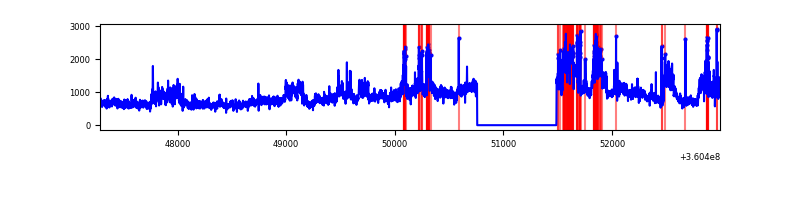 |
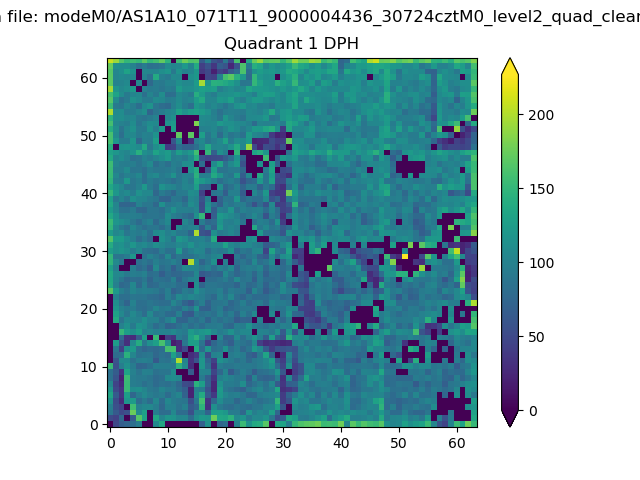
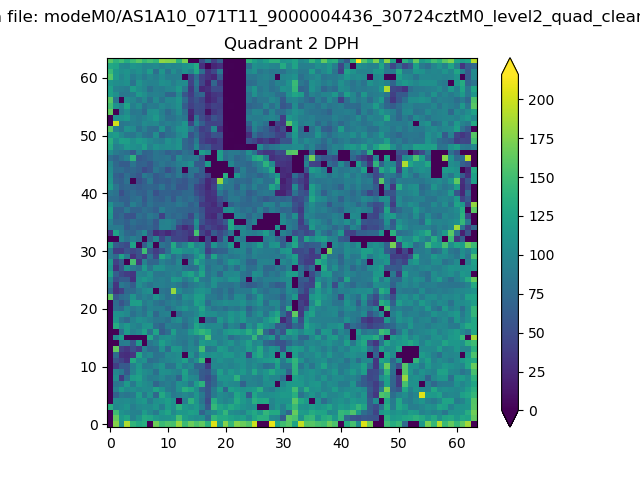
Top three noisy pixels from each quadrant. If the there are fewer than three noisy pixels in the level2.evt file, extra rows are filled as -1
| Pixel properties | Quadrant properties | ||||||
|---|---|---|---|---|---|---|---|
| Quadrant | DetID | PixID | Counts | Sigma | Mean | Median | Sigma |
| A | 0 | 13 | 123065 | 977.53 | 613 | 600 | 125.3 |
| A | 8 | 192 | 32449 | 254.22 | 613 | 600 | 125.3 |
| A | 13 | 254 | 8997 | 67.03 | 613 | 600 | 125.3 |
| B | 6 | 159 | 1434070 | 12041.2 | 607 | 591 | 119.0 |
| B | 12 | 111 | 14796 | 119.32 | 607 | 591 | 119.0 |
| B | 11 | 111 | 13640 | 109.61 | 607 | 591 | 119.0 |
| C | 14 | 238 | 92645 | 657.79 | 587 | 590 | 139.9 |
| C | 3 | 233 | 47066 | 332.1 | 587 | 590 | 139.9 |
| C | 2 | 114 | 11912 | 80.9 | 587 | 590 | 139.9 |
| D | 8 | 195 | 2211136 | 15726.75 | 585 | 571 | 140.6 |
| D | 10 | 253 | 148363 | 1051.45 | 585 | 571 | 140.6 |
| D | 13 | 168 | 55583 | 391.38 | 585 | 571 | 140.6 |
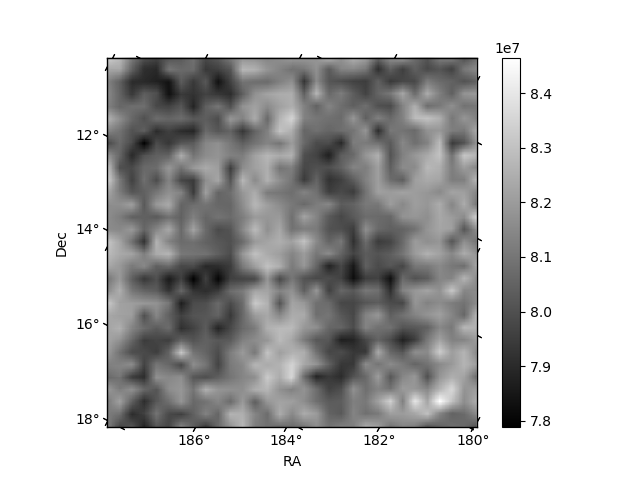
Histogram calculated using DETX and DETY for each event in the final _common_clean file
| Quadrant A | 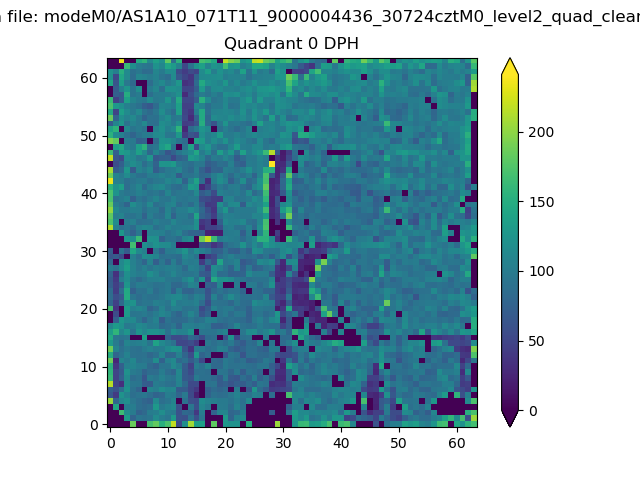 |
 |
Quadrant B |
|---|---|---|---|
| Quadrant D | 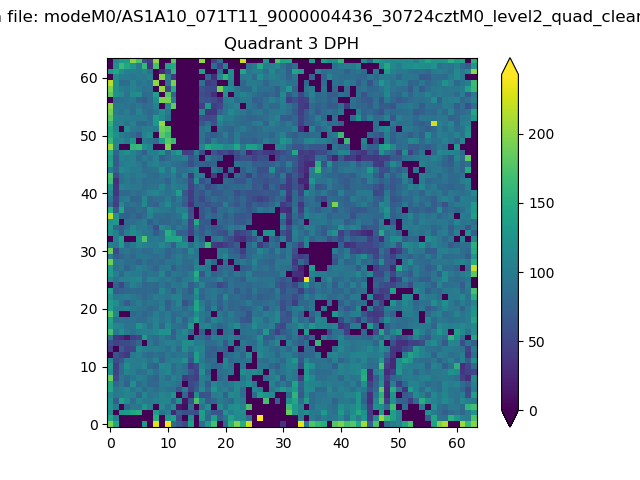 |
 |
Quadrant C |
| Plot type | Count rate plots | Images |
|---|---|---|
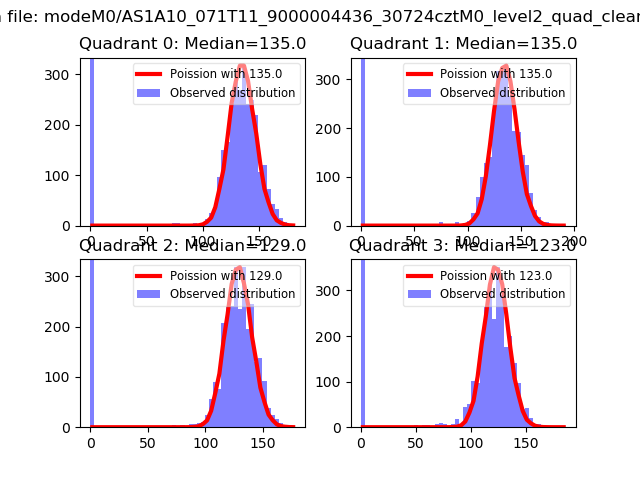
| Comparison with Poisson distribution Blue bars denote a histogram of data divided into 1 sec bins. Red curve is a Poisson curve with rate = median count rate of data. |
 |
 |
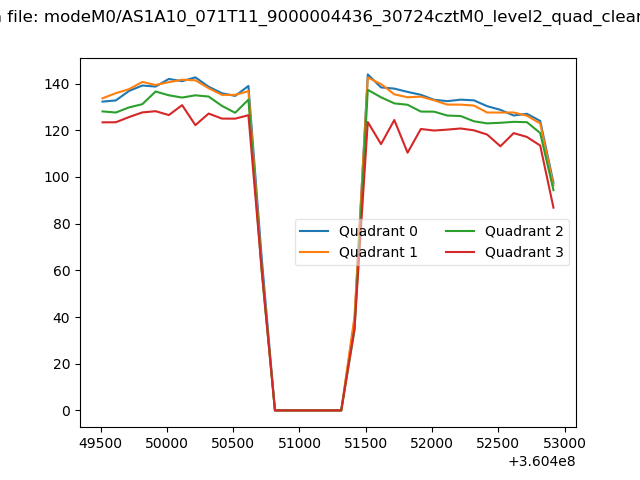
| Quadrant-wise count rates Data is divided into 100 sec bins |
 |
|
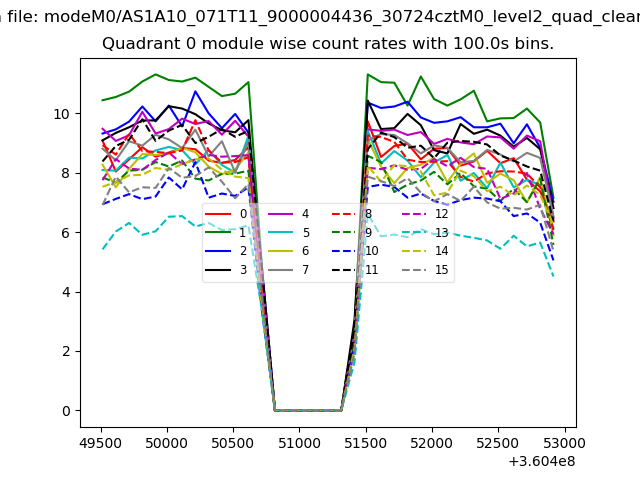
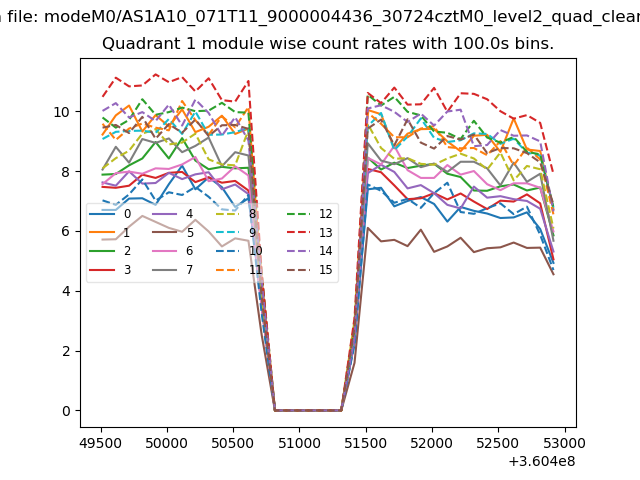
| Module-wise count rates for Quadrant A Data is divided into 100 sec bins |
 |
 |
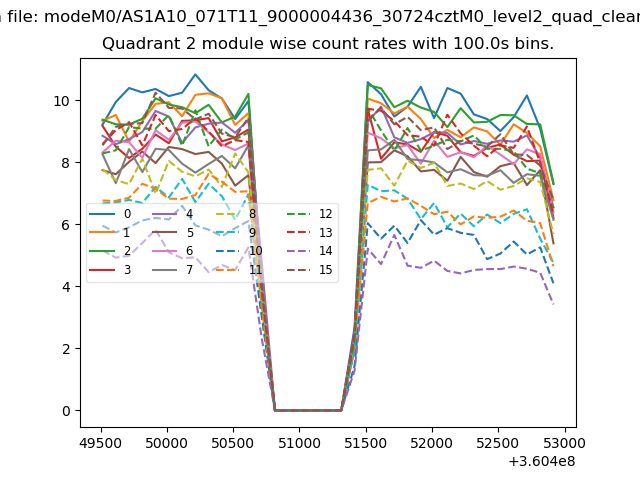
| Module-wise count rates for Quadrant B Data is divided into 100 sec bins |
 |
 |
| Module-wise count rates for Quadrant C Data is divided into 100 sec bins |
 |
 |
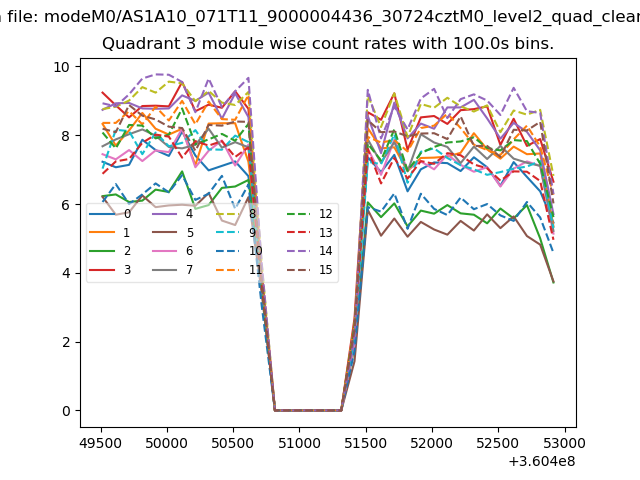
| Module-wise count rates for Quadrant D Data is divided into 100 sec bins |
 |
 |
| Parameter | Plot |
|---|---|
| CZT HV Monitor | 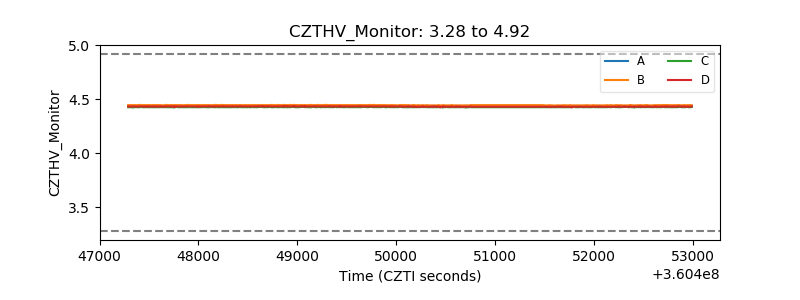 |
| D_VDD |  |
| Temperature 1 | 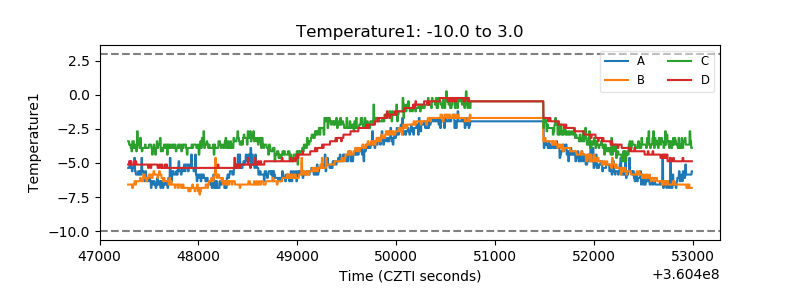 |
| Veto HV Monitor |  |
| Veto LLD | 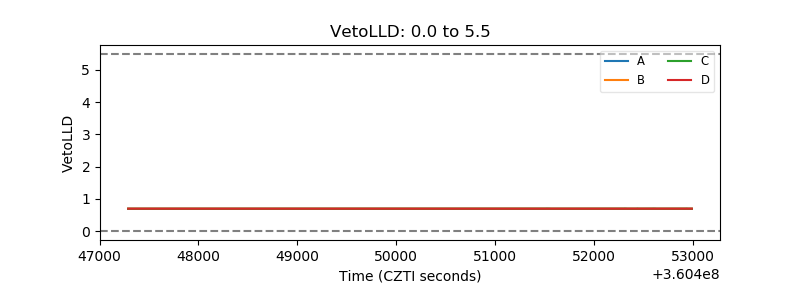 |
| Alpha Counter | 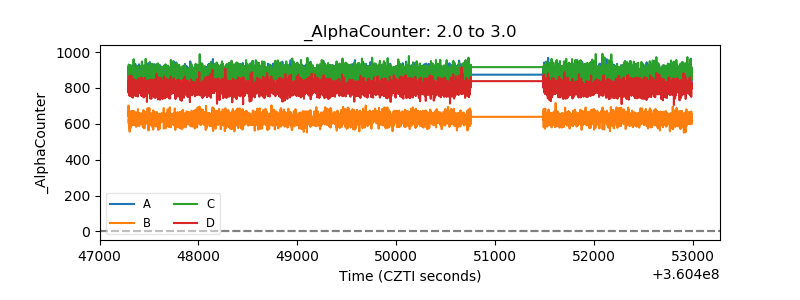 |
| _CPM_Rate | 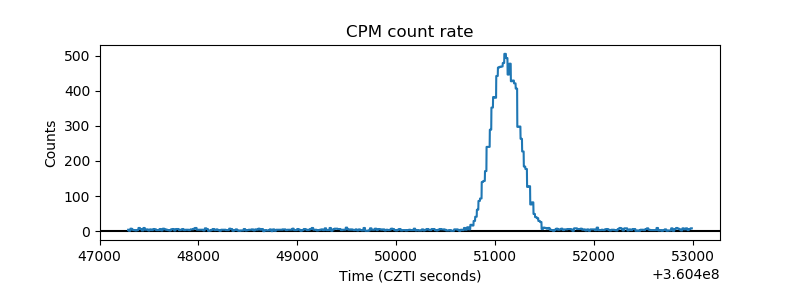 |
| CZT Counter | 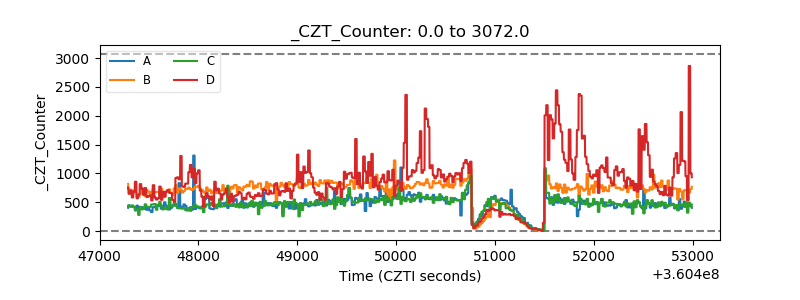 |
| +2.5 Volts monitor |  |
| +5 Volts monitor |  |
| _ROLL_ROT | 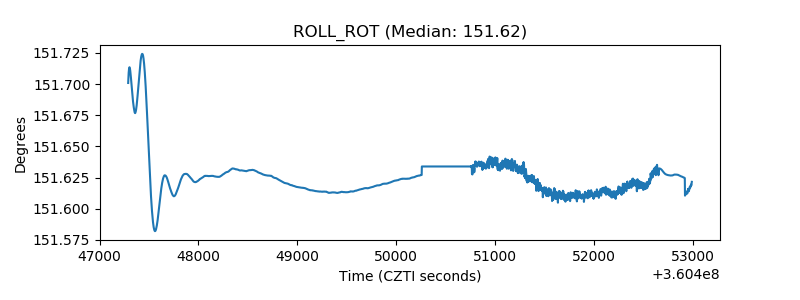 |
| _Roll_DEC | 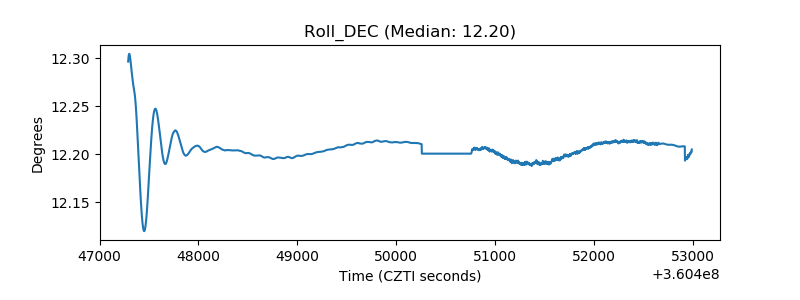 |
| _Roll_RA |  |
| Veto Counter | 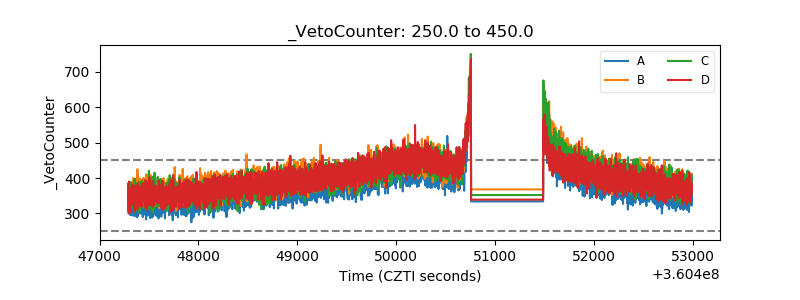 |