| Param | Original file | Final file |
|---|---|---|
| Filename | modeM0/AS1A10_071T11_9000004436_30725cztM0_level2.evt | modeM0/AS1A10_071T11_9000004436_30725cztM0_level2_quad_clean.evt |
| Size (bytes) | 633,769,920 | 89,608,320 |
| Size | 604.4 MB | 85.5 MB |
| Events in quadrant A | 3,814,336 | 578,214 |
| Events in quadrant B | 5,256,056 | 579,385 |
| Events in quadrant C | 3,422,749 | 553,439 |
| Events in quadrant D | 6,237,388 | 524,504 |
| Mode SS | |||
|---|---|---|---|
| Quadrant | BADHDUFLAG | Total packets | Discarded packets |
| A | 0 | 140 | 0 |
| B | 0 | 140 | 0 |
| C | 0 | 140 | 0 |
| D | 0 | 140 | 0 |
| Mode M9 | |||
|---|---|---|---|
| Quadrant | BADHDUFLAG | Total packets | Discarded packets |
| A | 0 | 13 | 0 |
| B | 0 | 14 | 0 |
| C | 0 | 14 | 0 |
| D | 0 | 14 | 0 |
| Mode M0 | |||
|---|---|---|---|
| Quadrant | BADHDUFLAG | Total packets | Discarded packets |
| A | 0 | 15569 | 2 |
| B | 0 | 20689 | 2 |
| C | 0 | 14365 | 2 |
| D | 0 | 23686 | 2 |
| Quadrant | Total seconds | Saturated seconds | Saturation percentage |
|---|---|---|---|
| A | 6858 | 102 | 1.487314% |
| B | 6858 | 60 | 0.874891% |
| C | 6858 | 67 | 0.976961% |
| D | 6858 | 212 | 3.091280% |
Noise dominated data is calculated using 1-second bins in cleaned event files. If a bin has >2000 counts, and if more than 50% of those come from <1% of pixels, then it is considered to be noise-dominated and hence unusable.
| Quadrant | # 1 sec bins | Bins with >0 counts | Bins with >2000 counts | High rate bins dominated by noise | Noise dominated (total time) | Noise dominated (detector-on time) | Marked lightcurve |
|---|---|---|---|---|---|---|---|
| A | 7768 | 6859 | 58 | 58 | 0.75% | 0.85% | 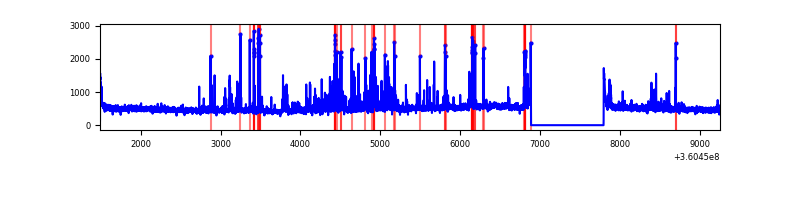 |
| B | 7768 | 6858 | 3 | 3 | 0.04% | 0.04% | 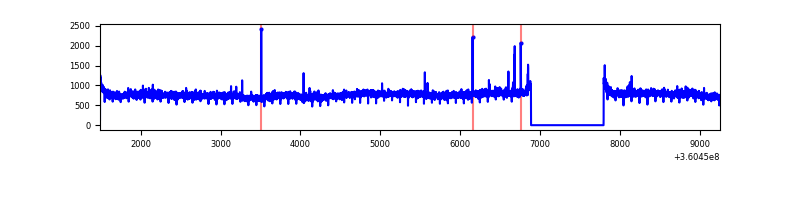 |
| C | 7768 | 6859 | 0 | 0 | 0.00% | 0.00% |  |
| D | 7768 | 6858 | 225 | 225 | 2.90% | 3.28% | 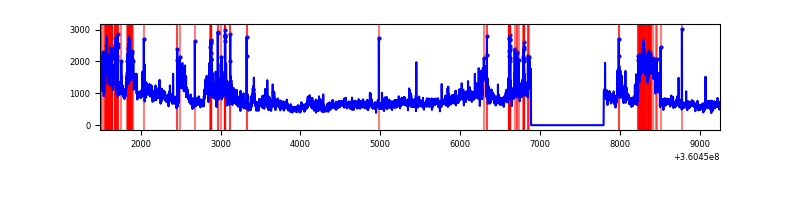 |
Top three noisy pixels from each quadrant. If the there are fewer than three noisy pixels in the level2.evt file, extra rows are filled as -1
| Pixel properties | Quadrant properties | ||||||
|---|---|---|---|---|---|---|---|
| Quadrant | DetID | PixID | Counts | Sigma | Mean | Median | Sigma |
| A | 0 | 13 | 493234 | 2924.88 | 834 | 815 | 168.4 |
| A | 8 | 192 | 102495 | 603.96 | 834 | 815 | 168.4 |
| A | 13 | 254 | 11861 | 65.61 | 834 | 815 | 168.4 |
| B | 6 | 159 | 1957137 | 12199.94 | 830 | 809 | 160.4 |
| B | 12 | 111 | 20368 | 121.97 | 830 | 809 | 160.4 |
| B | 11 | 111 | 18193 | 108.41 | 830 | 809 | 160.4 |
| C | 14 | 238 | 128952 | 679.37 | 801 | 808 | 188.6 |
| C | 3 | 233 | 102518 | 539.23 | 801 | 808 | 188.6 |
| C | 0 | 10 | 25320 | 129.95 | 801 | 808 | 188.6 |
| D | 8 | 195 | 2740162 | 14323.65 | 796 | 775 | 191.2 |
| D | 13 | 249 | 87272 | 452.27 | 796 | 775 | 191.2 |
| D | 10 | 253 | 84910 | 439.92 | 796 | 775 | 191.2 |
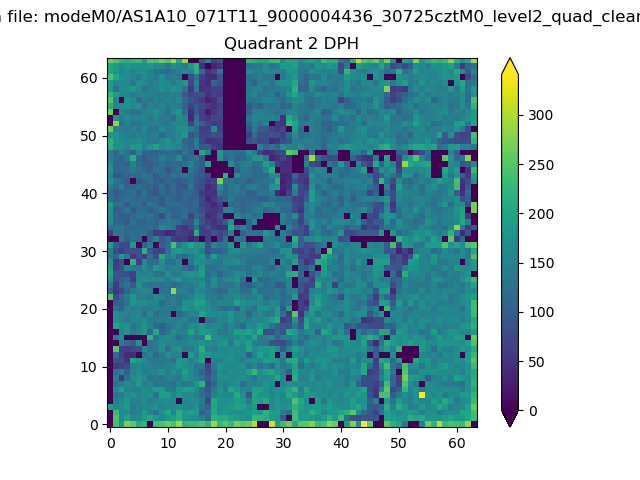
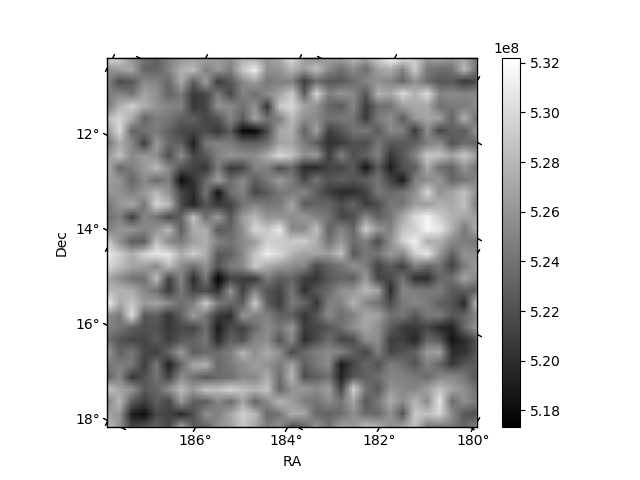
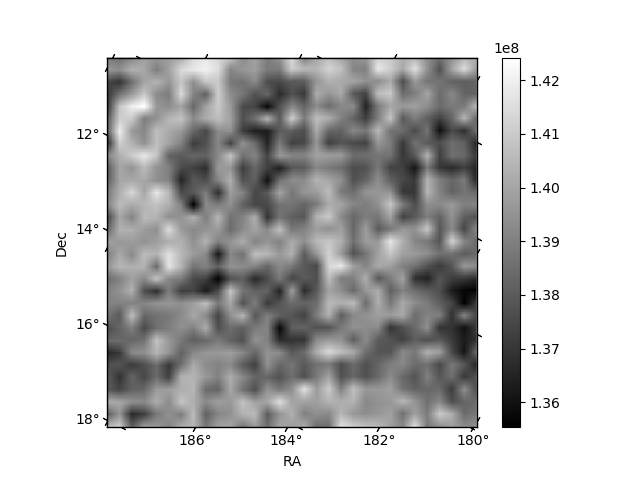
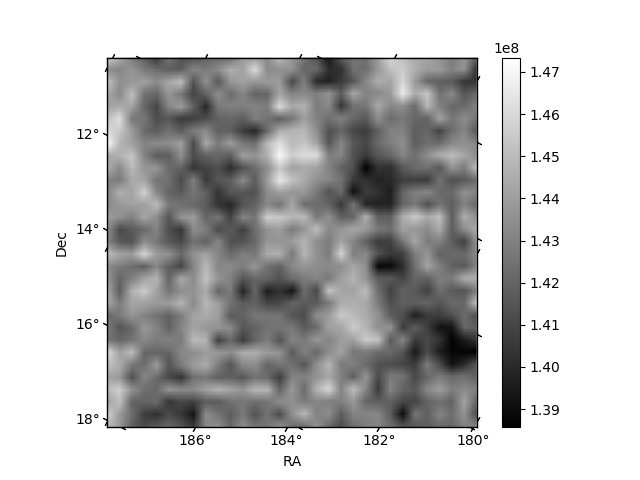
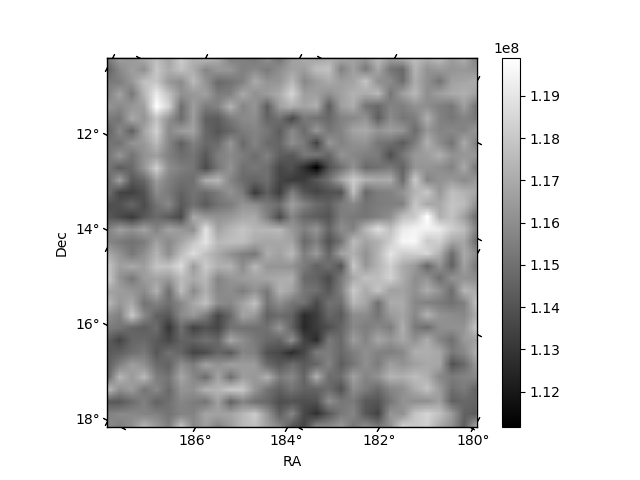
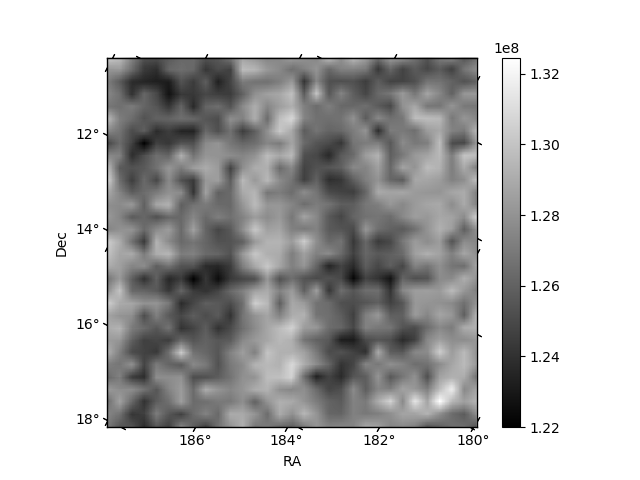
Histogram calculated using DETX and DETY for each event in the final _common_clean file
| Quadrant A | 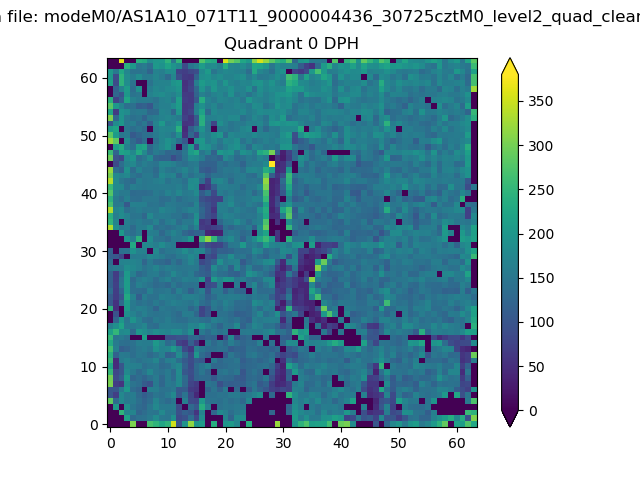 |
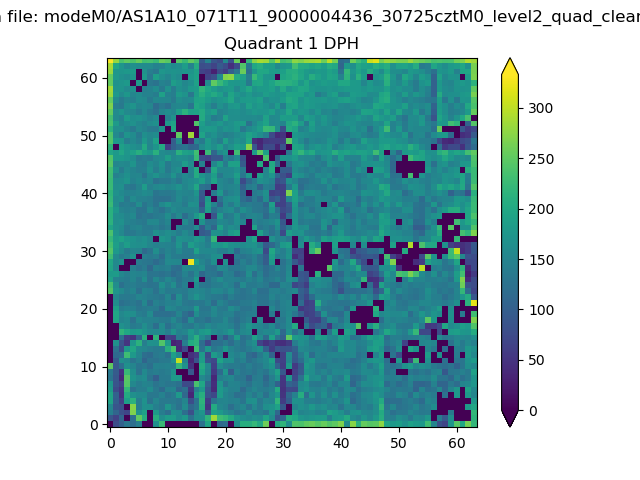 |
Quadrant B |
|---|---|---|---|
| Quadrant D | 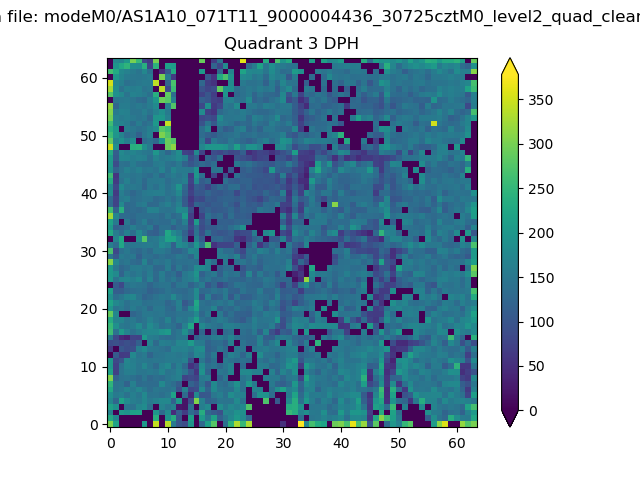 |
 |
Quadrant C |
| Plot type | Count rate plots | Images |
|---|---|---|
| Comparison with Poisson distribution Blue bars denote a histogram of data divided into 1 sec bins. Red curve is a Poisson curve with rate = median count rate of data. |
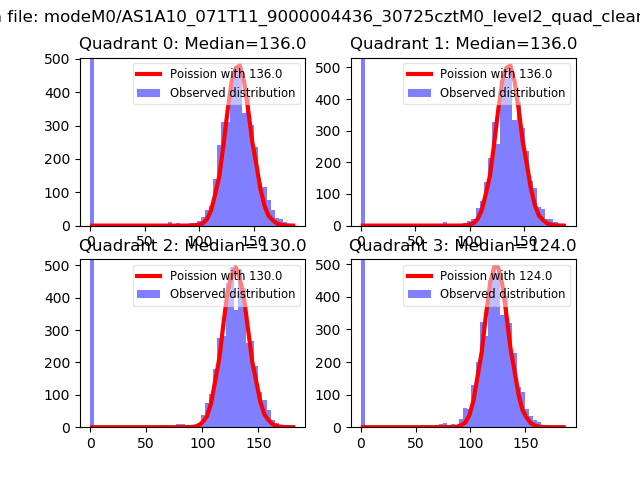 |
 |
| Quadrant-wise count rates Data is divided into 100 sec bins |
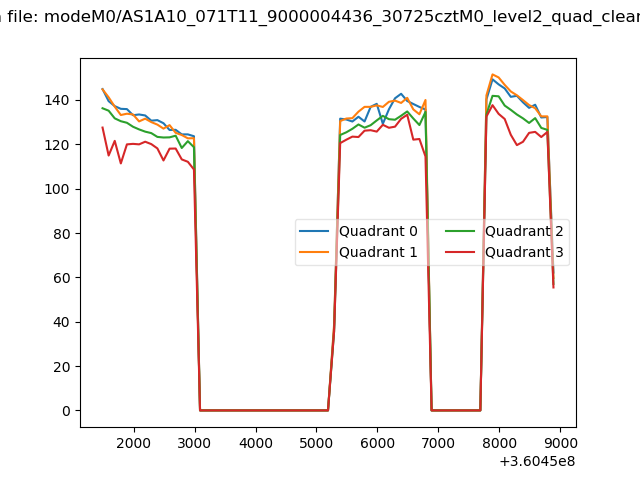 |
|
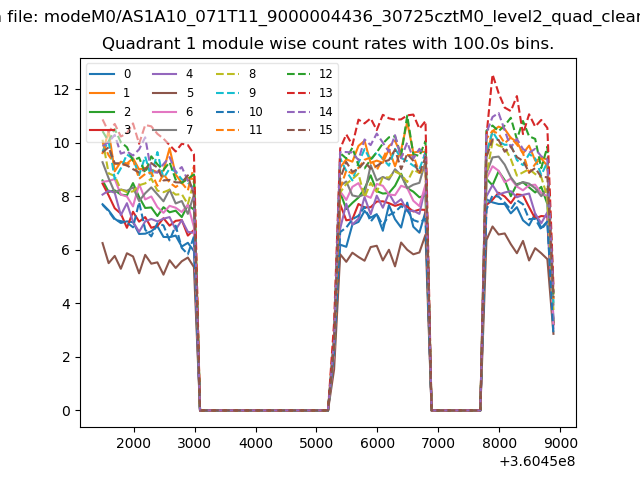
| Module-wise count rates for Quadrant A Data is divided into 100 sec bins |
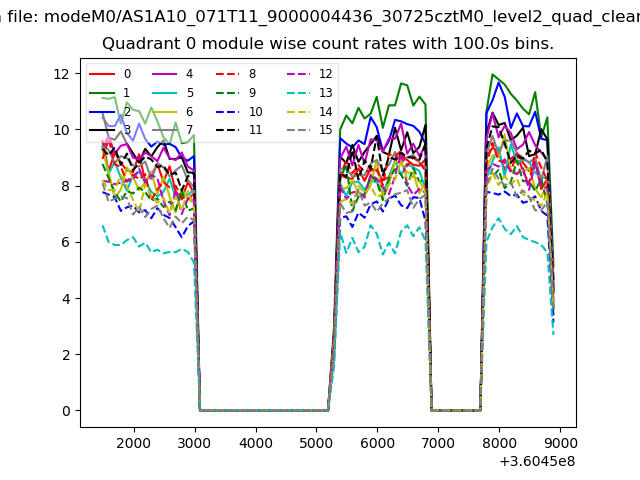 |
 |
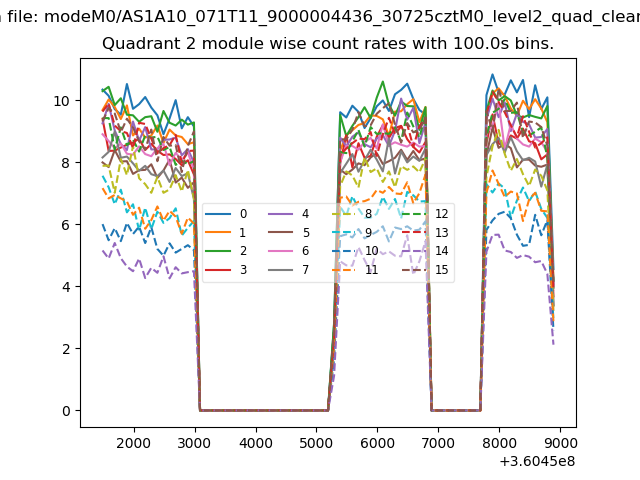
| Module-wise count rates for Quadrant B Data is divided into 100 sec bins |
 |
 |
| Module-wise count rates for Quadrant C Data is divided into 100 sec bins |
 |
 |
| Module-wise count rates for Quadrant D Data is divided into 100 sec bins |
 |
 |
| Parameter | Plot |
|---|---|
| CZT HV Monitor | 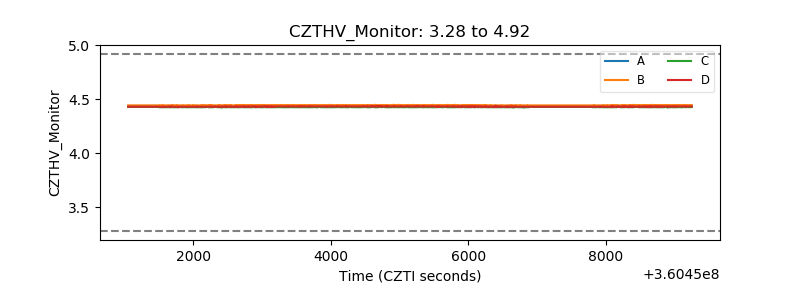 |
| D_VDD | 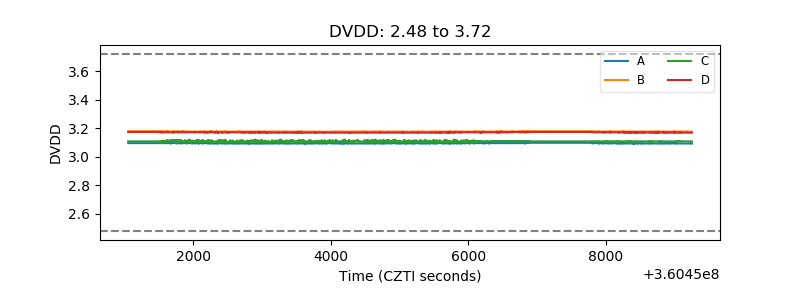 |
| Temperature 1 | 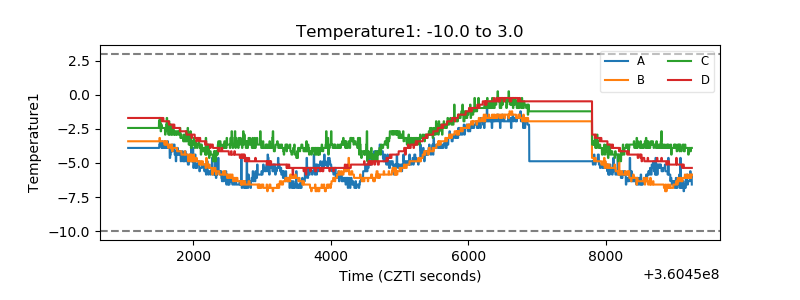 |
| Veto HV Monitor | 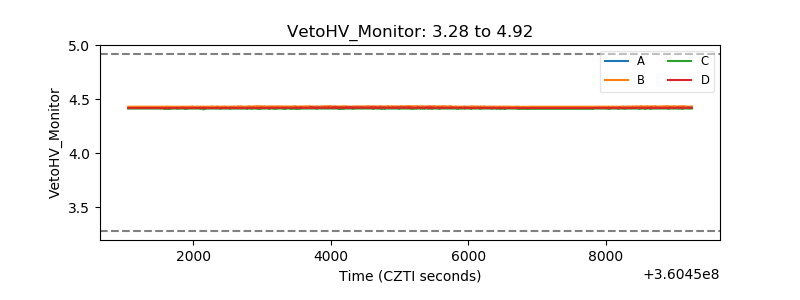 |
| Veto LLD | 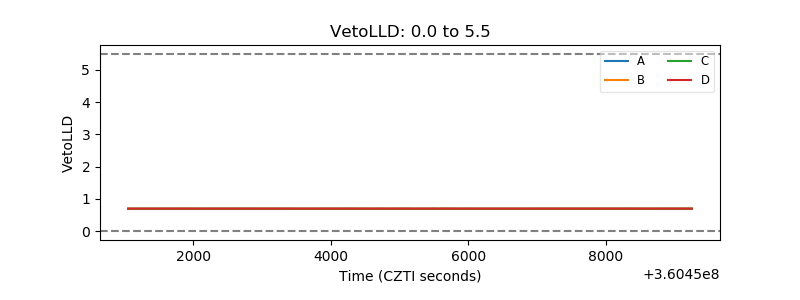 |
| Alpha Counter | 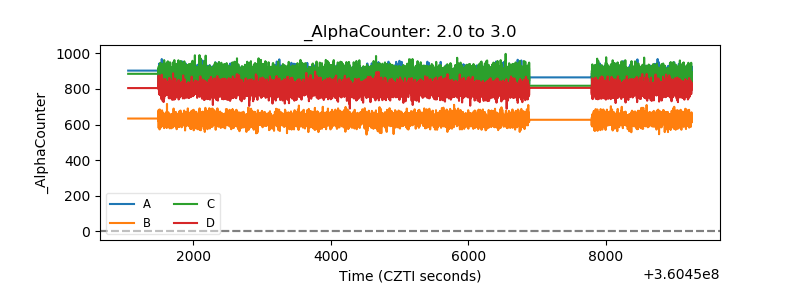 |
| _CPM_Rate | 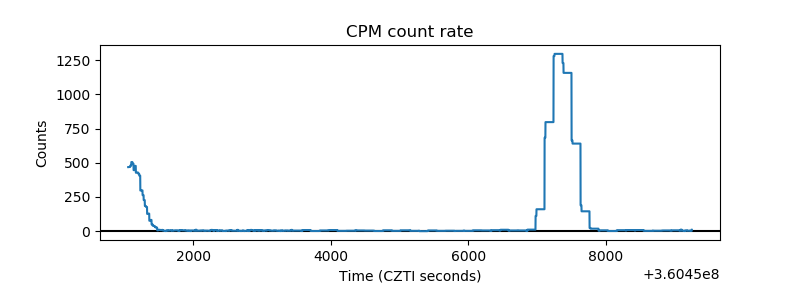 |
| CZT Counter | 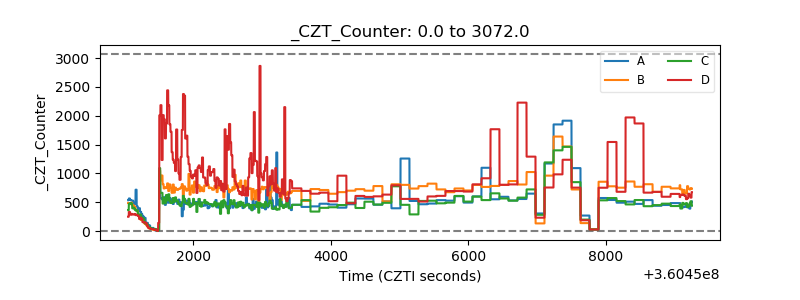 |
| +2.5 Volts monitor |  |
| +5 Volts monitor |  |
| _ROLL_ROT | 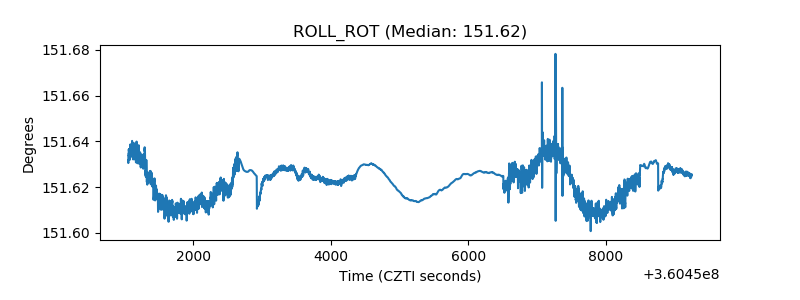 |
| _Roll_DEC | 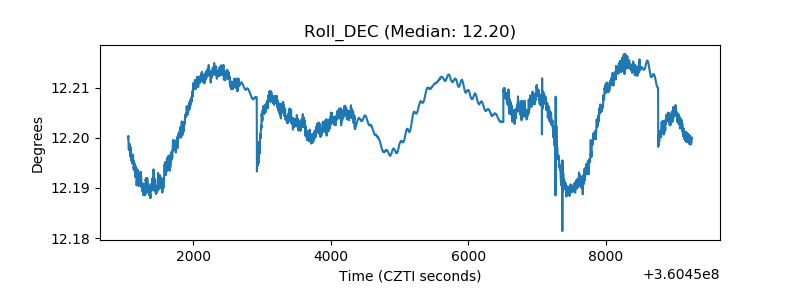 |
| _Roll_RA | 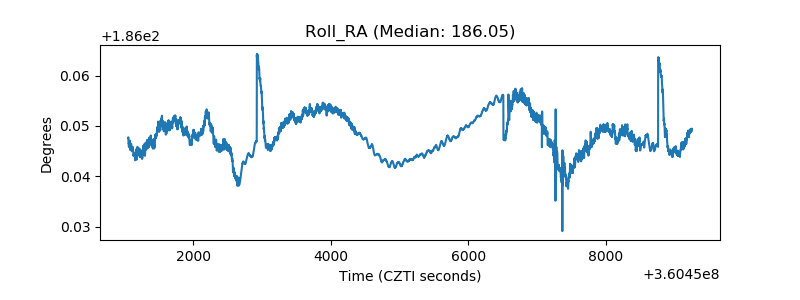 |
| Veto Counter | 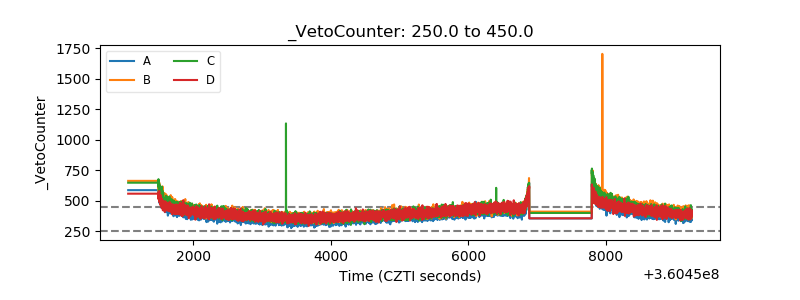 |