| Param | Original file | Final file |
|---|---|---|
| Filename | modeM0/AS1A10_071T11_9000004436_30726cztM0_level2.evt | modeM0/AS1A10_071T11_9000004436_30726cztM0_level2_quad_clean.evt |
| Size (bytes) | 627,004,800 | 85,101,120 |
| Size | 598.0 MB | 81.2 MB |
| Events in quadrant A | 3,645,626 | 545,192 |
| Events in quadrant B | 5,353,775 | 549,526 |
| Events in quadrant C | 3,500,624 | 518,626 |
| Events in quadrant D | 6,032,149 | 492,298 |
| Mode SS | |||
|---|---|---|---|
| Quadrant | BADHDUFLAG | Total packets | Discarded packets |
| A | 0 | 140 | 0 |
| B | 0 | 140 | 0 |
| C | 0 | 140 | 0 |
| D | 0 | 140 | 0 |
| Mode M9 | |||
|---|---|---|---|
| Quadrant | BADHDUFLAG | Total packets | Discarded packets |
| A | 0 | 20 | 0 |
| B | 0 | 20 | 0 |
| C | 0 | 20 | 0 |
| D | 0 | 20 | 0 |
| Mode M0 | |||
|---|---|---|---|
| Quadrant | BADHDUFLAG | Total packets | Discarded packets |
| A | 0 | 14823 | 2 |
| B | 0 | 20600 | 4 |
| C | 0 | 14413 | 2 |
| D | 0 | 22989 | 2 |
| Quadrant | Total seconds | Saturated seconds | Saturation percentage |
|---|---|---|---|
| A | 6761 | 65 | 0.961396% |
| B | 6760 | 69 | 1.020710% |
| C | 6761 | 69 | 1.020559% |
| D | 6761 | 156 | 2.307351% |
Noise dominated data is calculated using 1-second bins in cleaned event files. If a bin has >2000 counts, and if more than 50% of those come from <1% of pixels, then it is considered to be noise-dominated and hence unusable.
| Quadrant | # 1 sec bins | Bins with >0 counts | Bins with >2000 counts | High rate bins dominated by noise | Noise dominated (total time) | Noise dominated (detector-on time) | Marked lightcurve |
|---|---|---|---|---|---|---|---|
| A | 8756 | 6762 | 25 | 25 | 0.29% | 0.37% | 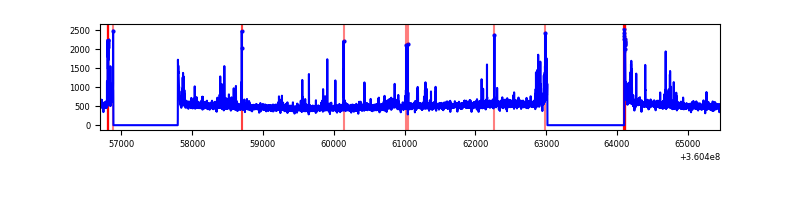 |
| B | 8755 | 6760 | 2 | 2 | 0.02% | 0.03% | 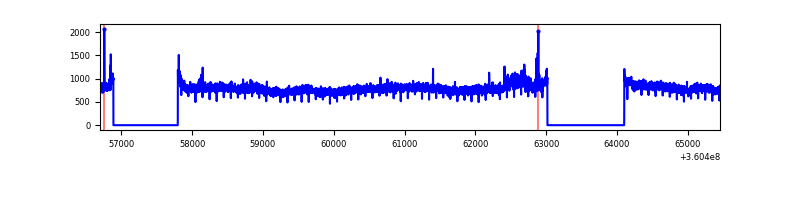 |
| C | 8756 | 6763 | 4 | 4 | 0.05% | 0.06% | 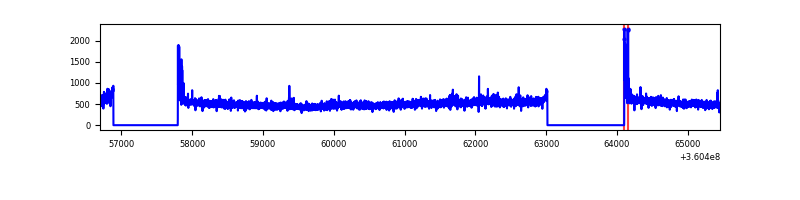 |
| D | 8756 | 6762 | 135 | 135 | 1.54% | 2.00% | 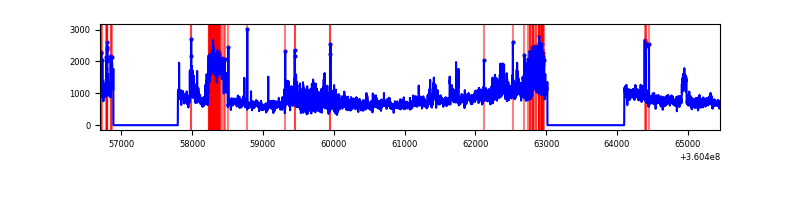 |
Top three noisy pixels from each quadrant. If the there are fewer than three noisy pixels in the level2.evt file, extra rows are filled as -1
| Pixel properties | Quadrant properties | ||||||
|---|---|---|---|---|---|---|---|
| Quadrant | DetID | PixID | Counts | Sigma | Mean | Median | Sigma |
| A | 0 | 13 | 245492 | 1431.4 | 853 | 834 | 170.9 |
| A | 8 | 192 | 109830 | 637.7 | 853 | 834 | 170.9 |
| A | 13 | 254 | 11751 | 63.87 | 853 | 834 | 170.9 |
| B | 6 | 159 | 1946669 | 11998.16 | 846 | 827 | 162.2 |
| B | 3 | 209 | 43451 | 262.82 | 846 | 827 | 162.2 |
| B | 12 | 111 | 20119 | 118.96 | 846 | 827 | 162.2 |
| C | 14 | 238 | 132876 | 689.37 | 813 | 818 | 191.6 |
| C | 3 | 233 | 131781 | 683.65 | 813 | 818 | 191.6 |
| C | 0 | 10 | 45590 | 233.72 | 813 | 818 | 191.6 |
| D | 8 | 195 | 2693069 | 13997.79 | 808 | 788 | 192.3 |
| D | 13 | 249 | 78462 | 403.85 | 808 | 788 | 192.3 |
| D | 10 | 253 | 68024 | 349.58 | 808 | 788 | 192.3 |
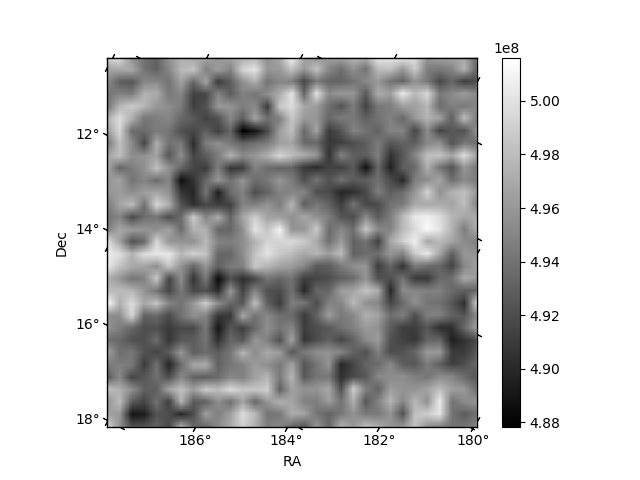
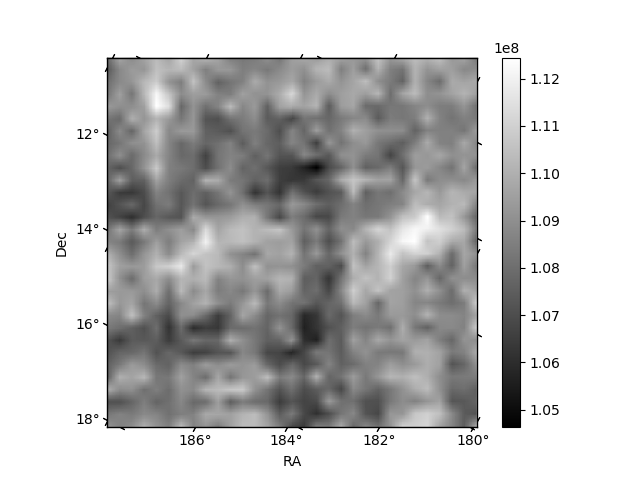
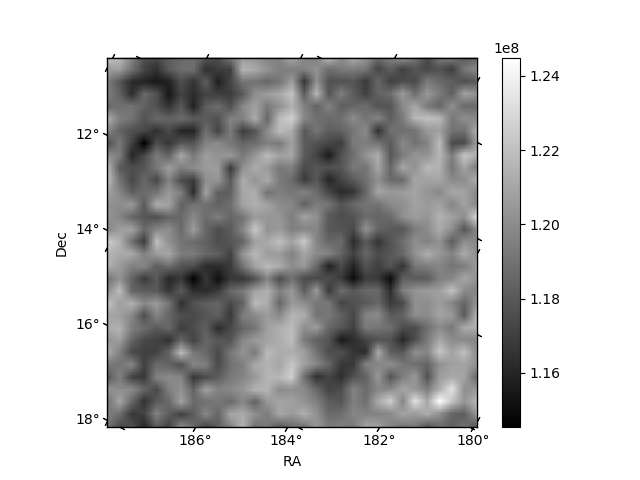
Histogram calculated using DETX and DETY for each event in the final _common_clean file
| Quadrant A | 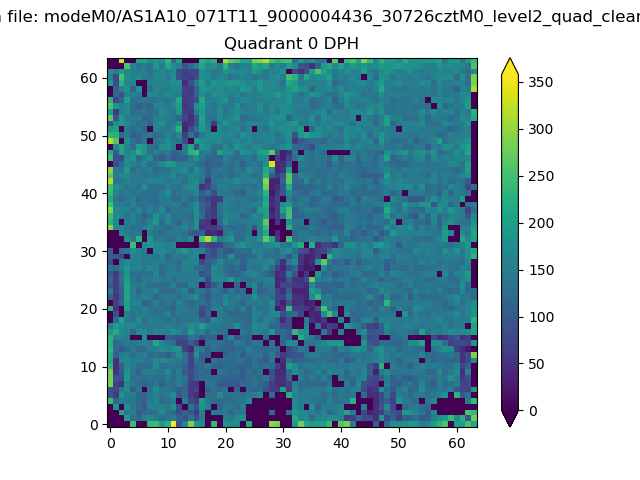 |
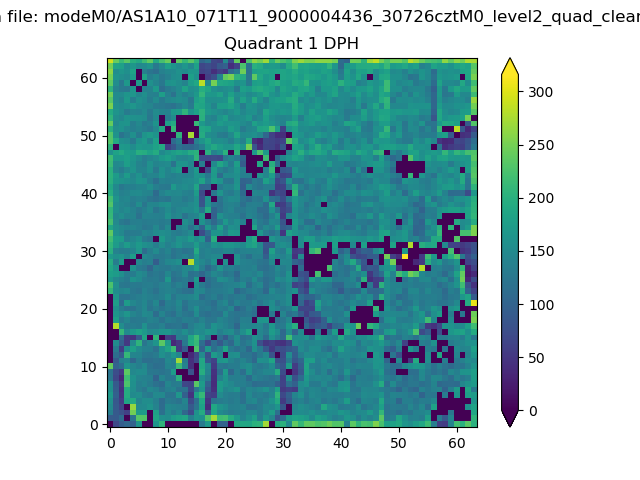 |
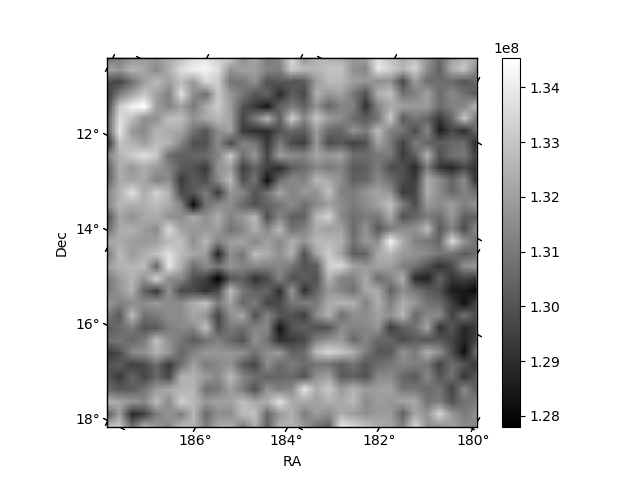
Quadrant B |
|---|---|---|---|
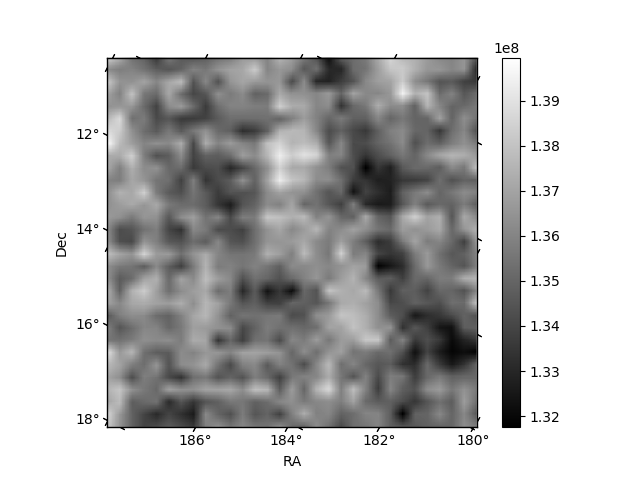
| Quadrant D | 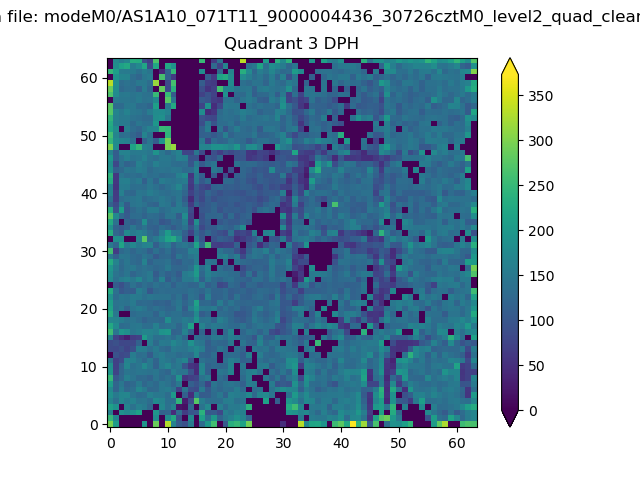 |
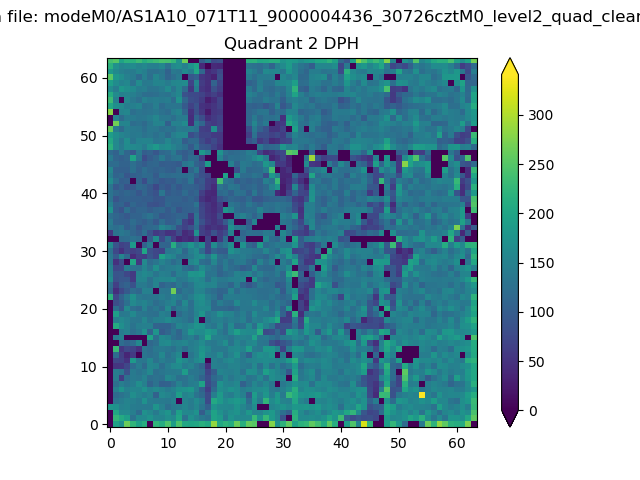 |
Quadrant C |
| Plot type | Count rate plots | Images |
|---|---|---|
| Comparison with Poisson distribution Blue bars denote a histogram of data divided into 1 sec bins. Red curve is a Poisson curve with rate = median count rate of data. |
 |
 |
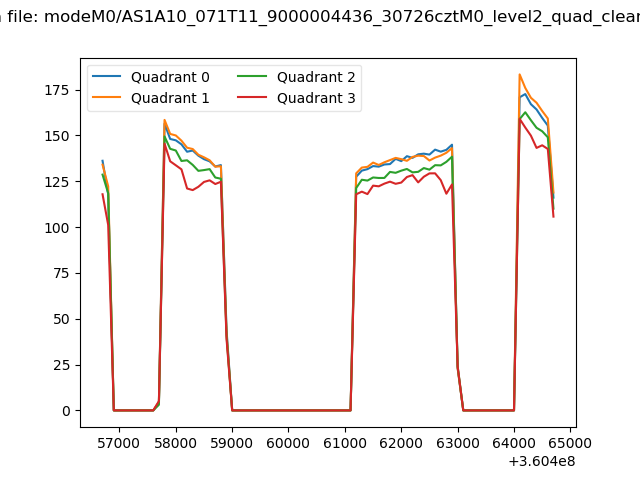
| Quadrant-wise count rates Data is divided into 100 sec bins |
 |
|
| Module-wise count rates for Quadrant A Data is divided into 100 sec bins |
 |
 |
| Module-wise count rates for Quadrant B Data is divided into 100 sec bins |
 |
 |
| Module-wise count rates for Quadrant C Data is divided into 100 sec bins |
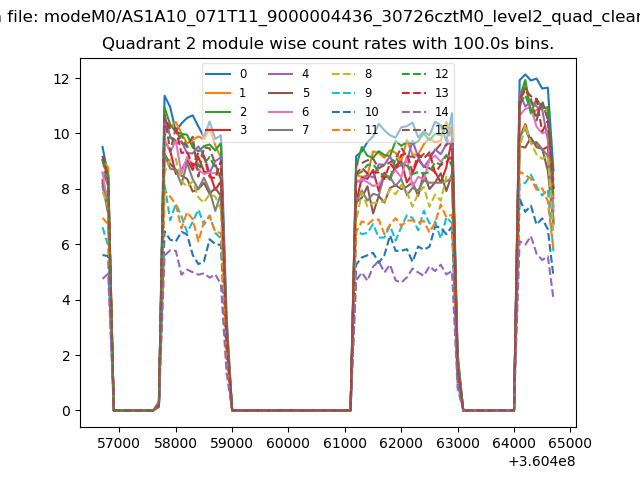 |
 |
| Module-wise count rates for Quadrant D Data is divided into 100 sec bins |
 |
 |
| Parameter | Plot |
|---|---|
| CZT HV Monitor |  |
| D_VDD | 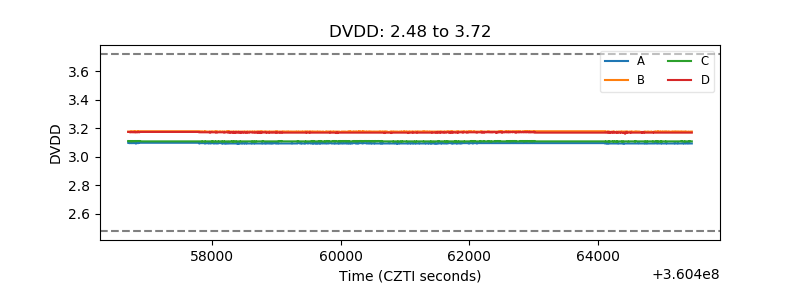 |
| Temperature 1 | 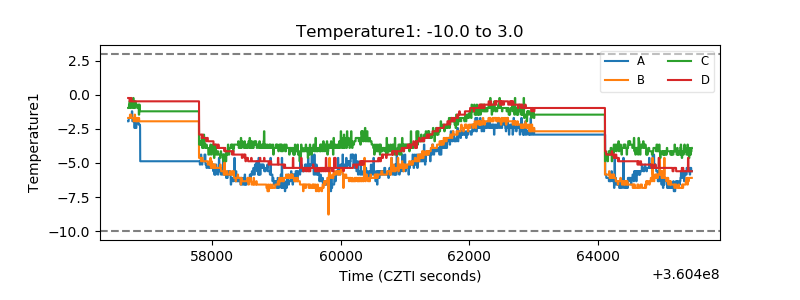 |
| Veto HV Monitor | 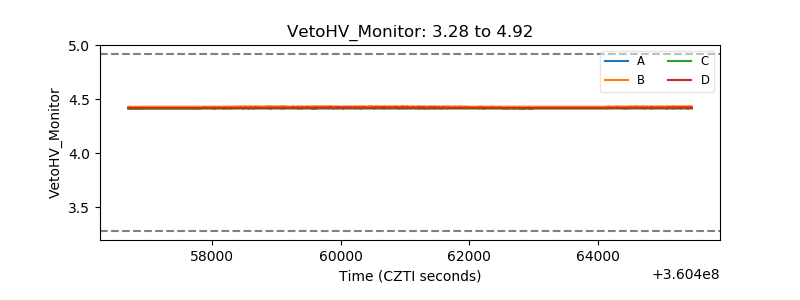 |
| Veto LLD | 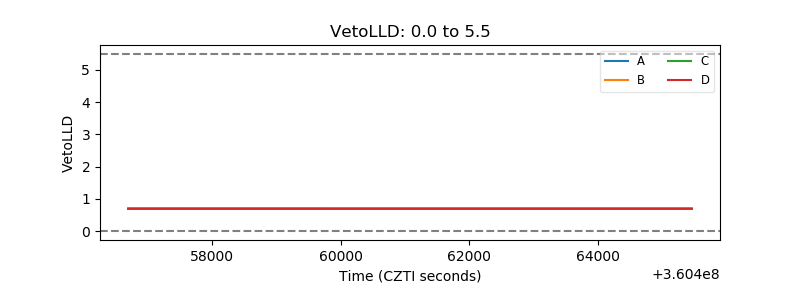 |
| Alpha Counter | 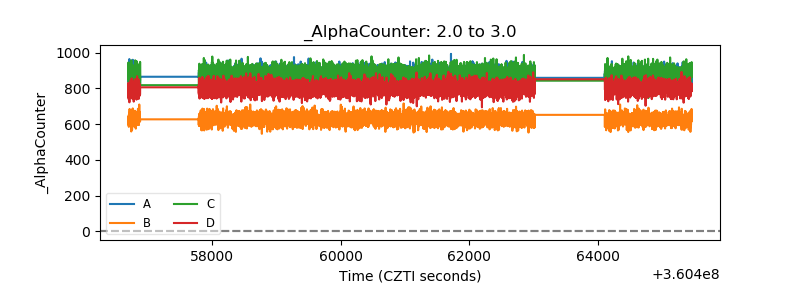 |
| _CPM_Rate | 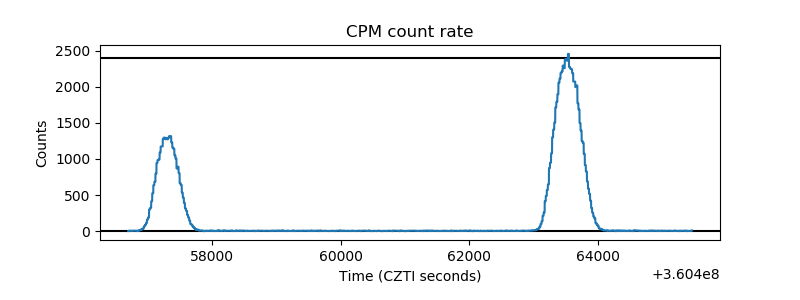 |
| CZT Counter | 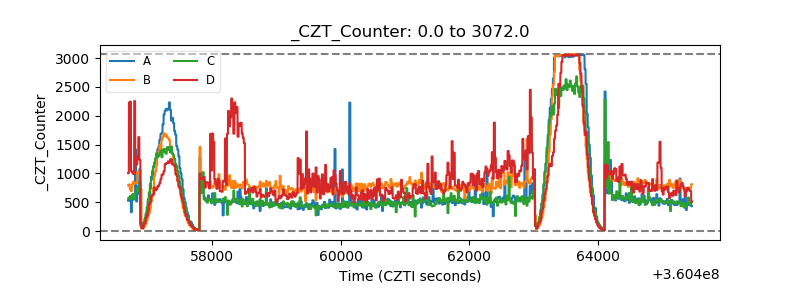 |
| +2.5 Volts monitor | 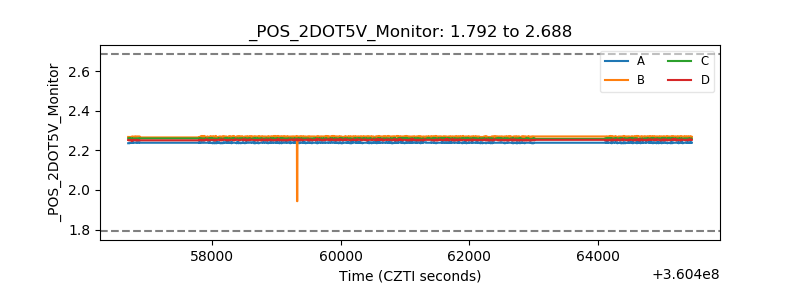 |
| +5 Volts monitor |  |
| _ROLL_ROT | 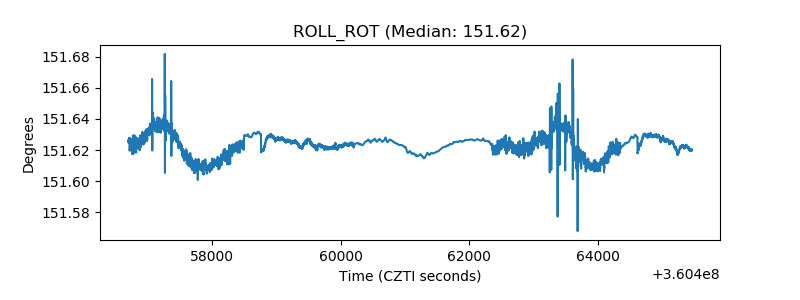 |
| _Roll_DEC |  |
| _Roll_RA | 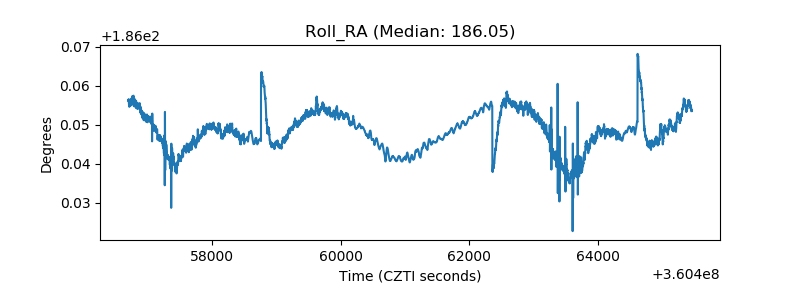 |
| Veto Counter | 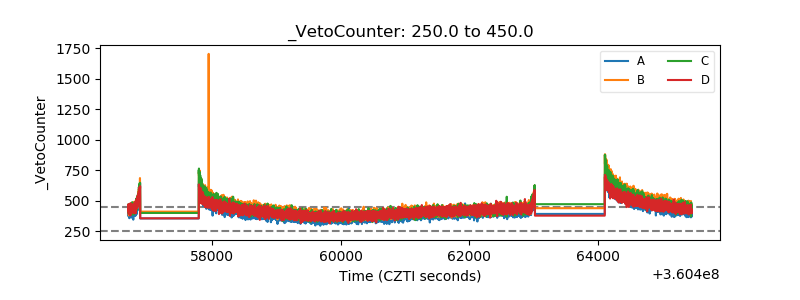 |