| Param | Original file | Final file |
|---|---|---|
| Filename | modeM0/AS1A10_071T11_9000004436_30728cztM0_level2.evt | modeM0/AS1A10_071T11_9000004436_30728cztM0_level2_quad_clean.evt |
| Size (bytes) | 661,104,000 | 72,164,160 |
| Size | 630.5 MB | 68.8 MB |
| Events in quadrant A | 4,378,760 | 443,581 |
| Events in quadrant B | 5,128,660 | 468,211 |
| Events in quadrant C | 3,500,722 | 437,920 |
| Events in quadrant D | 6,583,314 | 390,277 |
| Mode SS | |||
|---|---|---|---|
| Quadrant | BADHDUFLAG | Total packets | Discarded packets |
| A | 0 | 130 | 0 |
| B | 0 | 130 | 0 |
| C | 0 | 130 | 0 |
| D | 0 | 130 | 0 |
| Mode M9 | |||
|---|---|---|---|
| Quadrant | BADHDUFLAG | Total packets | Discarded packets |
| A | 0 | 15 | 0 |
| B | 0 | 16 | 0 |
| C | 0 | 16 | 0 |
| D | 0 | 16 | 0 |
| Mode M0 | |||
|---|---|---|---|
| Quadrant | BADHDUFLAG | Total packets | Discarded packets |
| A | 0 | 16976 | 1 |
| B | 0 | 19463 | 1 |
| C | 0 | 14188 | 1 |
| D | 0 | 24253 | 1 |
| Quadrant | Total seconds | Saturated seconds | Saturation percentage |
|---|---|---|---|
| A | 6371 | 367 | 5.760477% |
| B | 6371 | 80 | 1.255690% |
| C | 6370 | 97 | 1.522763% |
| D | 6370 | 716 | 11.240188% |
Noise dominated data is calculated using 1-second bins in cleaned event files. If a bin has >2000 counts, and if more than 50% of those come from <1% of pixels, then it is considered to be noise-dominated and hence unusable.
| Quadrant | # 1 sec bins | Bins with >0 counts | Bins with >2000 counts | High rate bins dominated by noise | Noise dominated (total time) | Noise dominated (detector-on time) | Marked lightcurve |
|---|---|---|---|---|---|---|---|
| A | 7546 | 6372 | 281 | 281 | 3.72% | 4.41% | 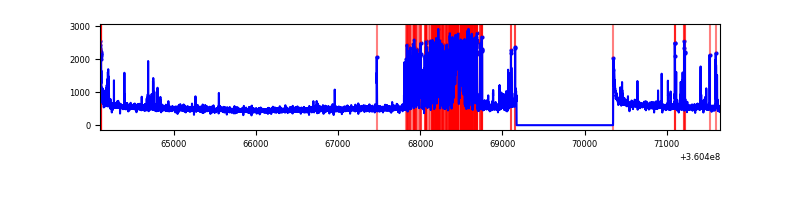 |
| B | 7546 | 6371 | 7 | 7 | 0.09% | 0.11% | 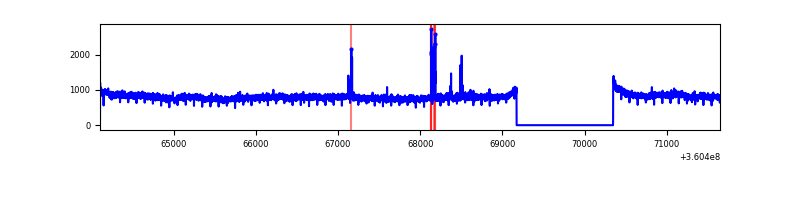 |
| C | 7545 | 6370 | 19 | 19 | 0.25% | 0.30% | 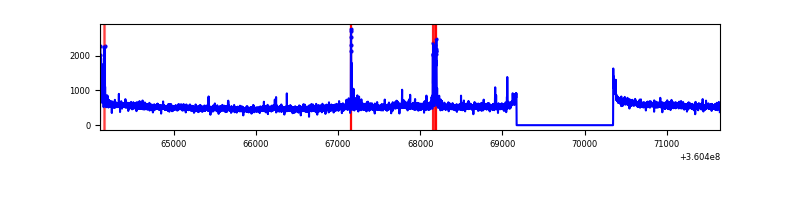 |
| D | 7545 | 6370 | 647 | 647 | 8.58% | 10.16% | 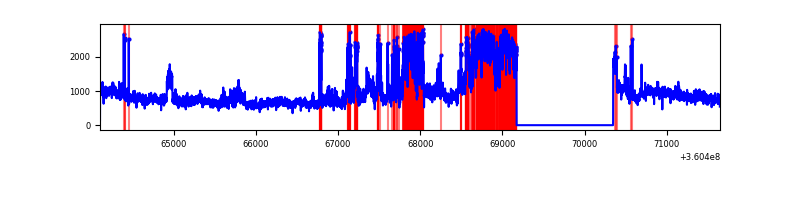 |
Top three noisy pixels from each quadrant. If the there are fewer than three noisy pixels in the level2.evt file, extra rows are filled as -1
| Pixel properties | Quadrant properties | ||||||
|---|---|---|---|---|---|---|---|
| Quadrant | DetID | PixID | Counts | Sigma | Mean | Median | Sigma |
| A | 0 | 13 | 1113273 | 6722.88 | 834 | 819 | 165.5 |
| A | 8 | 192 | 47821 | 284.05 | 834 | 819 | 165.5 |
| A | 13 | 254 | 10692 | 59.67 | 834 | 819 | 165.5 |
| B | 6 | 159 | 1772266 | 11088.4 | 842 | 824 | 159.8 |
| B | 5 | 172 | 24861 | 150.46 | 842 | 824 | 159.8 |
| B | 12 | 111 | 19358 | 116.01 | 842 | 824 | 159.8 |
| C | 3 | 233 | 169692 | 901.67 | 800 | 808 | 187.3 |
| C | 14 | 238 | 131403 | 697.24 | 800 | 808 | 187.3 |
| C | 0 | 10 | 34207 | 178.32 | 800 | 808 | 187.3 |
| D | 8 | 195 | 2094881 | 10356.31 | 769 | 755 | 202.2 |
| D | 10 | 253 | 1397963 | 6909.77 | 769 | 755 | 202.2 |
| D | 2 | 250 | 71280 | 348.77 | 769 | 755 | 202.2 |
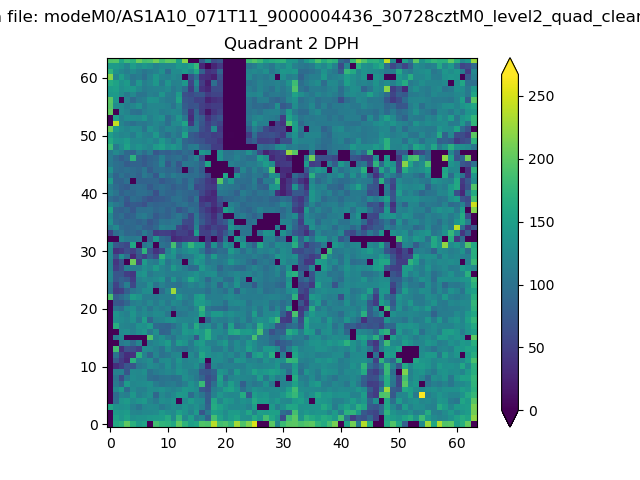
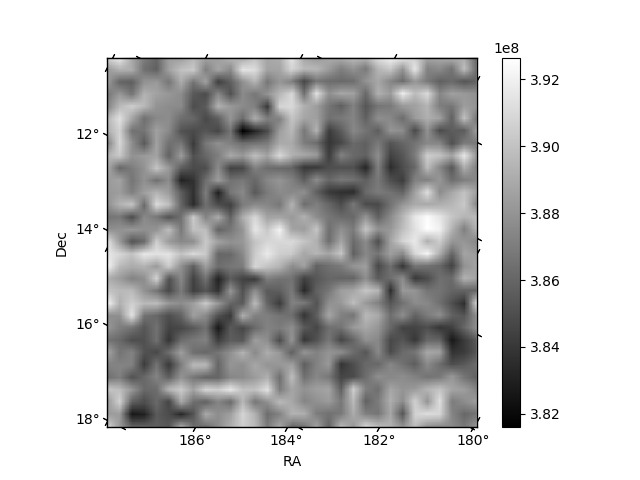
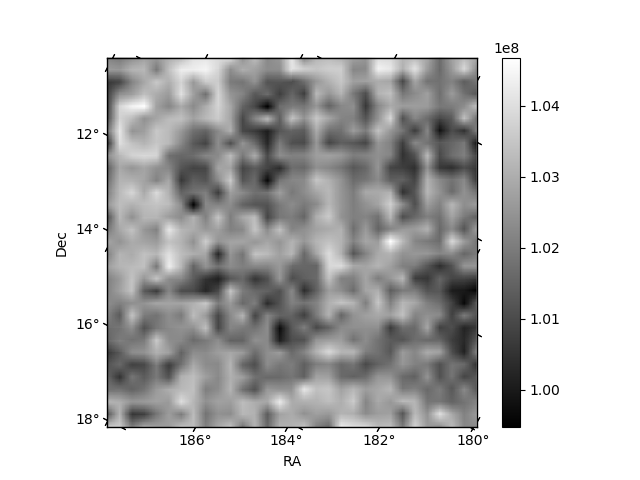
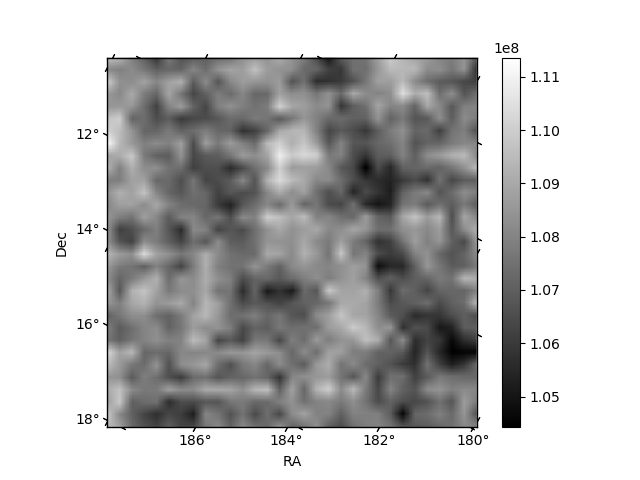
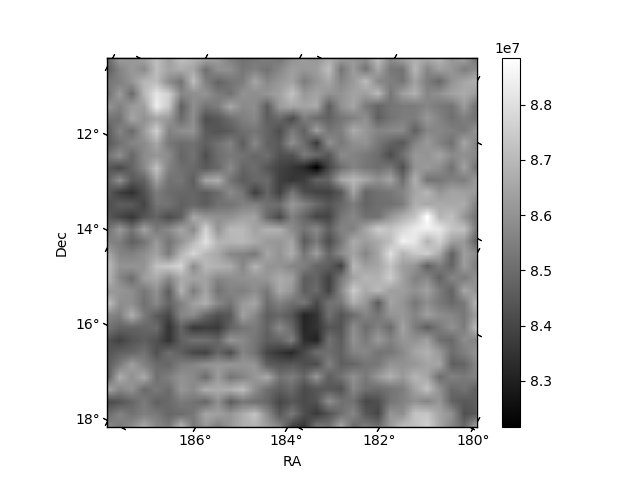
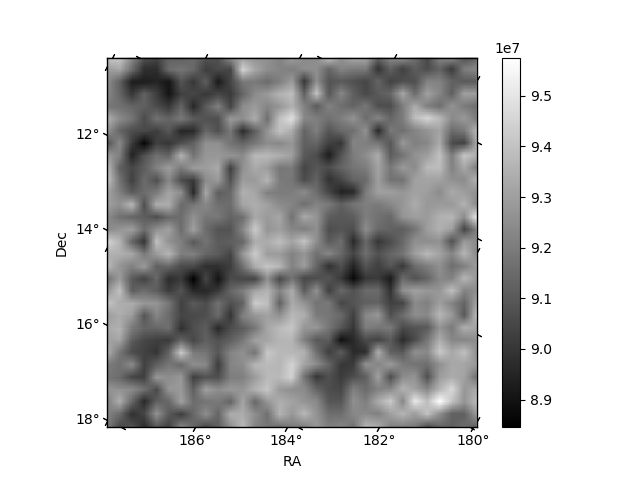
Histogram calculated using DETX and DETY for each event in the final _common_clean file
| Quadrant A | 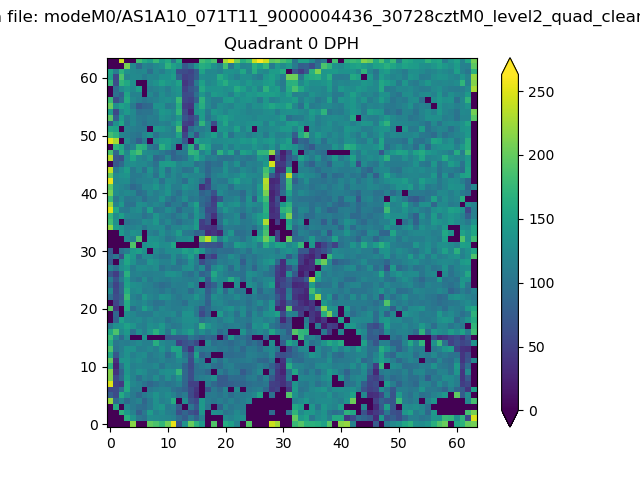 |
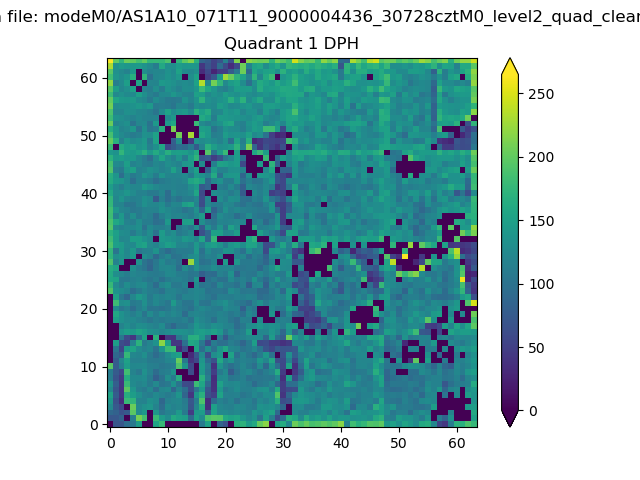 |
Quadrant B |
|---|---|---|---|
| Quadrant D | 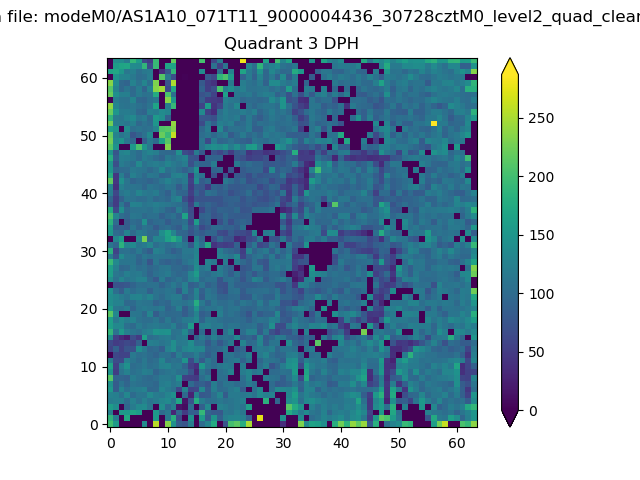 |
 |
Quadrant C |
| Plot type | Count rate plots | Images |
|---|---|---|
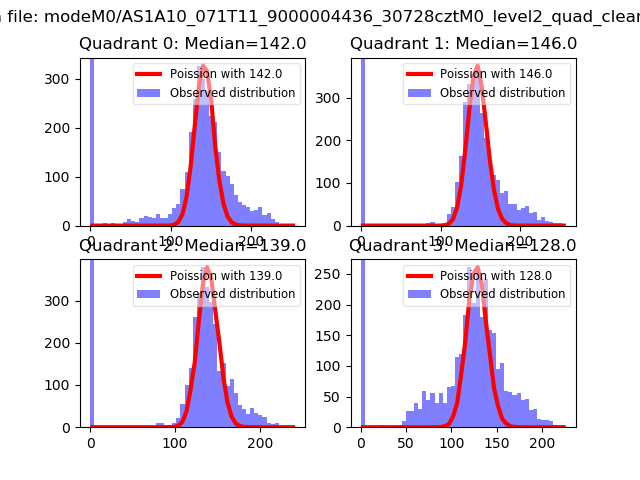
| Comparison with Poisson distribution Blue bars denote a histogram of data divided into 1 sec bins. Red curve is a Poisson curve with rate = median count rate of data. |
 |
 |
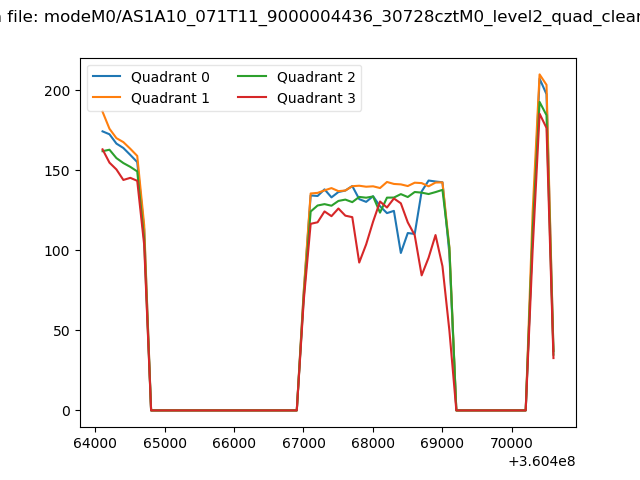
| Quadrant-wise count rates Data is divided into 100 sec bins |
 |
|
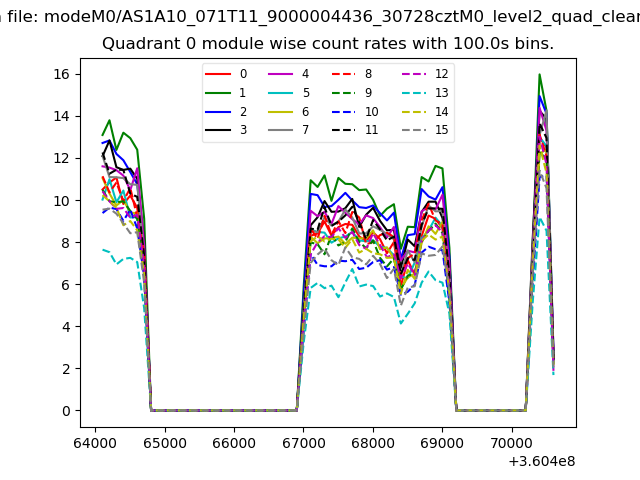
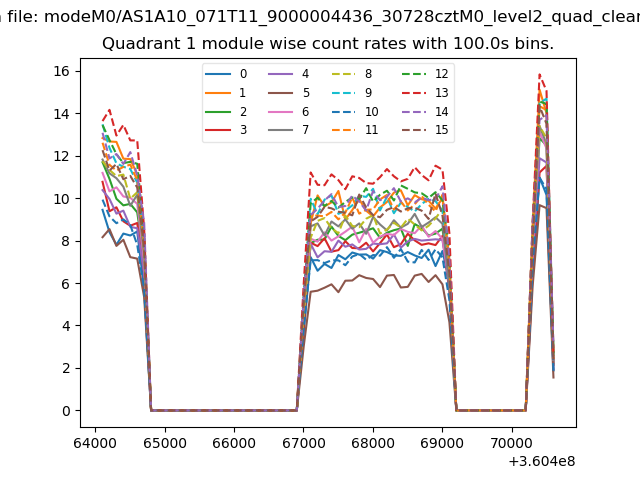
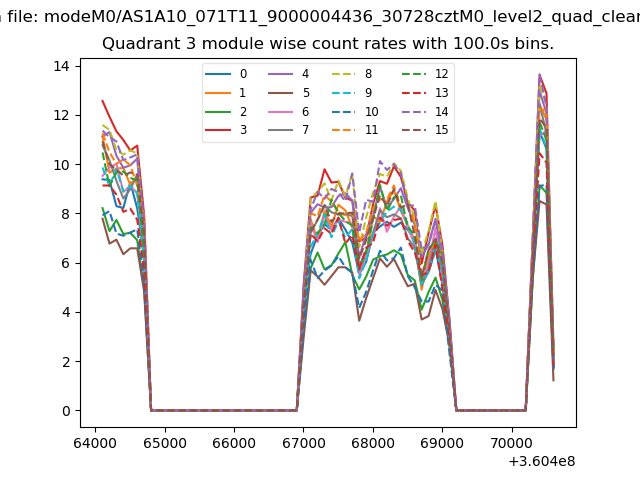
| Module-wise count rates for Quadrant A Data is divided into 100 sec bins |
 |
 |
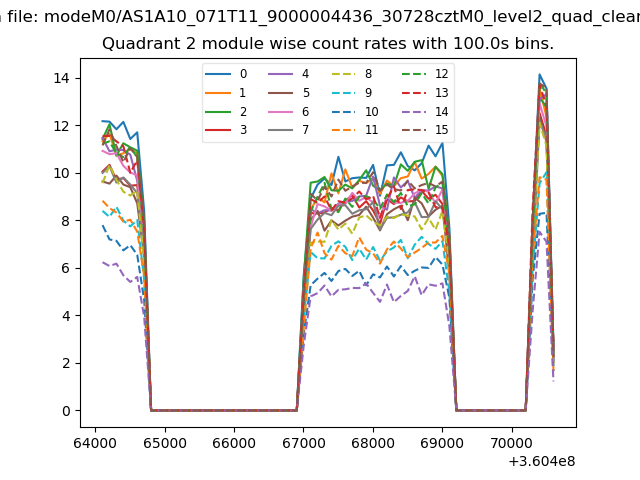
| Module-wise count rates for Quadrant B Data is divided into 100 sec bins |
 |
 |
| Module-wise count rates for Quadrant C Data is divided into 100 sec bins |
 |
 |
| Module-wise count rates for Quadrant D Data is divided into 100 sec bins |
 |
 |
| Parameter | Plot |
|---|---|
| CZT HV Monitor | 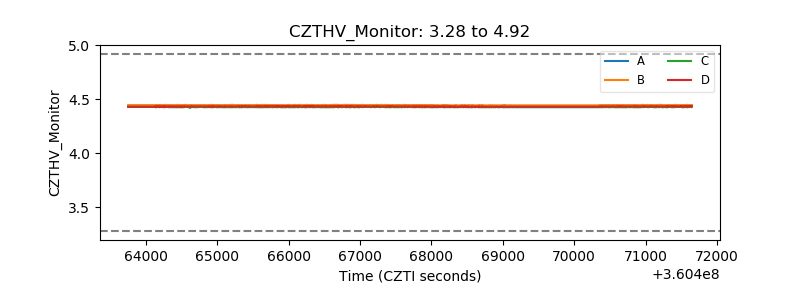 |
| D_VDD | 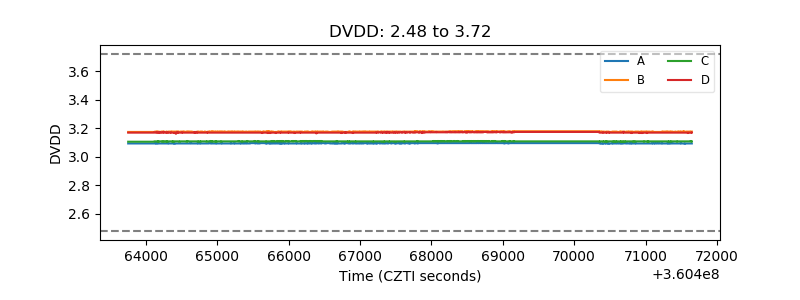 |
| Temperature 1 | 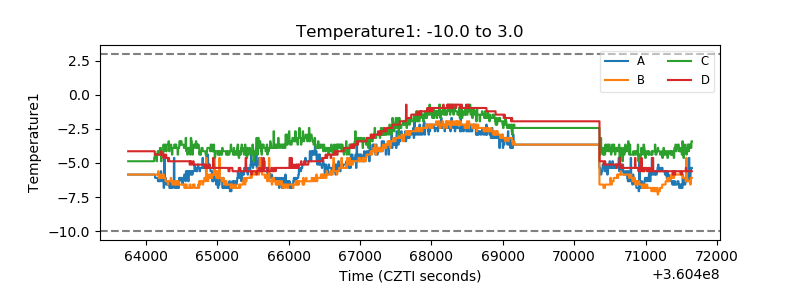 |
| Veto HV Monitor | 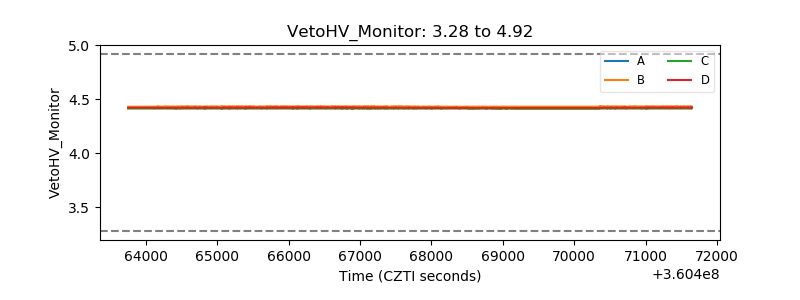 |
| Veto LLD | 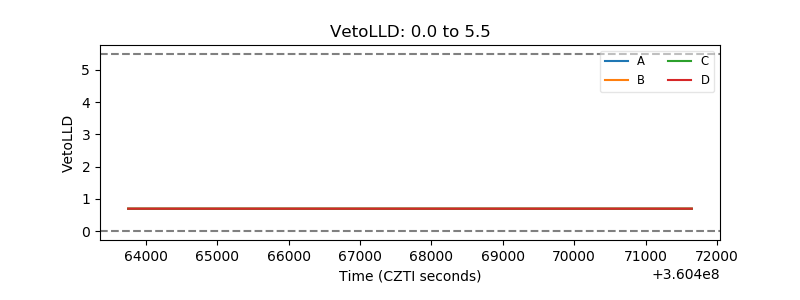 |
| Alpha Counter | 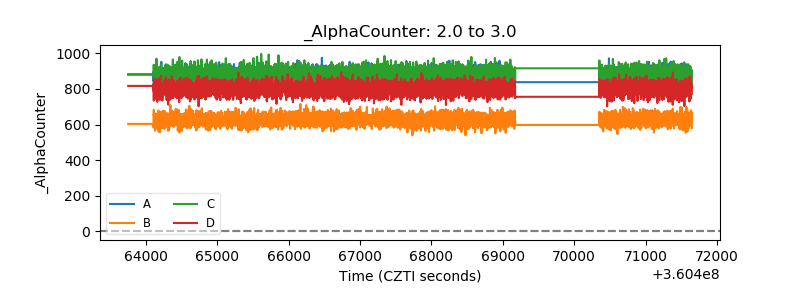 |
| _CPM_Rate | 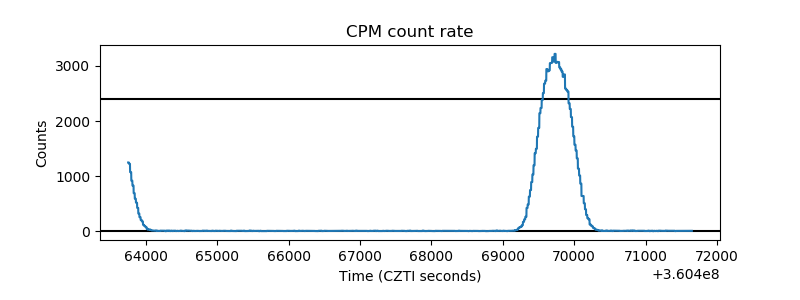 |
| CZT Counter | 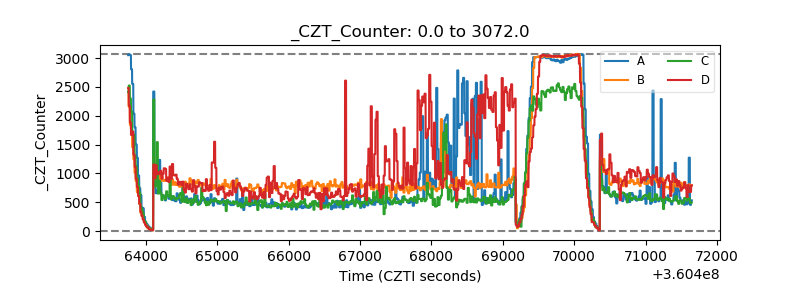 |
| +2.5 Volts monitor |  |
| +5 Volts monitor |  |
| _ROLL_ROT | 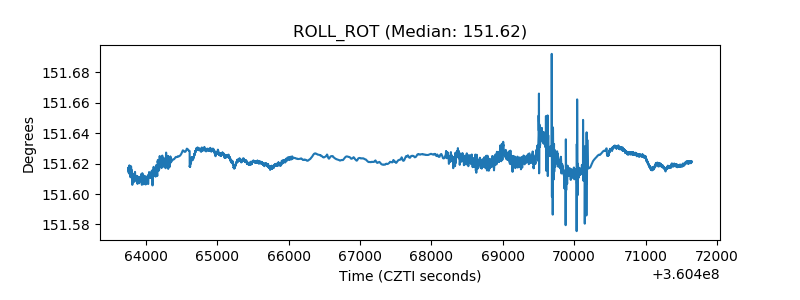 |
| _Roll_DEC | 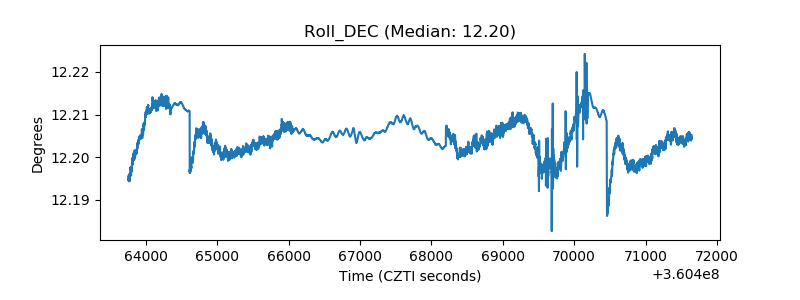 |
| _Roll_RA | 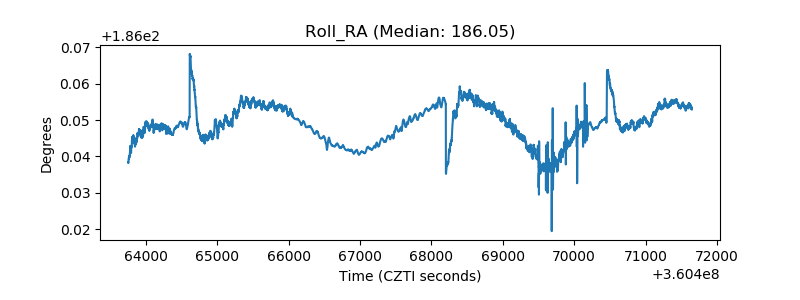 |
| Veto Counter | 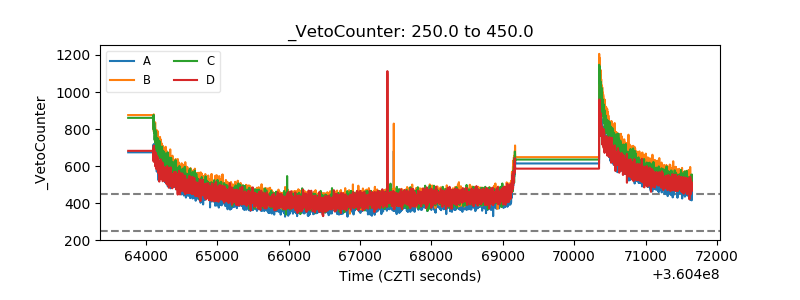 |