| Param | Original file | Final file |
|---|---|---|
| Filename | modeM0/AS1A10_071T11_9000004436_30730cztM0_level2.evt | modeM0/AS1A10_071T11_9000004436_30730cztM0_level2_quad_clean.evt |
| Size (bytes) | 711,262,080 | 68,195,520 |
| Size | 678.3 MB | 65.0 MB |
| Events in quadrant A | 3,895,930 | 426,599 |
| Events in quadrant B | 5,719,428 | 429,212 |
| Events in quadrant C | 3,768,390 | 400,986 |
| Events in quadrant D | 7,724,458 | 359,963 |
| Mode SS | |||
|---|---|---|---|
| Quadrant | BADHDUFLAG | Total packets | Discarded packets |
| A | 0 | 130 | 0 |
| B | 0 | 130 | 0 |
| C | 0 | 130 | 0 |
| D | 0 | 130 | 0 |
| Mode M9 | |||
|---|---|---|---|
| Quadrant | BADHDUFLAG | Total packets | Discarded packets |
| A | 0 | 19 | 0 |
| B | 0 | 20 | 0 |
| C | 0 | 20 | 0 |
| D | 0 | 20 | 0 |
| Mode M0 | |||
|---|---|---|---|
| Quadrant | BADHDUFLAG | Total packets | Discarded packets |
| A | 0 | 15594 | 2 |
| B | 0 | 21071 | 2 |
| C | 0 | 15172 | 2 |
| D | 0 | 27362 | 2 |
| Quadrant | Total seconds | Saturated seconds | Saturation percentage |
|---|---|---|---|
| A | 6420 | 135 | 2.102804% |
| B | 6420 | 181 | 2.819315% |
| C | 6420 | 143 | 2.227414% |
| D | 6419 | 693 | 10.796074% |
Noise dominated data is calculated using 1-second bins in cleaned event files. If a bin has >2000 counts, and if more than 50% of those come from <1% of pixels, then it is considered to be noise-dominated and hence unusable.
| Quadrant | # 1 sec bins | Bins with >0 counts | Bins with >2000 counts | High rate bins dominated by noise | Noise dominated (total time) | Noise dominated (detector-on time) | Marked lightcurve |
|---|---|---|---|---|---|---|---|
| A | 7750 | 6420 | 31 | 31 | 0.40% | 0.48% | 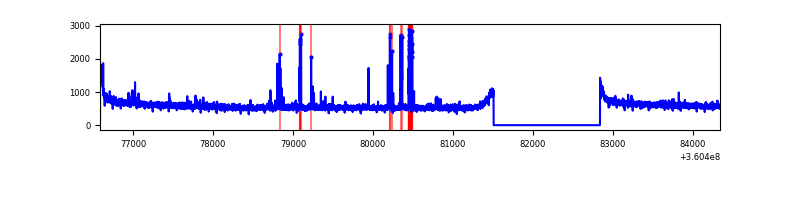 |
| B | 7750 | 6420 | 6 | 6 | 0.08% | 0.09% | 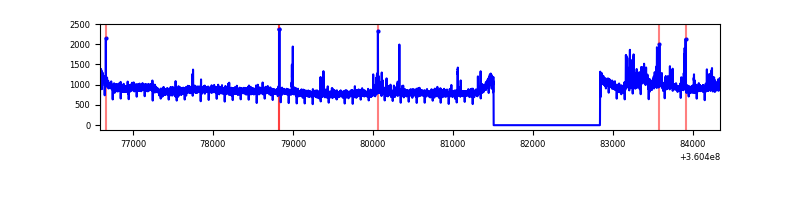 |
| C | 7750 | 6420 | 0 | 0 | 0.00% | 0.00% | 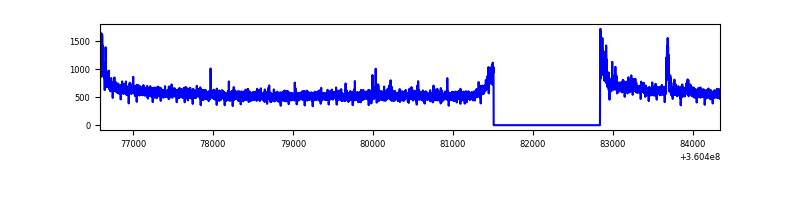 |
| D | 7749 | 6419 | 572 | 572 | 7.38% | 8.91% | 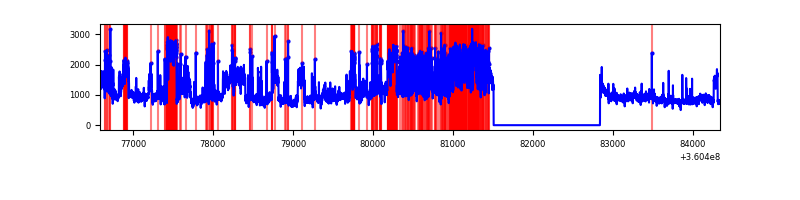 |
Top three noisy pixels from each quadrant. If the there are fewer than three noisy pixels in the level2.evt file, extra rows are filled as -1
| Pixel properties | Quadrant properties | ||||||
|---|---|---|---|---|---|---|---|
| Quadrant | DetID | PixID | Counts | Sigma | Mean | Median | Sigma |
| A | 0 | 13 | 166449 | 888.65 | 956 | 945 | 186.2 |
| A | 8 | 192 | 44102 | 231.73 | 956 | 945 | 186.2 |
| A | 13 | 254 | 11713 | 57.82 | 956 | 945 | 186.2 |
| B | 6 | 159 | 1749666 | 10052.67 | 944 | 925 | 174.0 |
| B | 6 | 36 | 218735 | 1252.09 | 944 | 925 | 174.0 |
| B | 12 | 111 | 20598 | 113.09 | 944 | 925 | 174.0 |
| C | 14 | 238 | 146560 | 713.2 | 886 | 898 | 204.2 |
| C | 3 | 233 | 106015 | 514.68 | 886 | 898 | 204.2 |
| C | 0 | 10 | 30750 | 146.16 | 886 | 898 | 204.2 |
| D | 8 | 195 | 3209967 | 14653.43 | 862 | 849 | 219.0 |
| D | 10 | 253 | 624079 | 2845.78 | 862 | 849 | 219.0 |
| D | 13 | 174 | 400792 | 1826.21 | 862 | 849 | 219.0 |
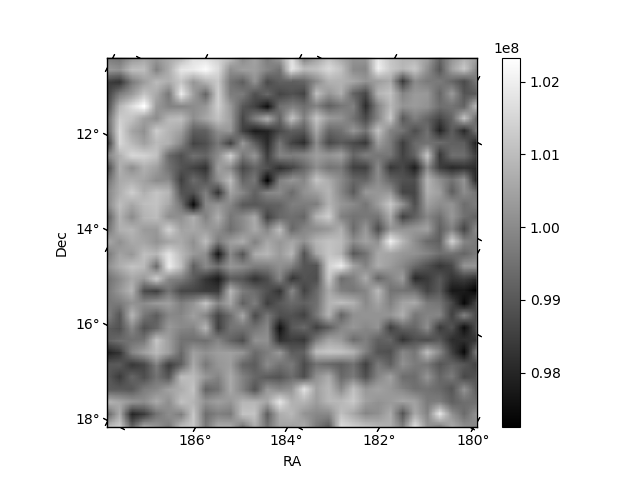
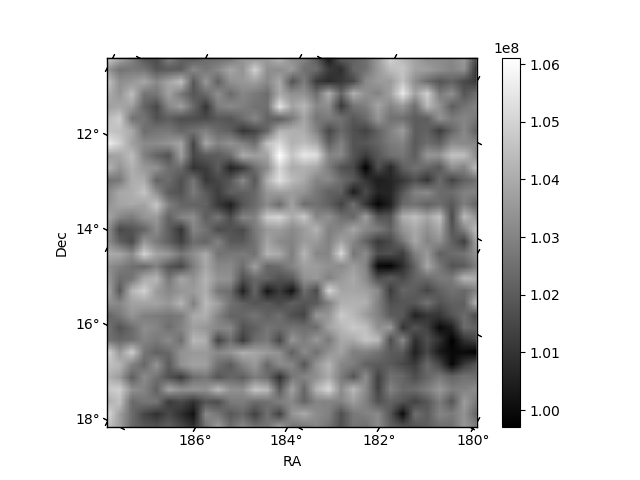
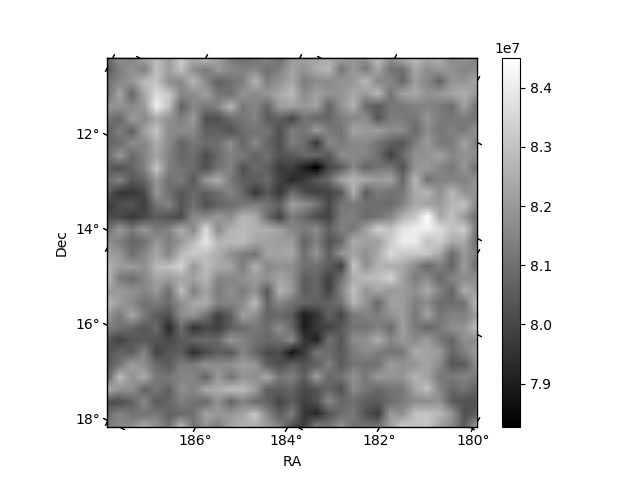
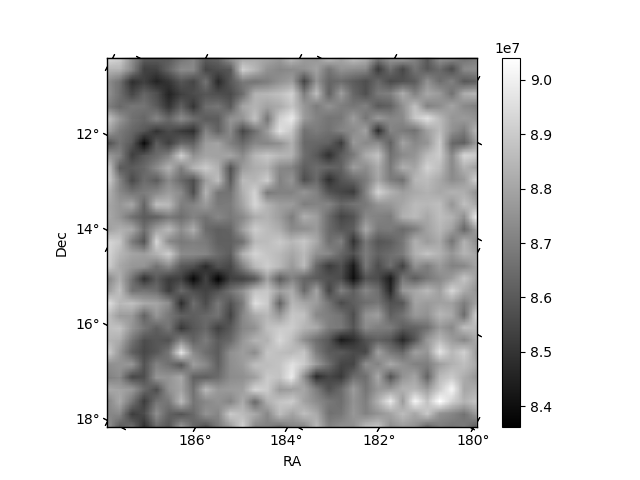
Histogram calculated using DETX and DETY for each event in the final _common_clean file
| Quadrant A | 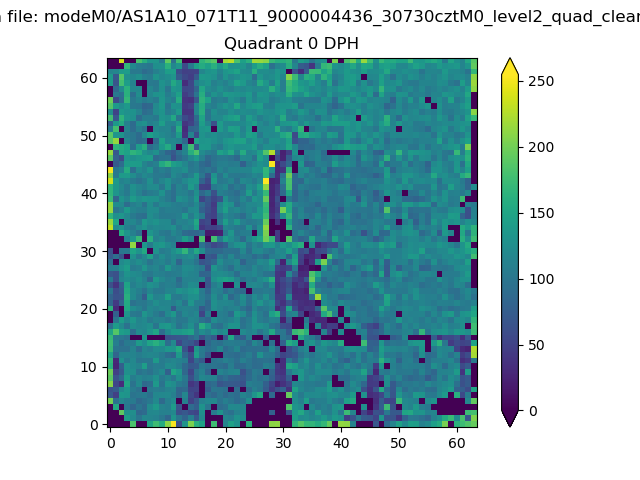 |
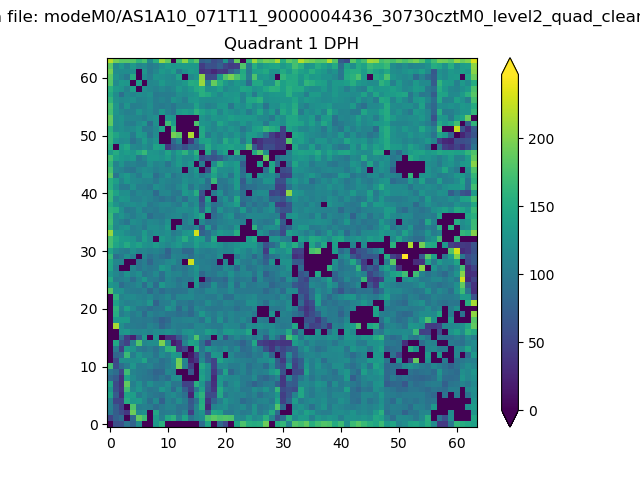 |
Quadrant B |
|---|---|---|---|
| Quadrant D | 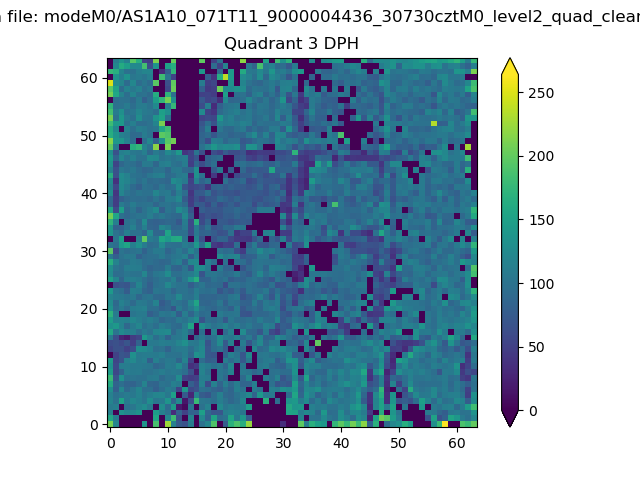 |
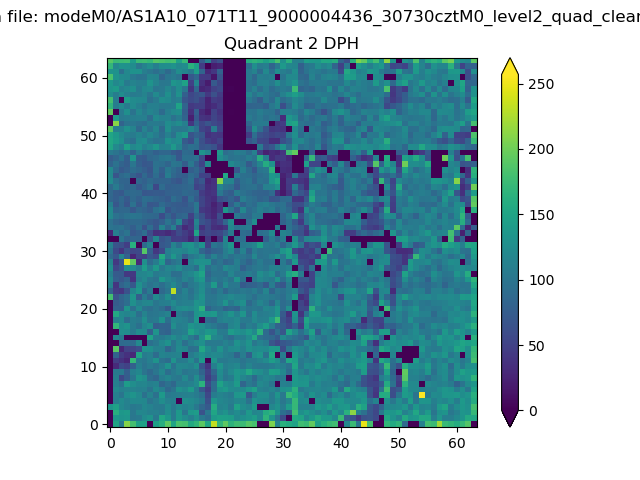 |
Quadrant C |
| Plot type | Count rate plots | Images |
|---|---|---|
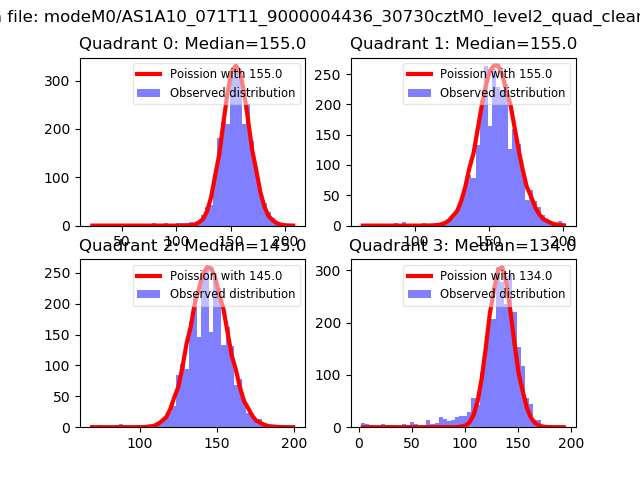
| Comparison with Poisson distribution Blue bars denote a histogram of data divided into 1 sec bins. Red curve is a Poisson curve with rate = median count rate of data. |
 |
 |
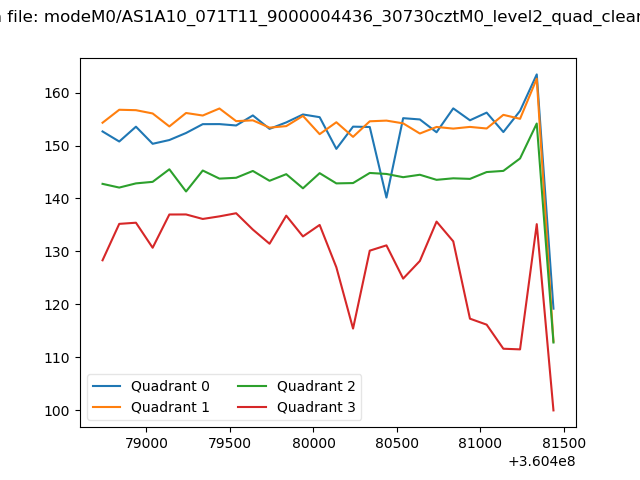
| Quadrant-wise count rates Data is divided into 100 sec bins |
 |
|
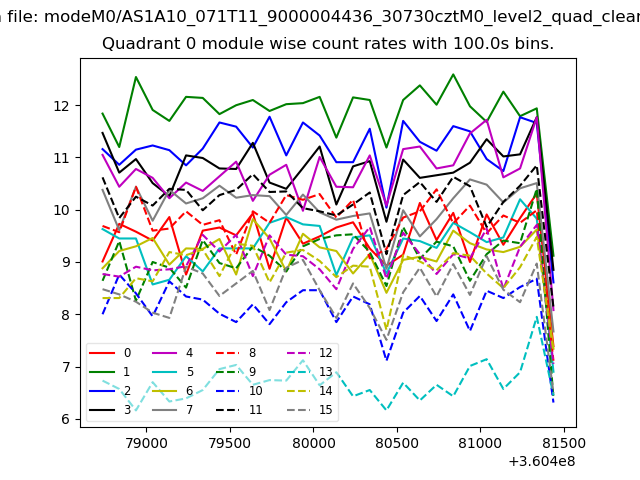
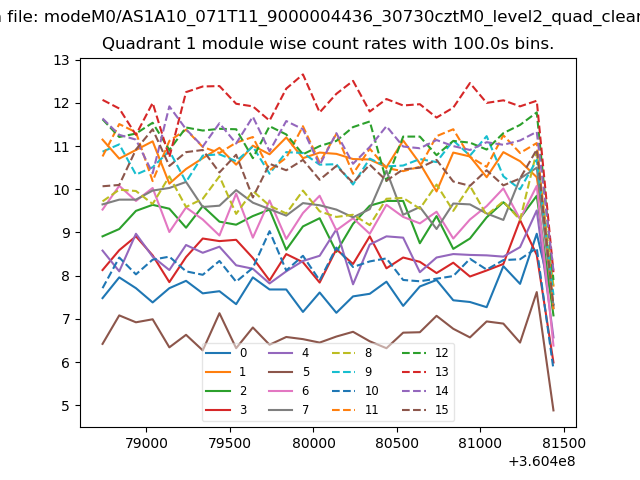
| Module-wise count rates for Quadrant A Data is divided into 100 sec bins |
 |
 |
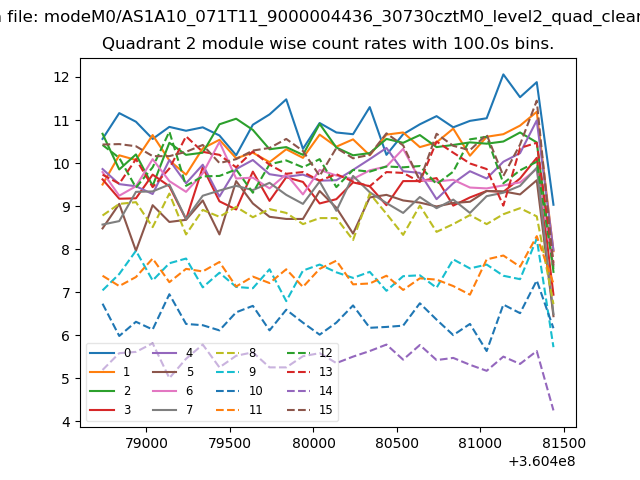
| Module-wise count rates for Quadrant B Data is divided into 100 sec bins |
 |
 |
| Module-wise count rates for Quadrant C Data is divided into 100 sec bins |
 |
 |
| Module-wise count rates for Quadrant D Data is divided into 100 sec bins |
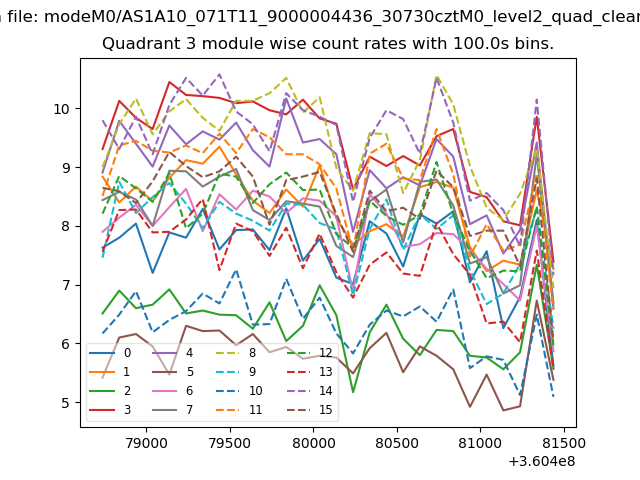 |
 |
| Parameter | Plot |
|---|---|
| CZT HV Monitor |  |
| D_VDD | 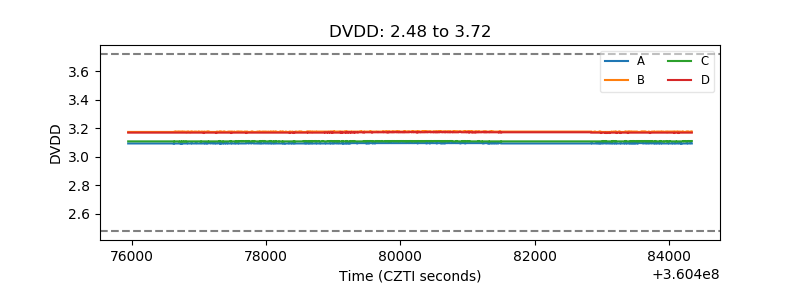 |
| Temperature 1 | 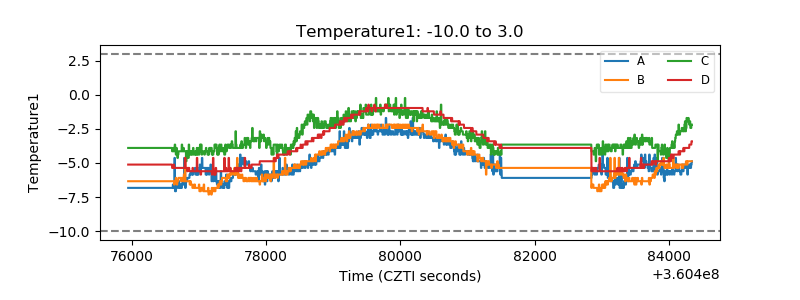 |
| Veto HV Monitor | 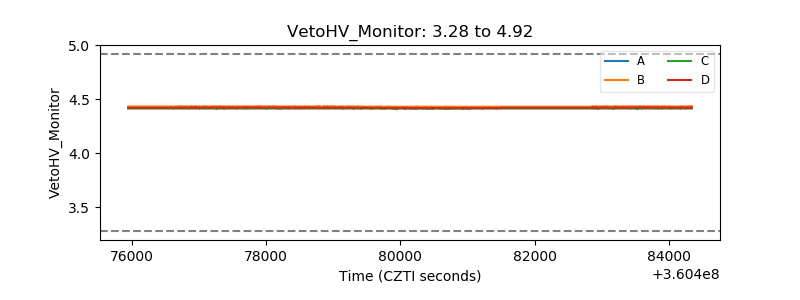 |
| Veto LLD | 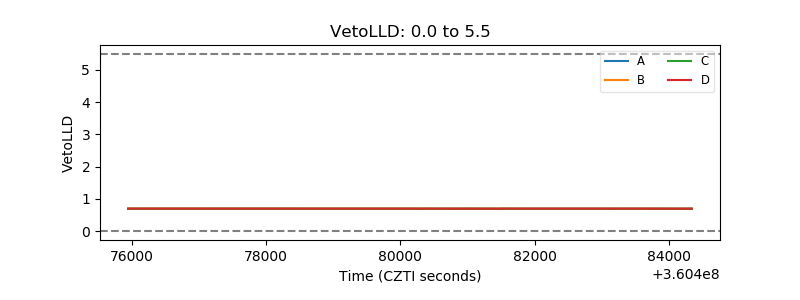 |
| Alpha Counter | 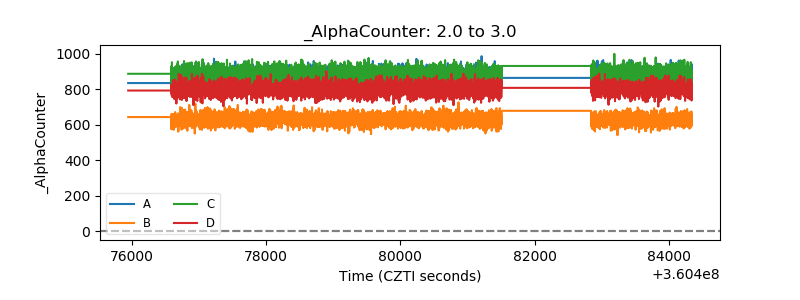 |
| _CPM_Rate | 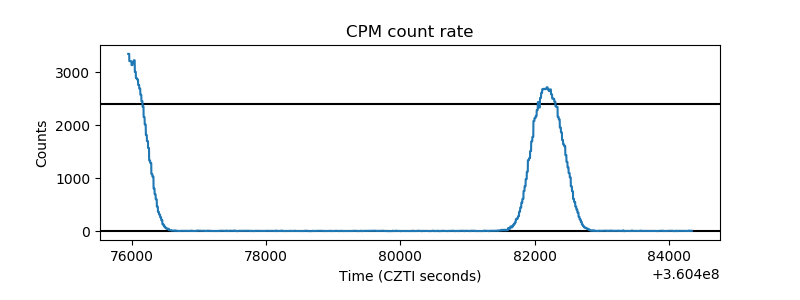 |
| CZT Counter | 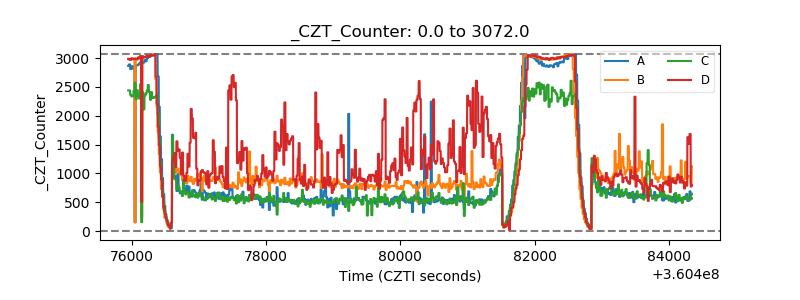 |
| +2.5 Volts monitor | 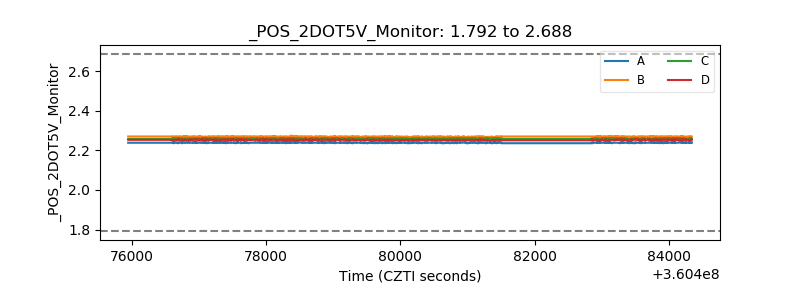 |
| +5 Volts monitor | 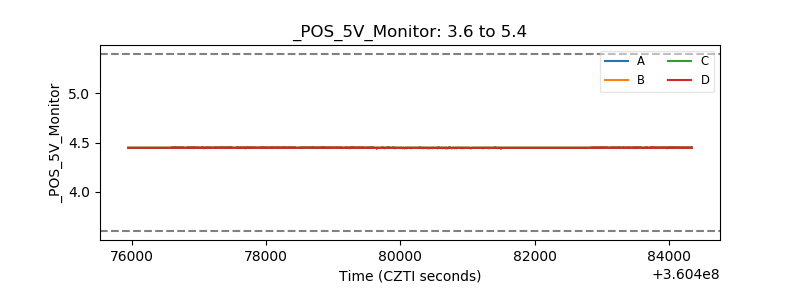 |
| _ROLL_ROT | 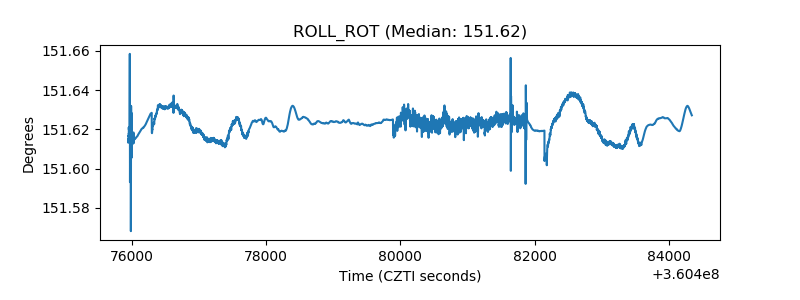 |
| _Roll_DEC | 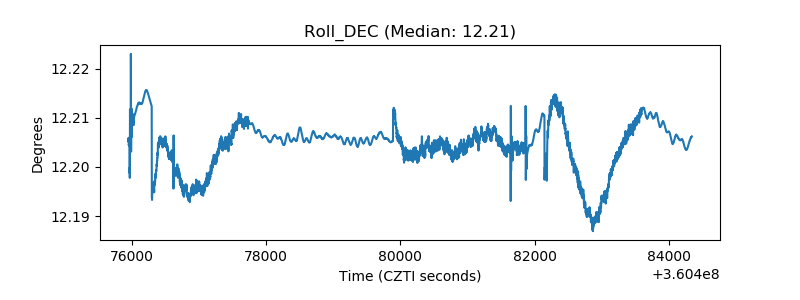 |
| _Roll_RA | 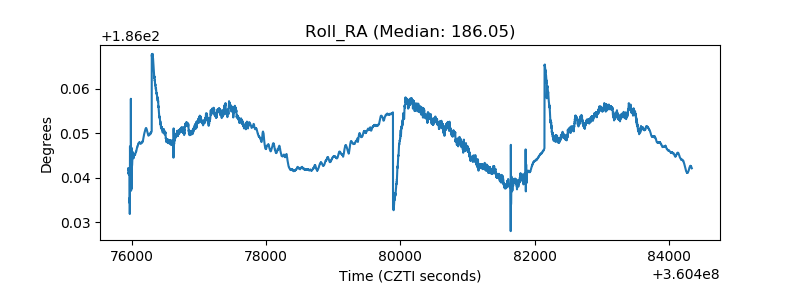 |
| Veto Counter | 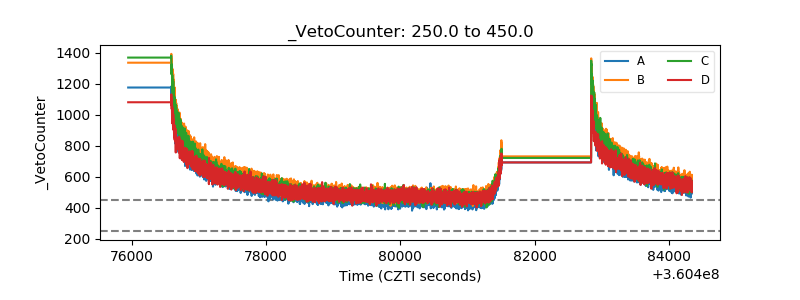 |