| Param | Original file | Final file |
|---|---|---|
| Filename | modeM0/AS1A10_071T11_9000004436_30731cztM0_level2.evt | modeM0/AS1A10_071T11_9000004436_30731cztM0_level2_quad_clean.evt |
| Size (bytes) | 686,018,880 | 76,726,080 |
| Size | 654.2 MB | 73.2 MB |
| Events in quadrant A | 3,657,198 | 501,743 |
| Events in quadrant B | 5,605,116 | 497,665 |
| Events in quadrant C | 3,943,913 | 464,769 |
| Events in quadrant D | 7,148,386 | 422,062 |
| Mode SS | |||
|---|---|---|---|
| Quadrant | BADHDUFLAG | Total packets | Discarded packets |
| A | 0 | 128 | 0 |
| B | 0 | 128 | 0 |
| C | 0 | 128 | 0 |
| D | 0 | 128 | 0 |
| Mode M9 | |||
|---|---|---|---|
| Quadrant | BADHDUFLAG | Total packets | Discarded packets |
| A | 0 | 16 | 0 |
| B | 0 | 17 | 0 |
| C | 0 | 17 | 0 |
| D | 0 | 17 | 0 |
| Mode M0 | |||
|---|---|---|---|
| Quadrant | BADHDUFLAG | Total packets | Discarded packets |
| A | 0 | 14752 | 2 |
| B | 0 | 20733 | 2 |
| C | 0 | 15970 | 2 |
| D | 0 | 25590 | 2 |
| Quadrant | Total seconds | Saturated seconds | Saturation percentage |
|---|---|---|---|
| A | 6254 | 116 | 1.854813% |
| B | 6254 | 217 | 3.469779% |
| C | 6254 | 196 | 3.133994% |
| D | 6254 | 582 | 9.306044% |
Noise dominated data is calculated using 1-second bins in cleaned event files. If a bin has >2000 counts, and if more than 50% of those come from <1% of pixels, then it is considered to be noise-dominated and hence unusable.
| Quadrant | # 1 sec bins | Bins with >0 counts | Bins with >2000 counts | High rate bins dominated by noise | Noise dominated (total time) | Noise dominated (detector-on time) | Marked lightcurve |
|---|---|---|---|---|---|---|---|
| A | 7599 | 6254 | 12 | 12 | 0.16% | 0.19% | 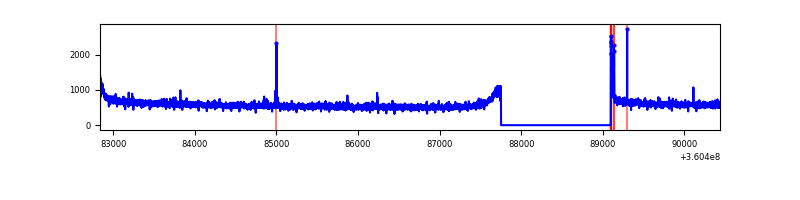 |
| B | 7599 | 6254 | 8 | 8 | 0.11% | 0.13% | 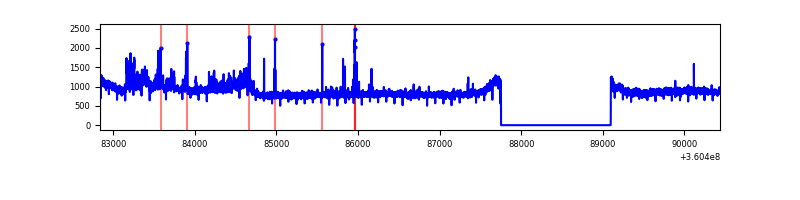 |
| C | 7599 | 6254 | 4 | 4 | 0.05% | 0.06% | 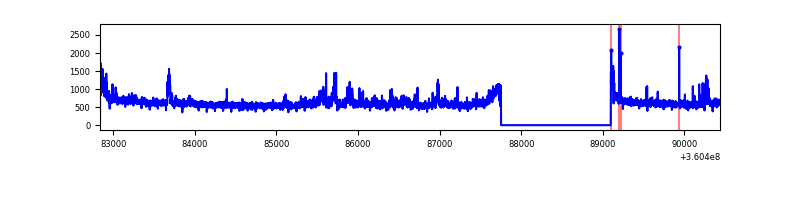 |
| D | 7599 | 6254 | 519 | 519 | 6.83% | 8.30% | 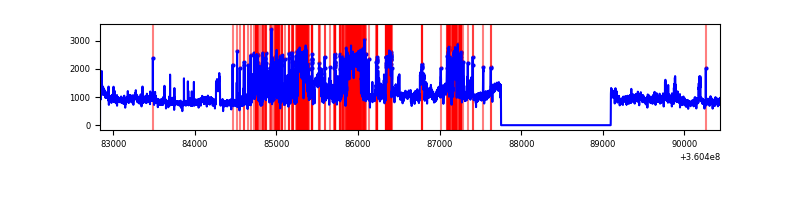 |
Top three noisy pixels from each quadrant. If the there are fewer than three noisy pixels in the level2.evt file, extra rows are filled as -1
| Pixel properties | Quadrant properties | ||||||
|---|---|---|---|---|---|---|---|
| Quadrant | DetID | PixID | Counts | Sigma | Mean | Median | Sigma |
| A | 0 | 13 | 33653 | 177.42 | 934 | 921 | 184.5 |
| A | 8 | 192 | 25273 | 131.99 | 934 | 921 | 184.5 |
| A | 13 | 254 | 11832 | 59.14 | 934 | 921 | 184.5 |
| B | 6 | 159 | 1670676 | 9760.16 | 914 | 896 | 171.1 |
| B | 6 | 36 | 304044 | 1771.95 | 914 | 896 | 171.1 |
| B | 5 | 172 | 20595 | 115.14 | 914 | 896 | 171.1 |
| C | 3 | 233 | 347660 | 1745.68 | 862 | 868 | 198.7 |
| C | 14 | 238 | 142767 | 714.29 | 862 | 868 | 198.7 |
| C | 0 | 10 | 37413 | 183.96 | 862 | 868 | 198.7 |
| D | 8 | 195 | 2859516 | 13572.87 | 857 | 836 | 210.6 |
| D | 10 | 253 | 617901 | 2929.79 | 857 | 836 | 210.6 |
| D | 13 | 174 | 197335 | 932.97 | 857 | 836 | 210.6 |
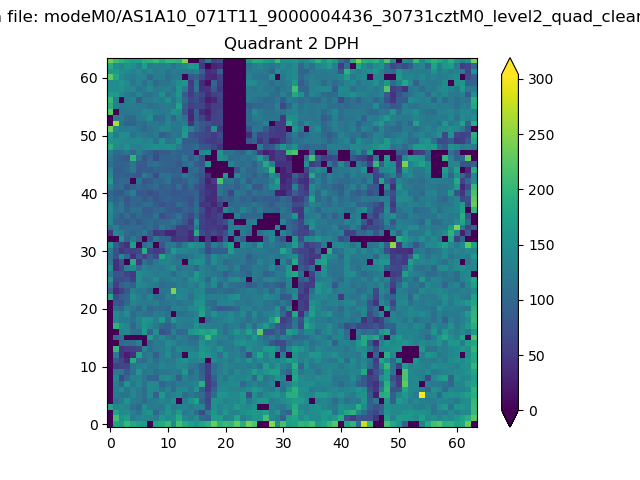
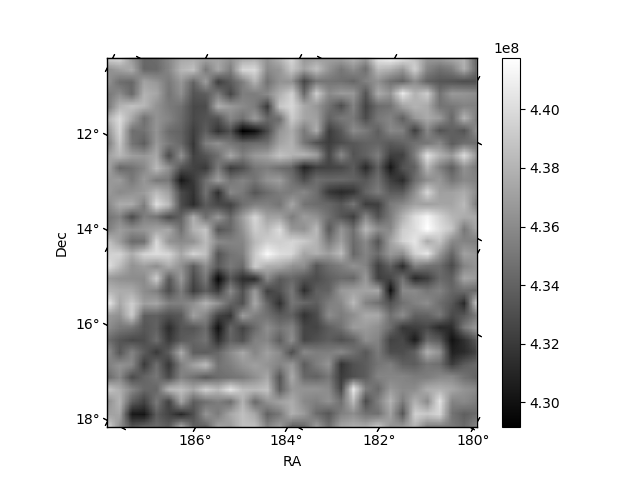
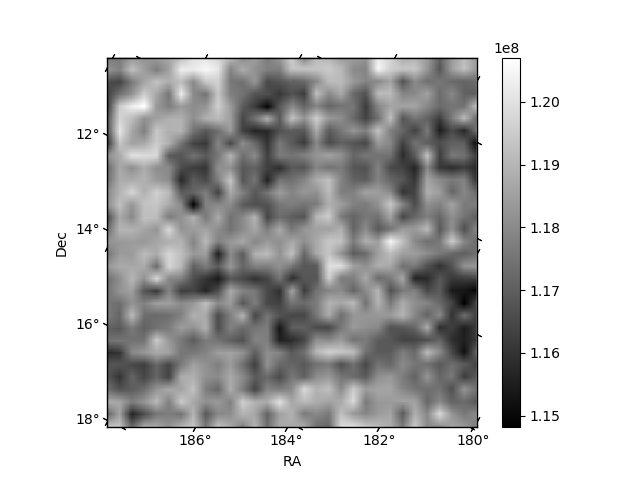
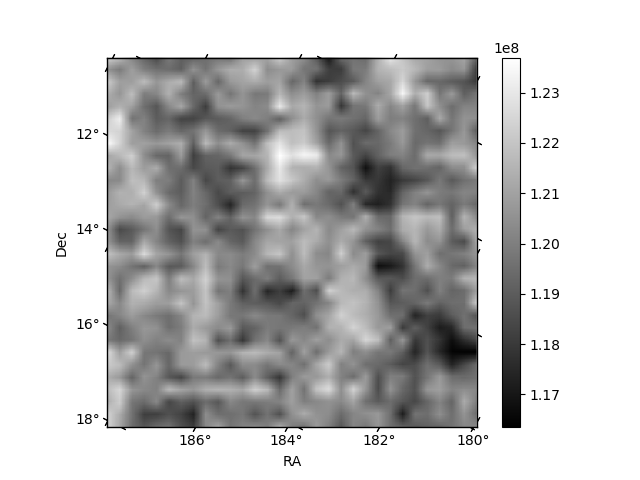
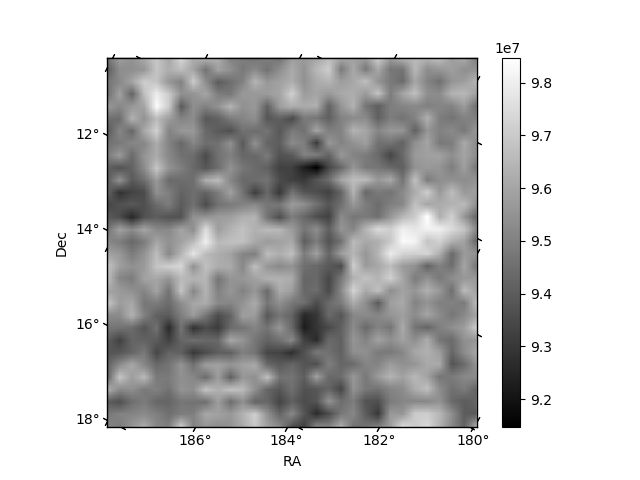
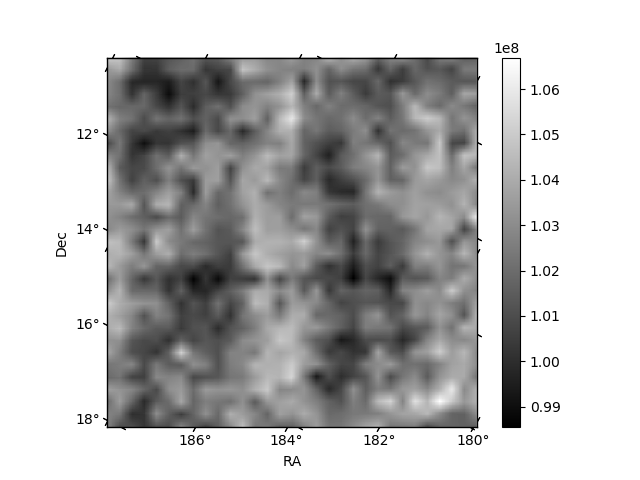
Histogram calculated using DETX and DETY for each event in the final _common_clean file
| Quadrant A | 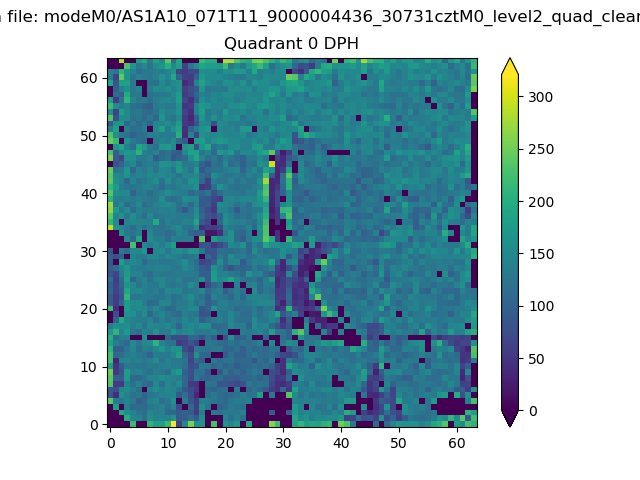 |
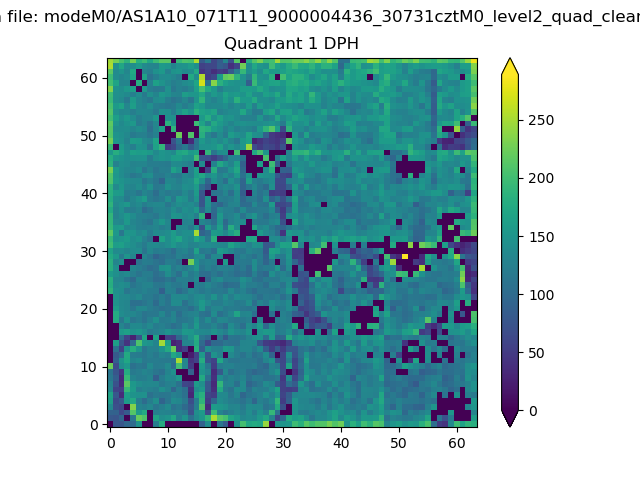 |
Quadrant B |
|---|---|---|---|
| Quadrant D | 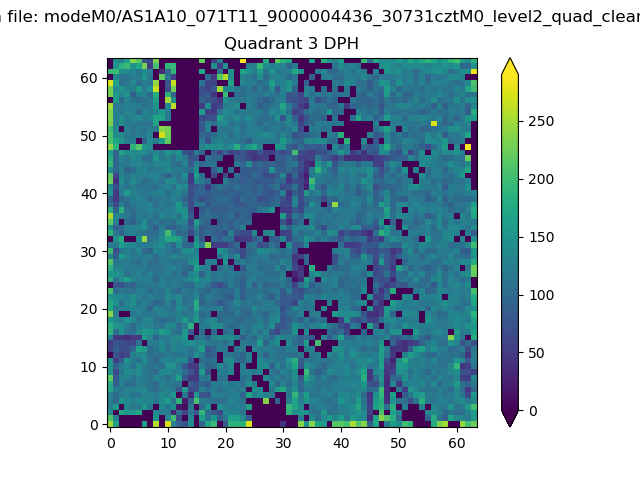 |
 |
Quadrant C |
| Plot type | Count rate plots | Images |
|---|---|---|
| Comparison with Poisson distribution Blue bars denote a histogram of data divided into 1 sec bins. Red curve is a Poisson curve with rate = median count rate of data. |
 |
 |
| Quadrant-wise count rates Data is divided into 100 sec bins |
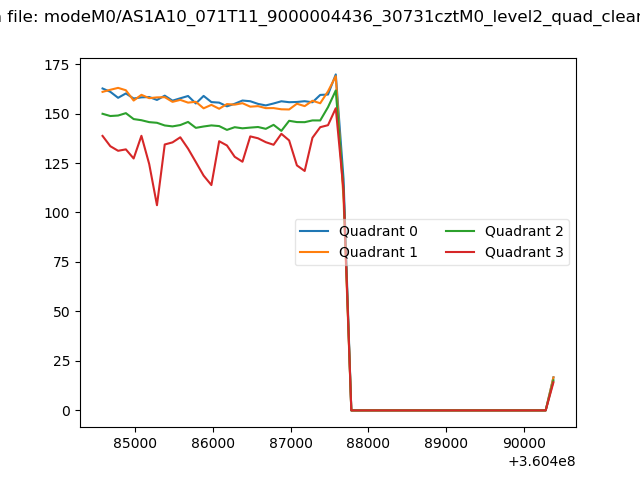 |
|
| Module-wise count rates for Quadrant A Data is divided into 100 sec bins |
 |
 |
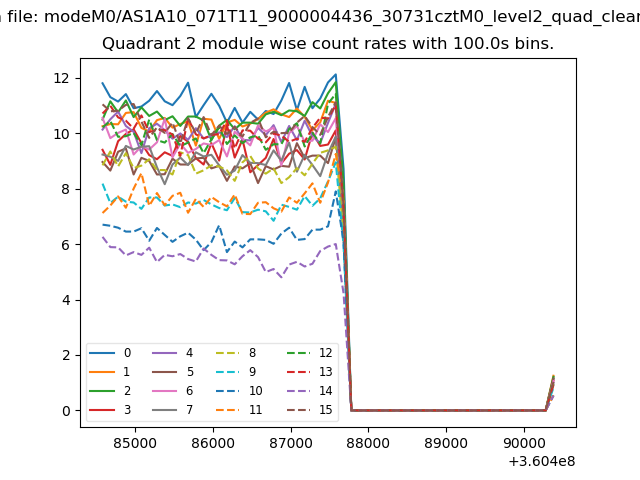
| Module-wise count rates for Quadrant B Data is divided into 100 sec bins |
 |
 |
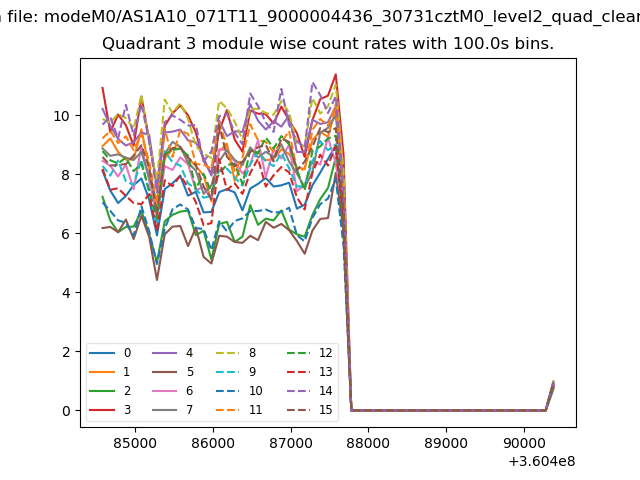
| Module-wise count rates for Quadrant C Data is divided into 100 sec bins |
 |
 |
| Module-wise count rates for Quadrant D Data is divided into 100 sec bins |
 |
 |
| Parameter | Plot |
|---|---|
| CZT HV Monitor | 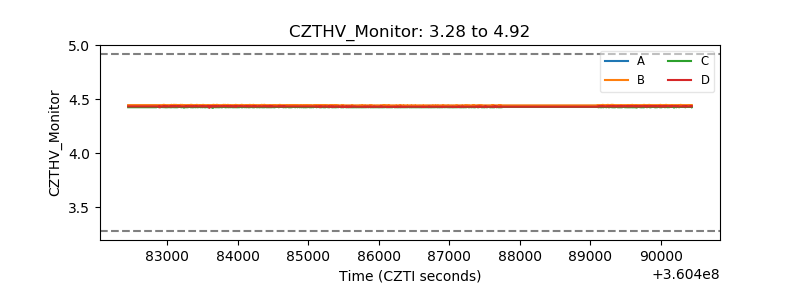 |
| D_VDD | 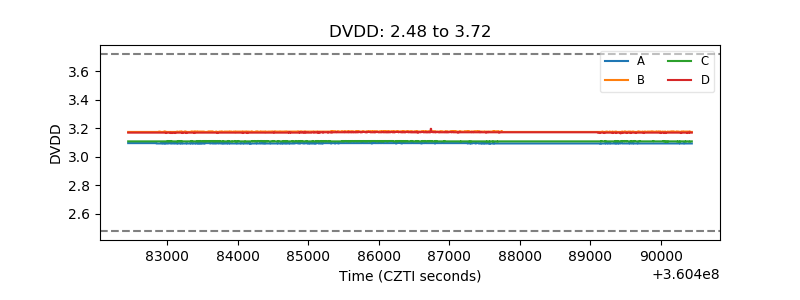 |
| Temperature 1 |  |
| Veto HV Monitor | 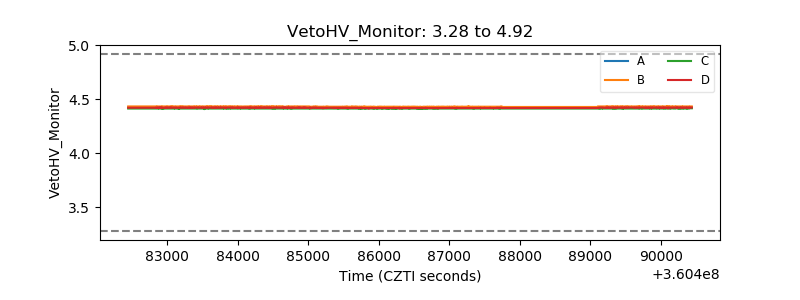 |
| Veto LLD |  |
| Alpha Counter | 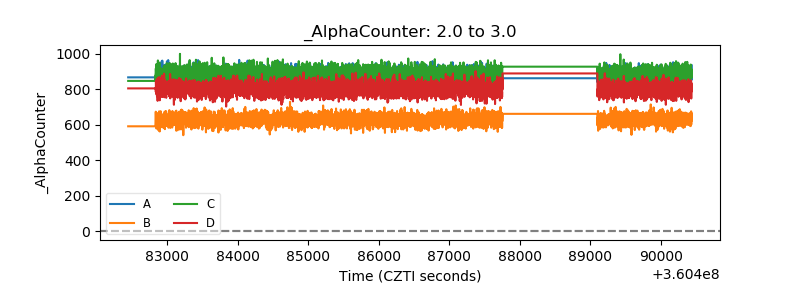 |
| _CPM_Rate | 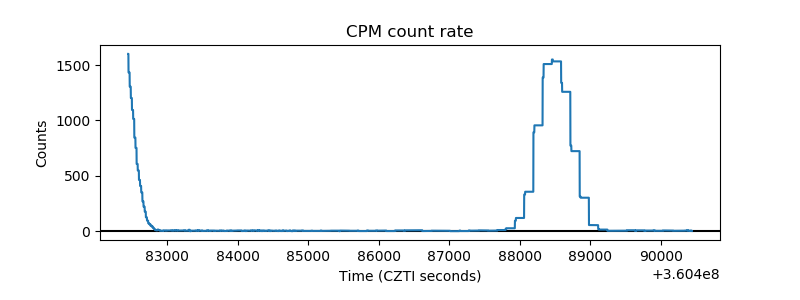 |
| CZT Counter | 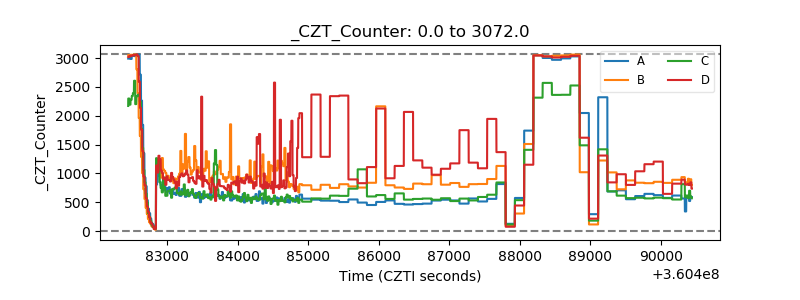 |
| +2.5 Volts monitor |  |
| +5 Volts monitor | 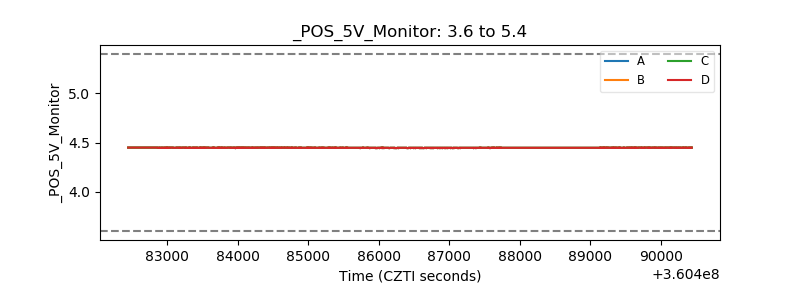 |
| _ROLL_ROT |  |
| _Roll_DEC | 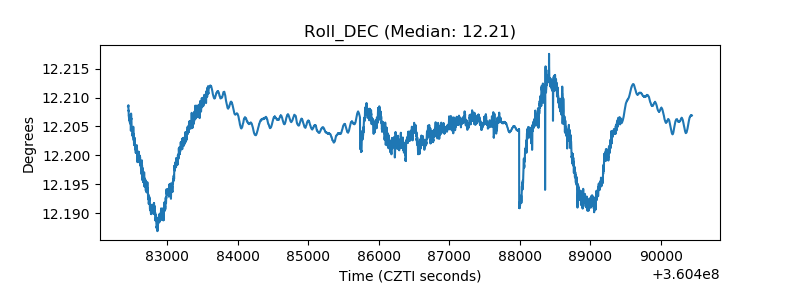 |
| _Roll_RA | 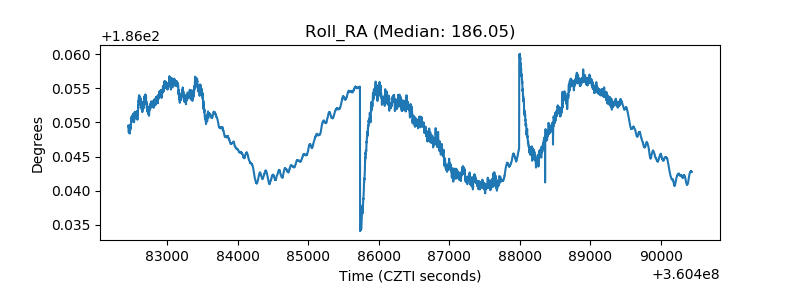 |
| Veto Counter | 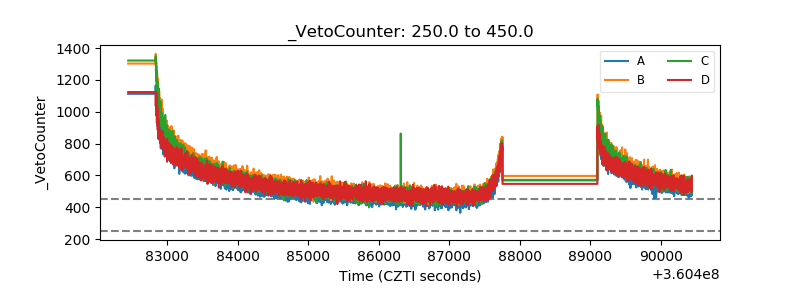 |