| Param | Original file | Final file |
|---|---|---|
| Filename | modeM0/AS1A10_071T11_9000004436_30735cztM0_level2.evt | modeM0/AS1A10_071T11_9000004436_30735cztM0_level2_quad_clean.evt |
| Size (bytes) | 689,688,000 | 108,535,680 |
| Size | 657.7 MB | 103.5 MB |
| Events in quadrant A | 3,850,451 | 713,337 |
| Events in quadrant B | 5,973,896 | 708,360 |
| Events in quadrant C | 4,145,265 | 676,864 |
| Events in quadrant D | 6,400,195 | 655,720 |
| Mode SS | |||
|---|---|---|---|
| Quadrant | BADHDUFLAG | Total packets | Discarded packets |
| A | 0 | 156 | 0 |
| B | 0 | 156 | 0 |
| C | 0 | 156 | 0 |
| D | 0 | 154 | 0 |
| Mode M9 | |||
|---|---|---|---|
| Quadrant | BADHDUFLAG | Total packets | Discarded packets |
| A | 0 | 1 | 0 |
| B | 0 | 1 | 0 |
| C | 0 | 1 | 0 |
| D | 0 | 1 | 0 |
| Mode M0 | |||
|---|---|---|---|
| Quadrant | BADHDUFLAG | Total packets | Discarded packets |
| A | 0 | 16223 | 1 |
| B | 0 | 23470 | 1 |
| C | 0 | 16924 | 1 |
| D | 0 | 24468 | 1 |
| Quadrant | Total seconds | Saturated seconds | Saturation percentage |
|---|---|---|---|
| A | 7655 | 238 | 3.109079% |
| B | 7655 | 363 | 4.741999% |
| C | 7655 | 314 | 4.101894% |
| D | 7655 | 410 | 5.355976% |
Noise dominated data is calculated using 1-second bins in cleaned event files. If a bin has >2000 counts, and if more than 50% of those come from <1% of pixels, then it is considered to be noise-dominated and hence unusable.
| Quadrant | # 1 sec bins | Bins with >0 counts | Bins with >2000 counts | High rate bins dominated by noise | Noise dominated (total time) | Noise dominated (detector-on time) | Marked lightcurve |
|---|---|---|---|---|---|---|---|
| A | 7740 | 7656 | 0 | 0 | 0.00% | 0.00% | 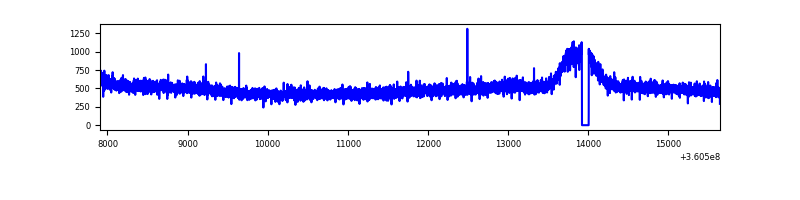 |
| B | 7740 | 7655 | 2 | 2 | 0.03% | 0.03% | 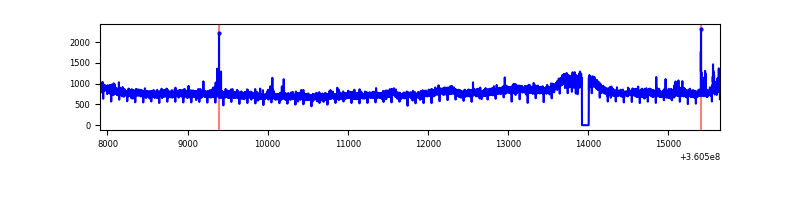 |
| C | 7740 | 7655 | 8 | 8 | 0.10% | 0.10% | 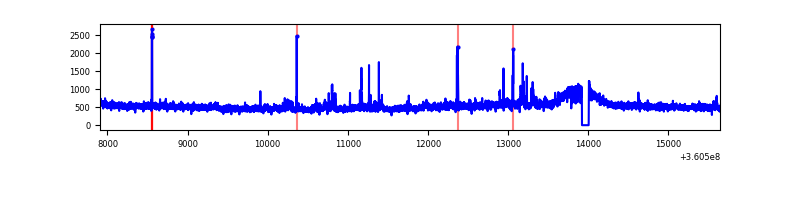 |
| D | 7740 | 7655 | 240 | 240 | 3.10% | 3.14% | 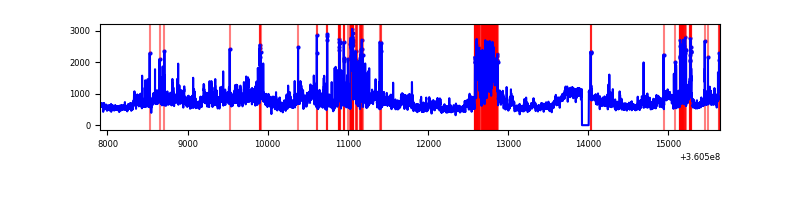 |
Top three noisy pixels from each quadrant. If the there are fewer than three noisy pixels in the level2.evt file, extra rows are filled as -1
| Pixel properties | Quadrant properties | ||||||
|---|---|---|---|---|---|---|---|
| Quadrant | DetID | PixID | Counts | Sigma | Mean | Median | Sigma |
| A | 13 | 254 | 13968 | 63.53 | 997 | 975 | 204.5 |
| A | 3 | 137 | 10048 | 44.36 | 997 | 975 | 204.5 |
| A | 0 | 226 | 8425 | 36.43 | 997 | 975 | 204.5 |
| B | 6 | 159 | 2075268 | 10855.75 | 972 | 945 | 191.1 |
| B | 5 | 172 | 40444 | 206.71 | 972 | 945 | 191.1 |
| B | 12 | 111 | 23464 | 117.85 | 972 | 945 | 191.1 |
| C | 3 | 233 | 269312 | 1185.65 | 946 | 952 | 226.3 |
| C | 14 | 238 | 149851 | 657.86 | 946 | 952 | 226.3 |
| C | 10 | 22 | 20125 | 84.71 | 946 | 952 | 226.3 |
| D | 8 | 195 | 1666133 | 6627.79 | 954 | 934 | 251.2 |
| D | 10 | 253 | 612284 | 2433.28 | 954 | 934 | 251.2 |
| D | 12 | 227 | 191982 | 760.41 | 954 | 934 | 251.2 |
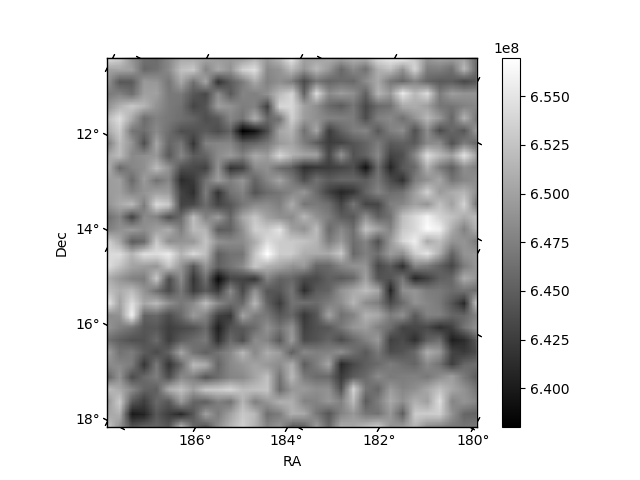
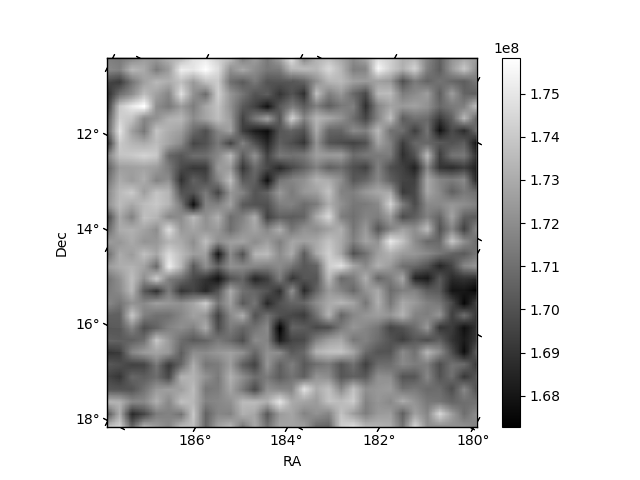
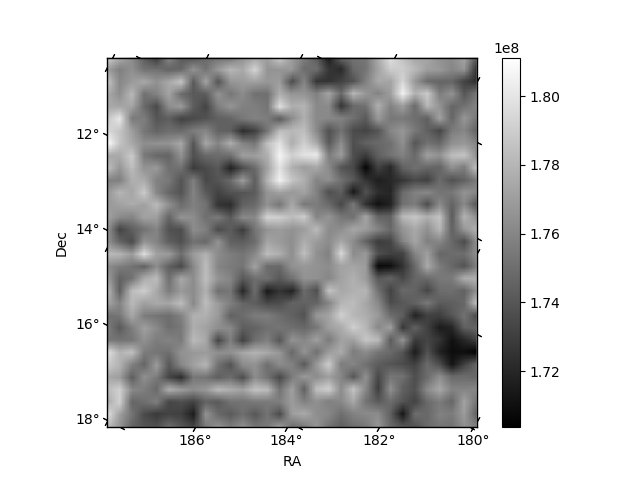
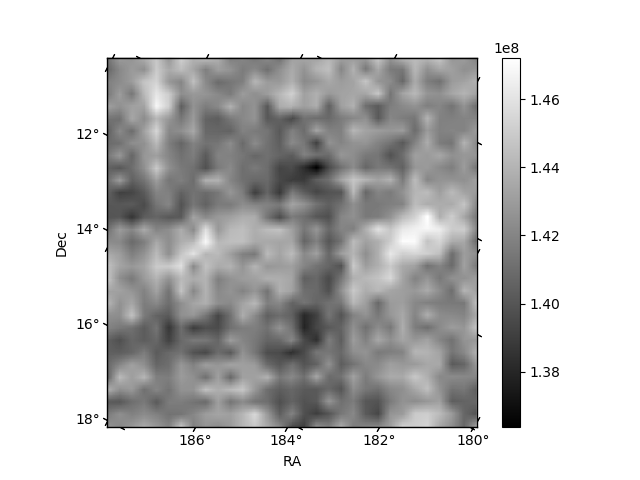
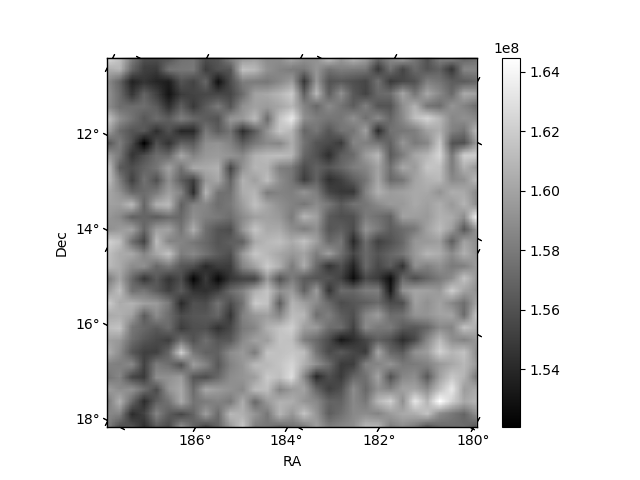
Histogram calculated using DETX and DETY for each event in the final _common_clean file
| Quadrant A | 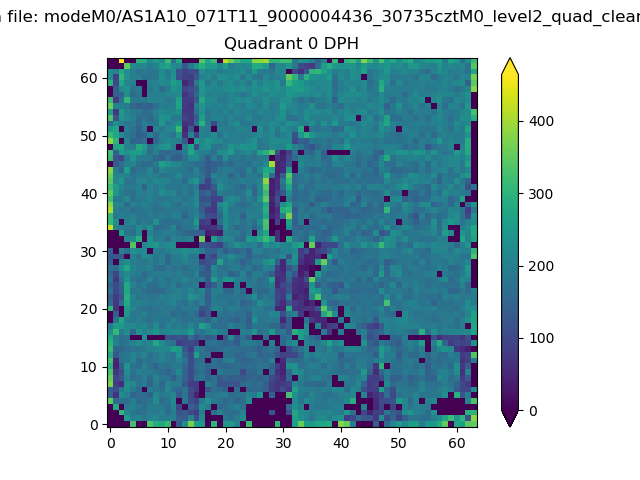 |
 |
Quadrant B |
|---|---|---|---|
| Quadrant D | 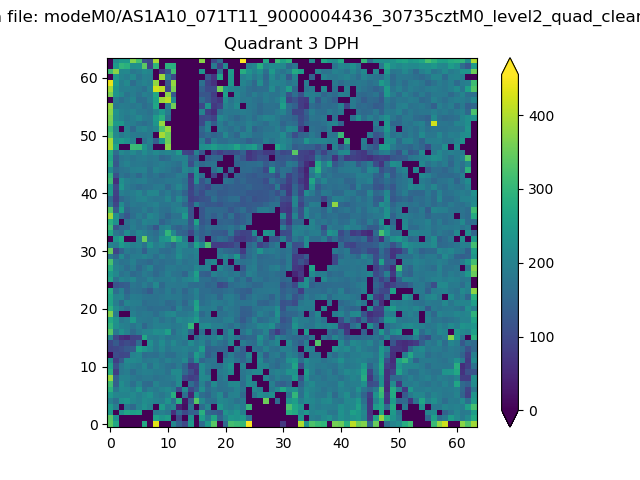 |
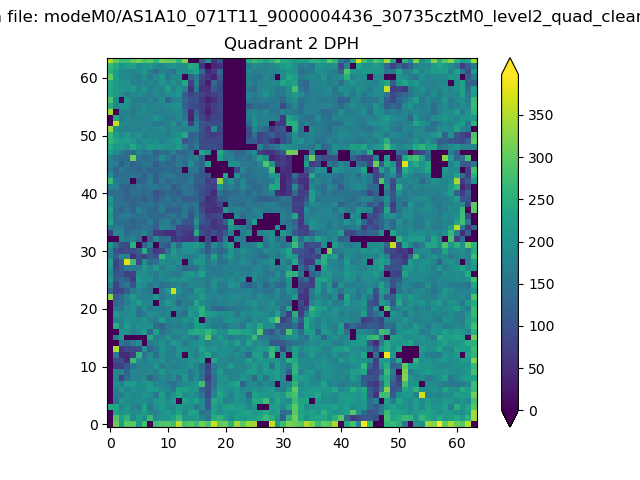 |
Quadrant C |
| Plot type | Count rate plots | Images |
|---|---|---|
| Comparison with Poisson distribution Blue bars denote a histogram of data divided into 1 sec bins. Red curve is a Poisson curve with rate = median count rate of data. |
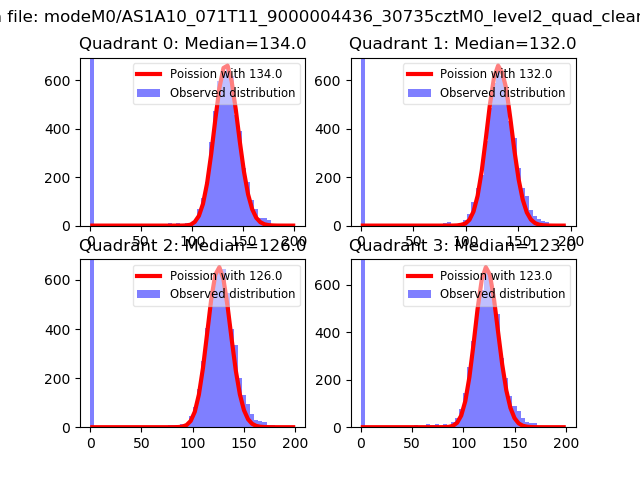 |
 |
| Quadrant-wise count rates Data is divided into 100 sec bins |
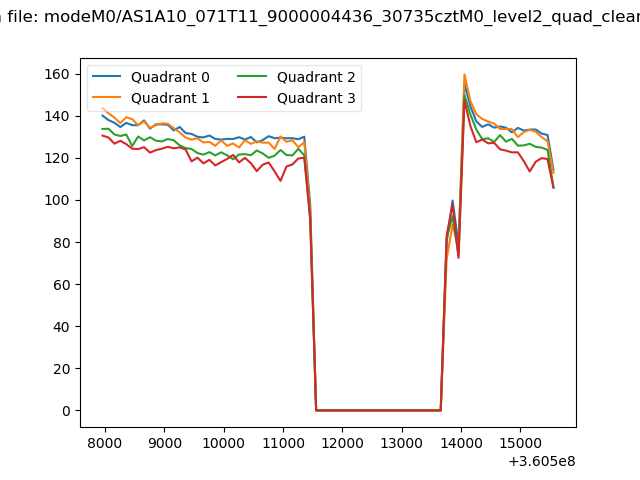 |
|
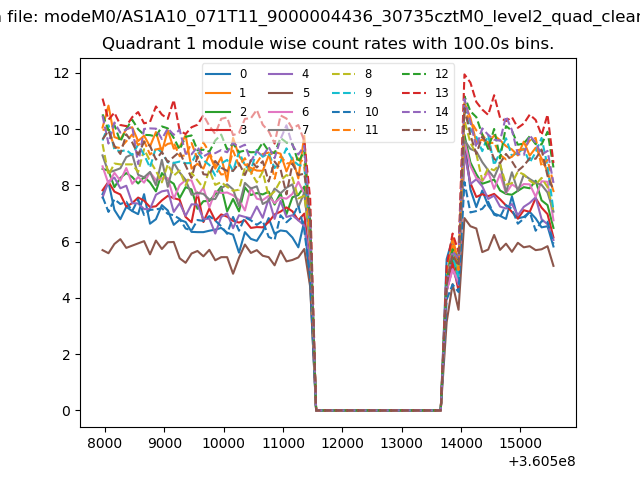
| Module-wise count rates for Quadrant A Data is divided into 100 sec bins |
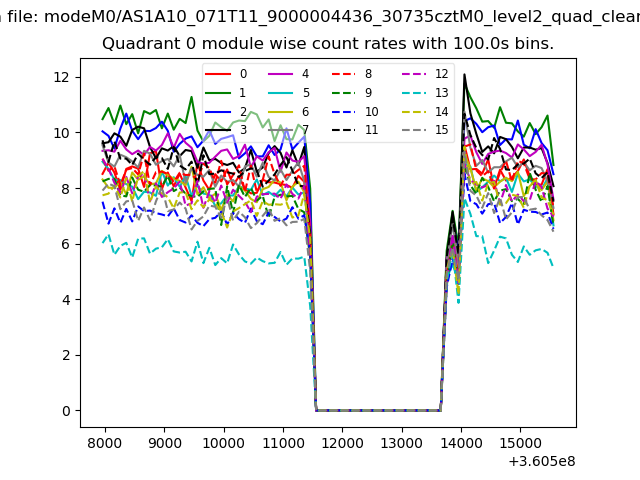 |
 |
| Module-wise count rates for Quadrant B Data is divided into 100 sec bins |
 |
 |
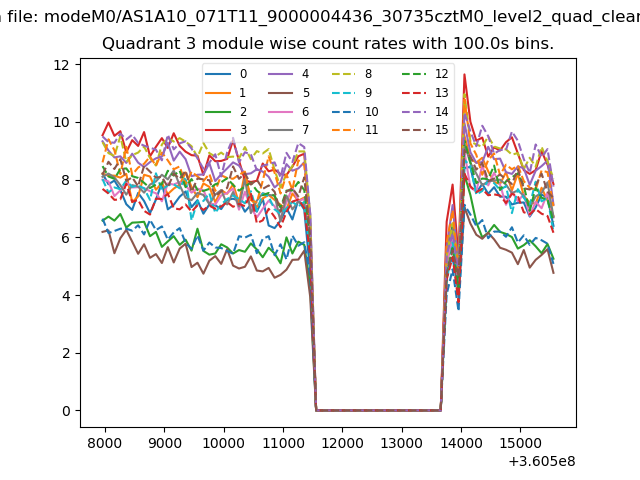
| Module-wise count rates for Quadrant C Data is divided into 100 sec bins |
 |
 |
| Module-wise count rates for Quadrant D Data is divided into 100 sec bins |
 |
 |
| Parameter | Plot |
|---|---|
| CZT HV Monitor | 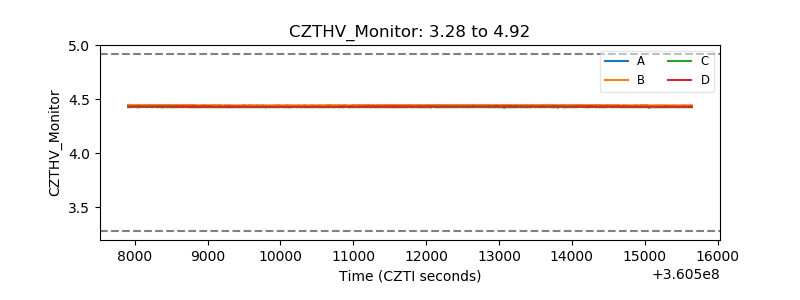 |
| D_VDD | 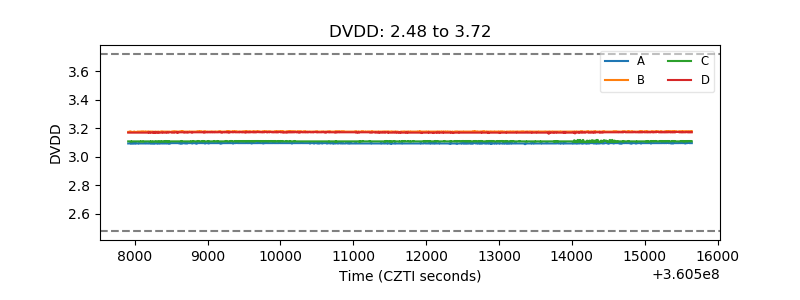 |
| Temperature 1 | 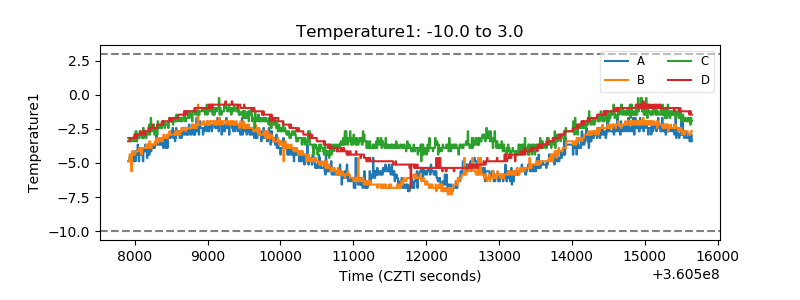 |
| Veto HV Monitor | 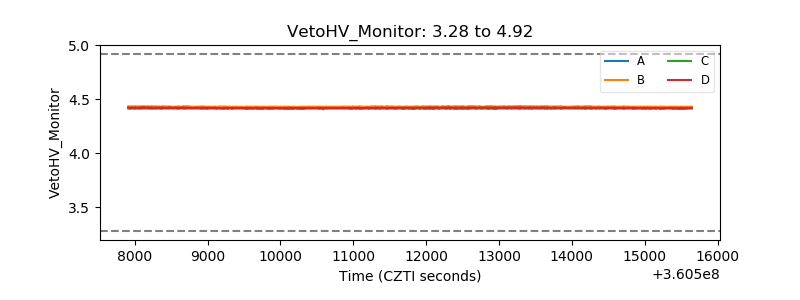 |
| Veto LLD | 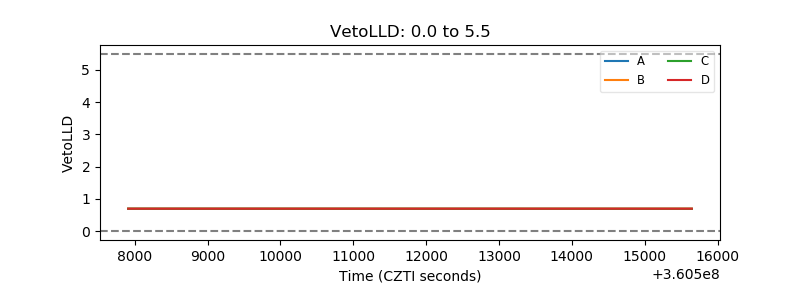 |
| Alpha Counter | 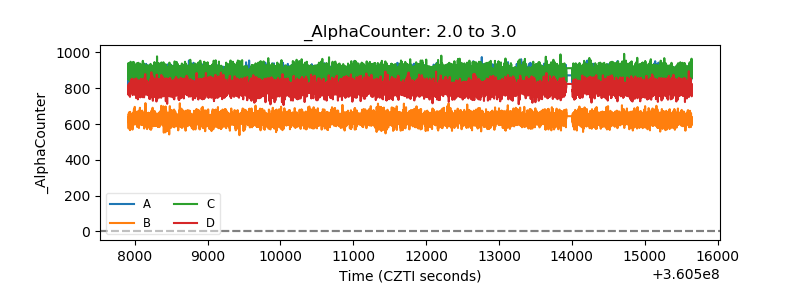 |
| _CPM_Rate | 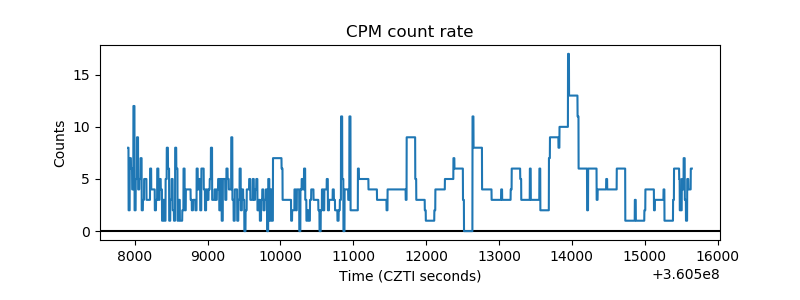 |
| CZT Counter | 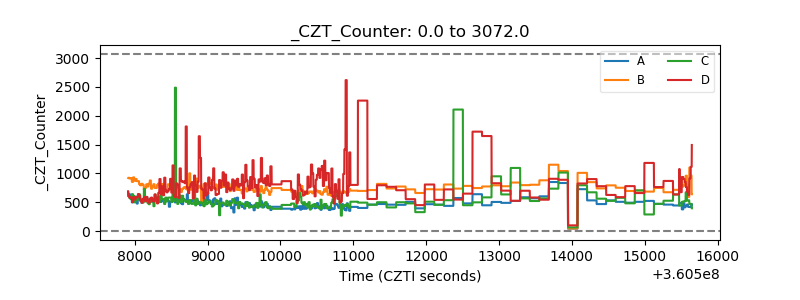 |
| +2.5 Volts monitor |  |
| +5 Volts monitor |  |
| _ROLL_ROT | 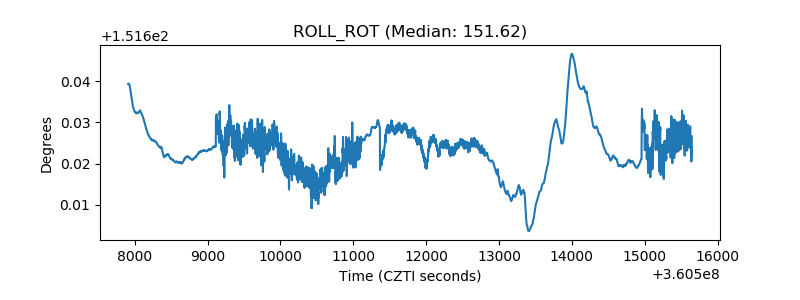 |
| _Roll_DEC | 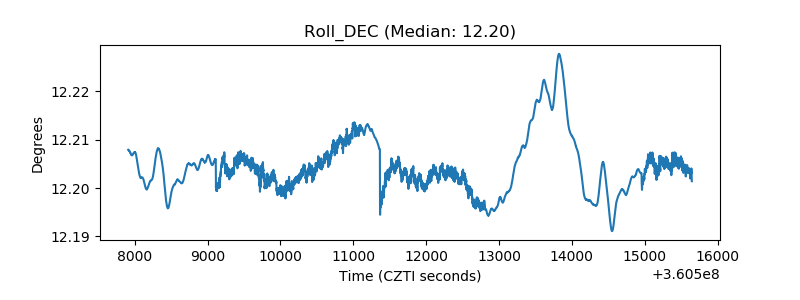 |
| _Roll_RA | 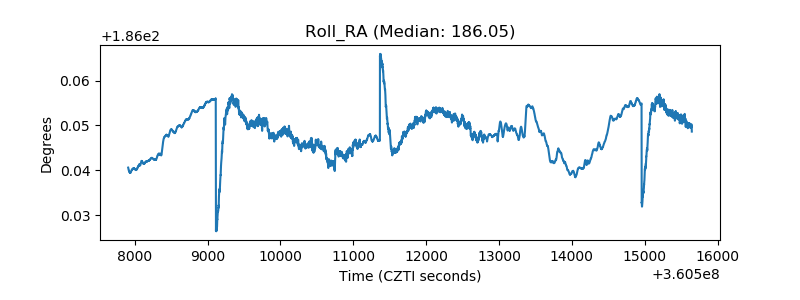 |
| Veto Counter |  |