| Param | Original file | Final file |
|---|---|---|
| Filename | modeM0/AS1A10_071T11_9000004436_30736cztM0_level2.evt | modeM0/AS1A10_071T11_9000004436_30736cztM0_level2_quad_clean.evt |
| Size (bytes) | 662,132,160 | 103,026,240 |
| Size | 631.5 MB | 98.3 MB |
| Events in quadrant A | 3,615,691 | 678,402 |
| Events in quadrant B | 6,220,274 | 665,062 |
| Events in quadrant C | 3,713,767 | 645,844 |
| Events in quadrant D | 6,001,246 | 614,041 |
| Mode SS | |||
|---|---|---|---|
| Quadrant | BADHDUFLAG | Total packets | Discarded packets |
| A | 0 | 150 | 0 |
| B | 0 | 152 | 0 |
| C | 0 | 152 | 0 |
| D | 0 | 152 | 0 |
| Mode M9 | |||
|---|---|---|---|
| Quadrant | BADHDUFLAG | Total packets | Discarded packets |
| A | 0 | 2 | 0 |
| B | 0 | 2 | 0 |
| C | 0 | 2 | 0 |
| D | 0 | 2 | 0 |
| Mode M0 | |||
|---|---|---|---|
| Quadrant | BADHDUFLAG | Total packets | Discarded packets |
| A | 0 | 15444 | 1 |
| B | 0 | 23895 | 1 |
| C | 0 | 15575 | 1 |
| D | 0 | 23213 | 1 |
| Quadrant | Total seconds | Saturated seconds | Saturation percentage |
|---|---|---|---|
| A | 7418 | 100 | 1.348072% |
| B | 7418 | 324 | 4.367754% |
| C | 7419 | 178 | 2.399245% |
| D | 7419 | 393 | 5.297210% |
Noise dominated data is calculated using 1-second bins in cleaned event files. If a bin has >2000 counts, and if more than 50% of those come from <1% of pixels, then it is considered to be noise-dominated and hence unusable.
| Quadrant | # 1 sec bins | Bins with >0 counts | Bins with >2000 counts | High rate bins dominated by noise | Noise dominated (total time) | Noise dominated (detector-on time) | Marked lightcurve |
|---|---|---|---|---|---|---|---|
| A | 7673 | 7418 | 1 | 1 | 0.01% | 0.01% | 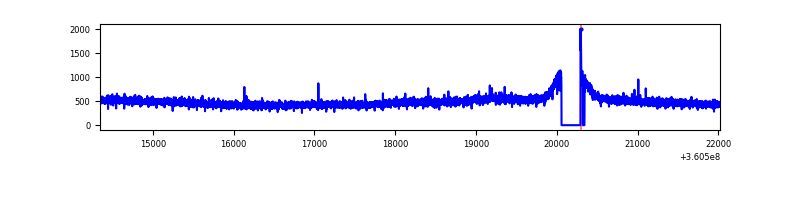 |
| B | 7673 | 7418 | 129 | 129 | 1.68% | 1.74% | 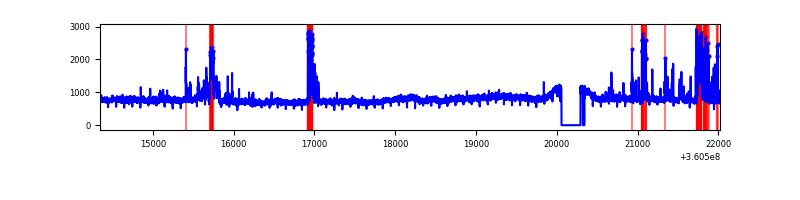 |
| C | 7674 | 7419 | 0 | 0 | 0.00% | 0.00% | 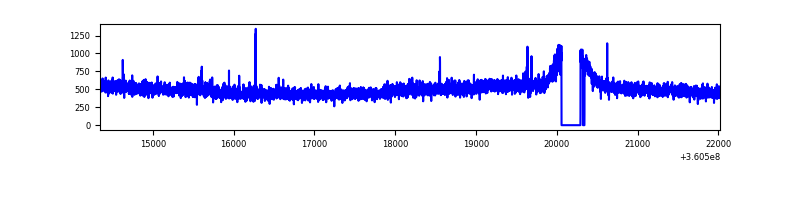 |
| D | 7674 | 7419 | 305 | 305 | 3.97% | 4.11% | 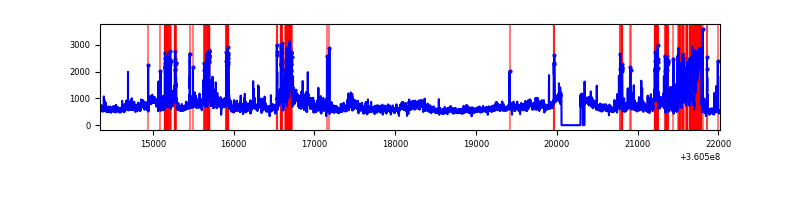 |
Top three noisy pixels from each quadrant. If the there are fewer than three noisy pixels in the level2.evt file, extra rows are filled as -1
| Pixel properties | Quadrant properties | ||||||
|---|---|---|---|---|---|---|---|
| Quadrant | DetID | PixID | Counts | Sigma | Mean | Median | Sigma |
| A | 13 | 254 | 13946 | 68.6 | 931 | 911 | 190.0 |
| A | 8 | 192 | 9519 | 45.3 | 931 | 911 | 190.0 |
| A | 3 | 137 | 9284 | 44.06 | 931 | 911 | 190.0 |
| B | 6 | 159 | 2046835 | 11556.0 | 910 | 884 | 177.0 |
| B | 5 | 172 | 272418 | 1533.69 | 910 | 884 | 177.0 |
| B | 5 | 255 | 166243 | 933.99 | 910 | 884 | 177.0 |
| C | 14 | 238 | 143663 | 677.99 | 888 | 892 | 210.6 |
| C | 3 | 233 | 75943 | 356.4 | 888 | 892 | 210.6 |
| C | 2 | 114 | 17502 | 78.88 | 888 | 892 | 210.6 |
| D | 8 | 195 | 1551359 | 7271.05 | 888 | 865 | 213.2 |
| D | 13 | 249 | 868754 | 4069.97 | 888 | 865 | 213.2 |
| D | 12 | 227 | 61559 | 284.62 | 888 | 865 | 213.2 |
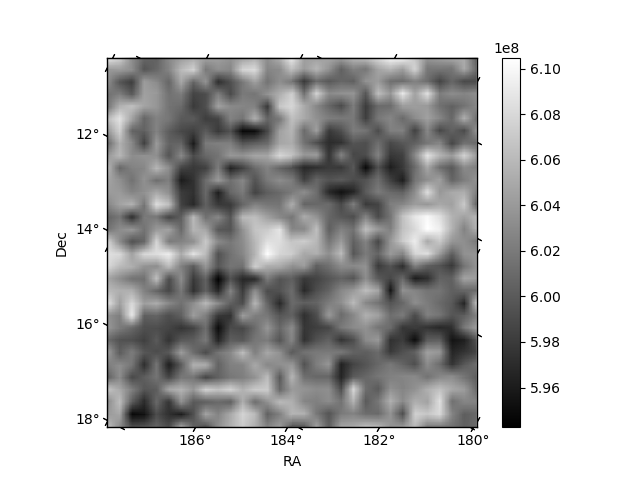
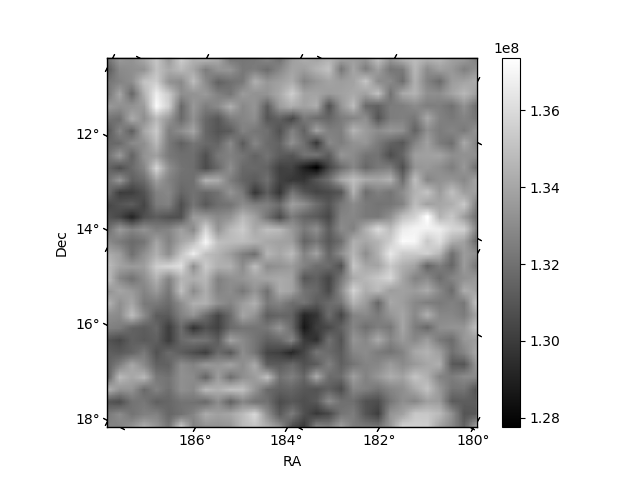
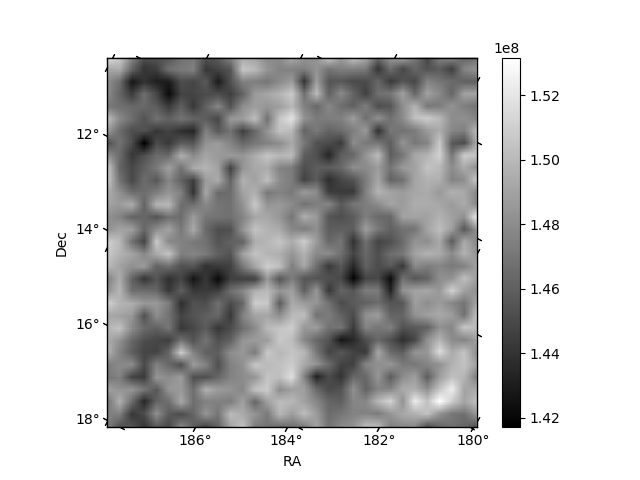
Histogram calculated using DETX and DETY for each event in the final _common_clean file
| Quadrant A | 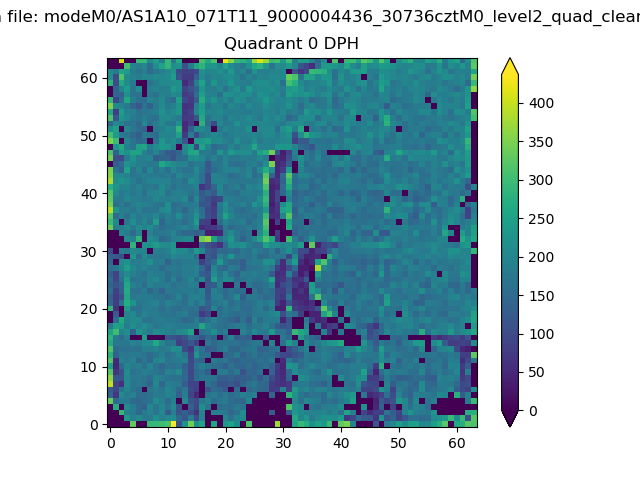 |
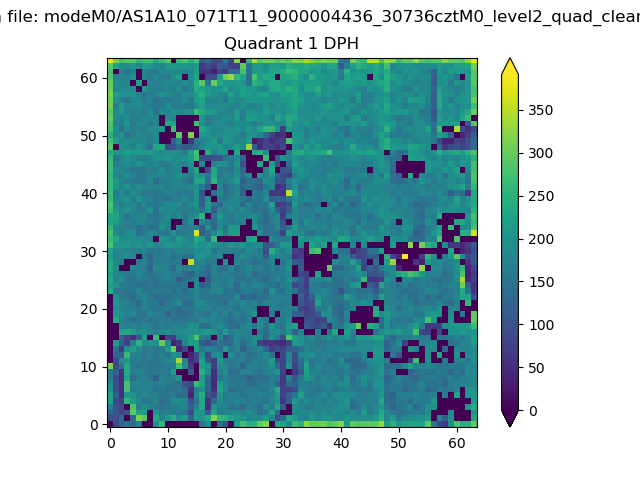 |
Quadrant B |
|---|---|---|---|
| Quadrant D | 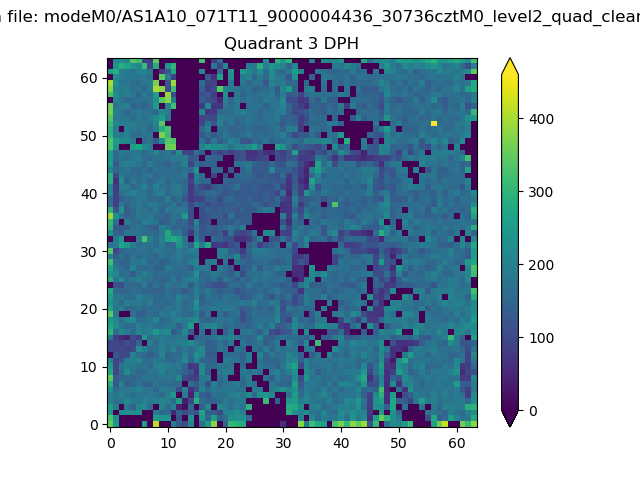 |
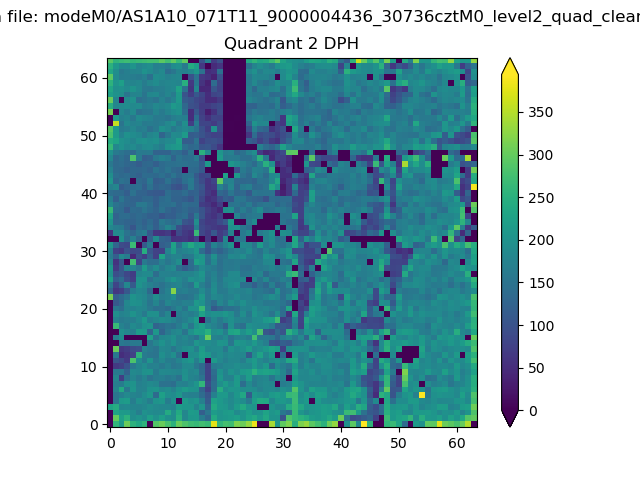 |
Quadrant C |
| Plot type | Count rate plots | Images |
|---|---|---|
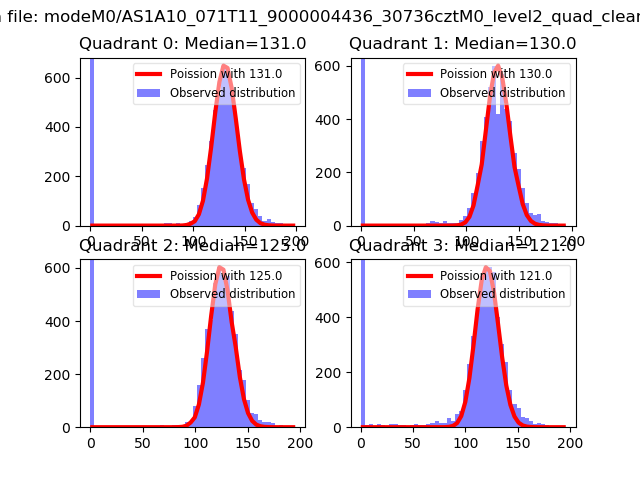
| Comparison with Poisson distribution Blue bars denote a histogram of data divided into 1 sec bins. Red curve is a Poisson curve with rate = median count rate of data. |
 |
 |
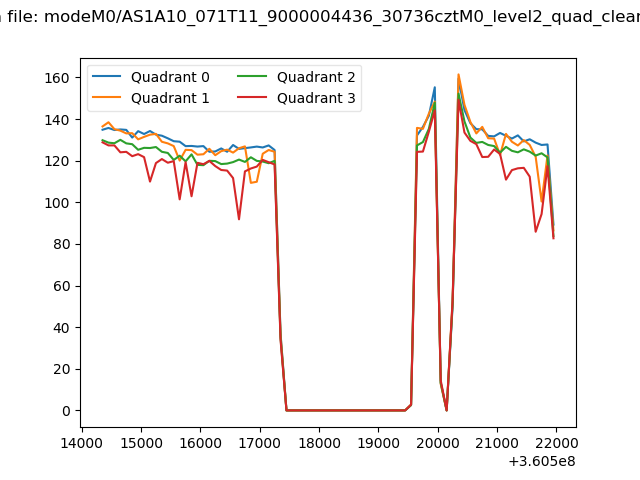
| Quadrant-wise count rates Data is divided into 100 sec bins |
 |
|
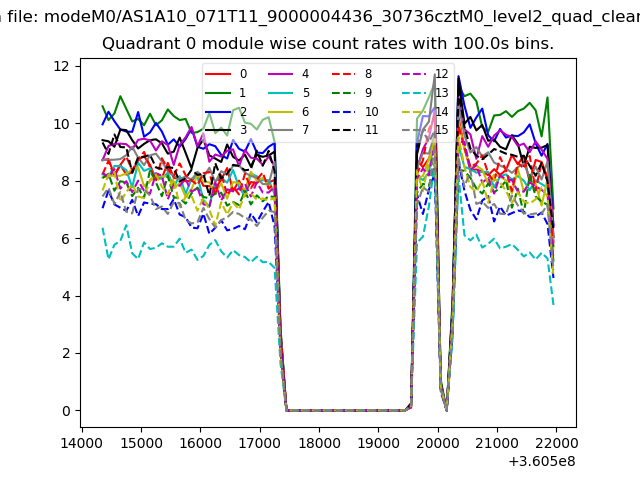
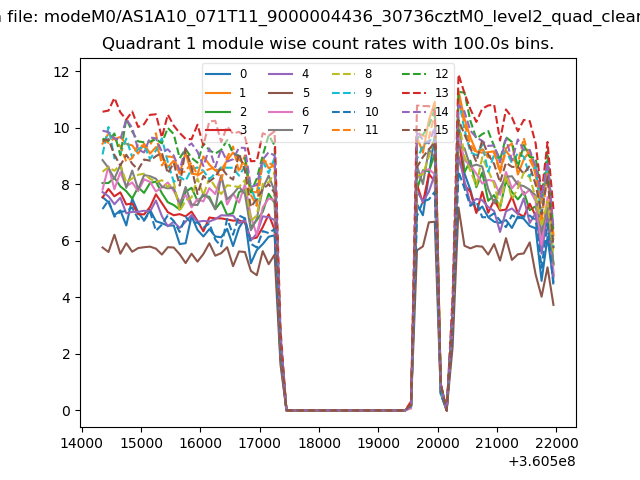
| Module-wise count rates for Quadrant A Data is divided into 100 sec bins |
 |
 |
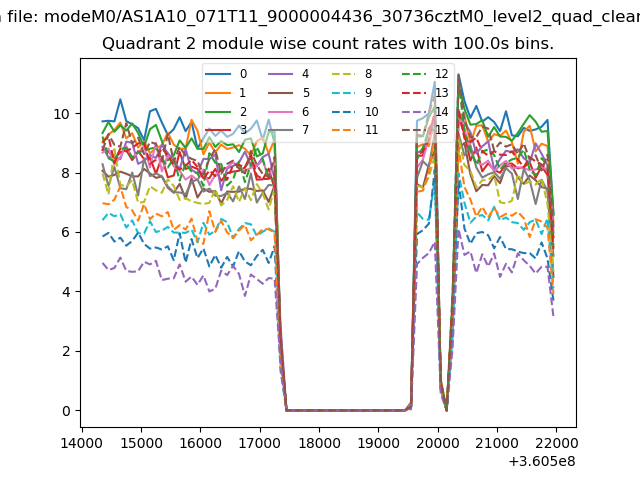
| Module-wise count rates for Quadrant B Data is divided into 100 sec bins |
 |
 |
| Module-wise count rates for Quadrant C Data is divided into 100 sec bins |
 |
 |
| Module-wise count rates for Quadrant D Data is divided into 100 sec bins |
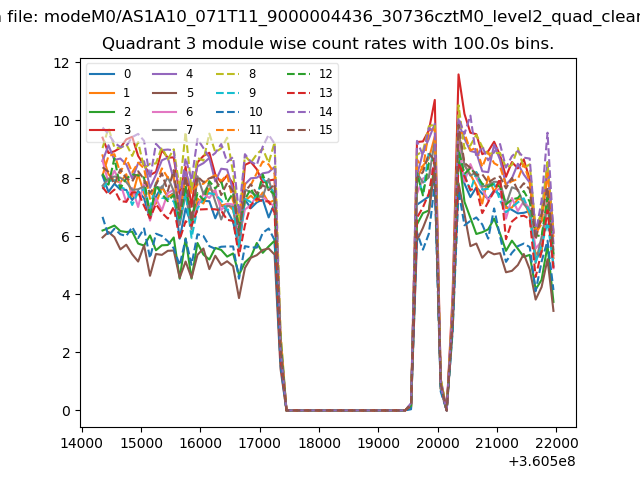 |
 |
| Parameter | Plot |
|---|---|
| CZT HV Monitor | 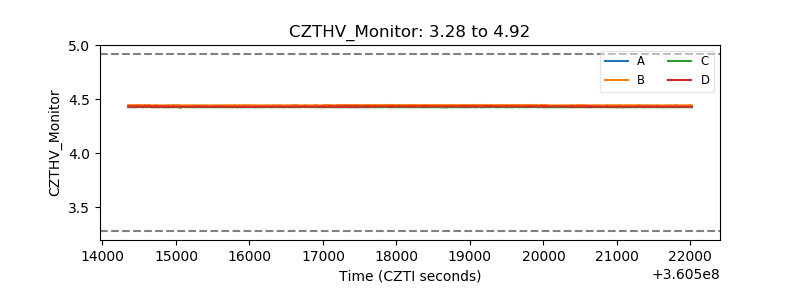 |
| D_VDD | 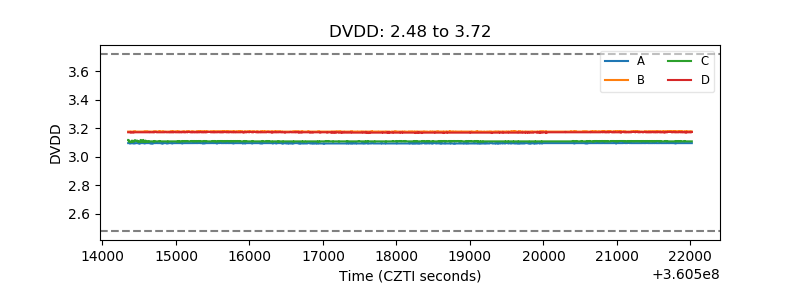 |
| Temperature 1 |  |
| Veto HV Monitor | 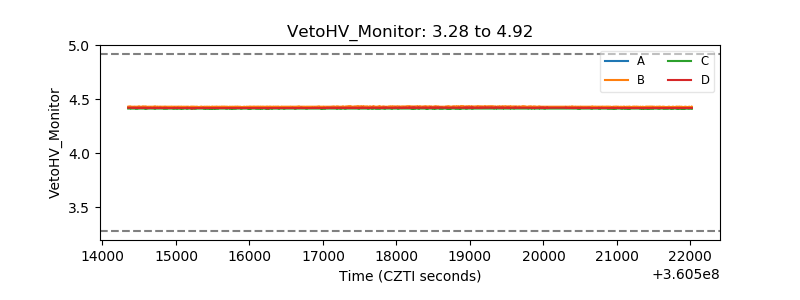 |
| Veto LLD | 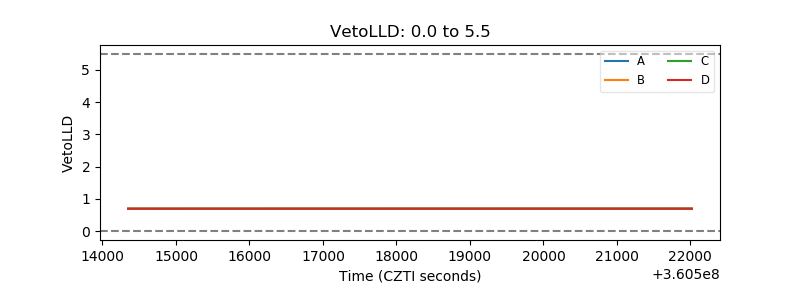 |
| Alpha Counter | 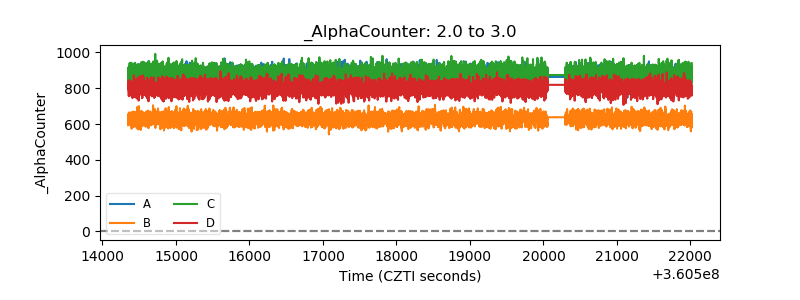 |
| _CPM_Rate | 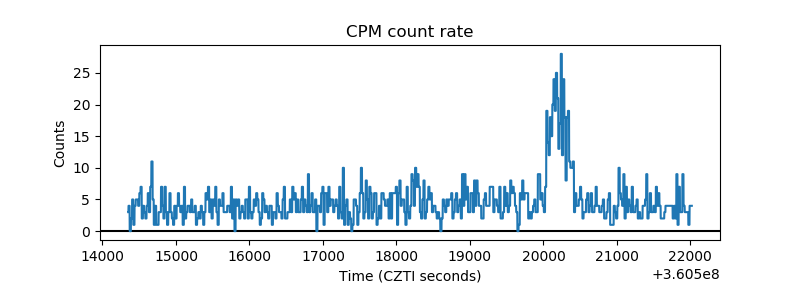 |
| CZT Counter | 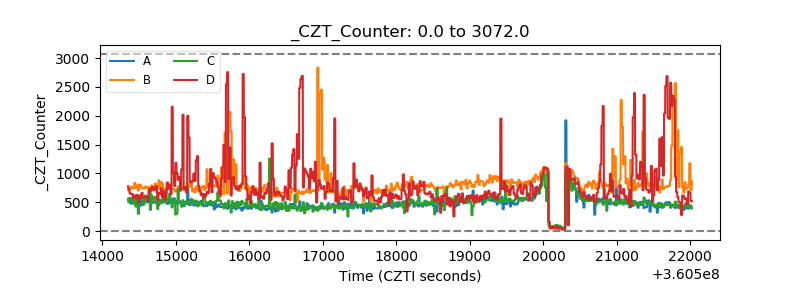 |
| +2.5 Volts monitor |  |
| +5 Volts monitor | 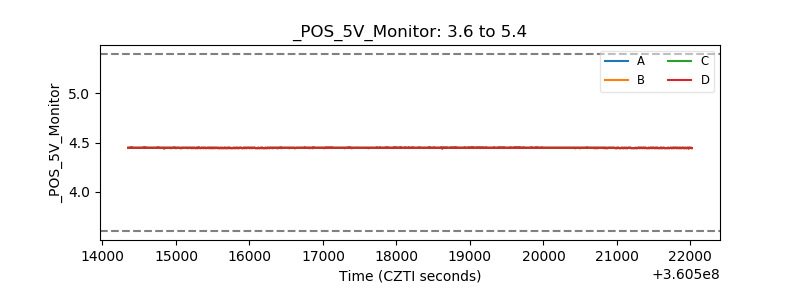 |
| _ROLL_ROT |  |
| _Roll_DEC | 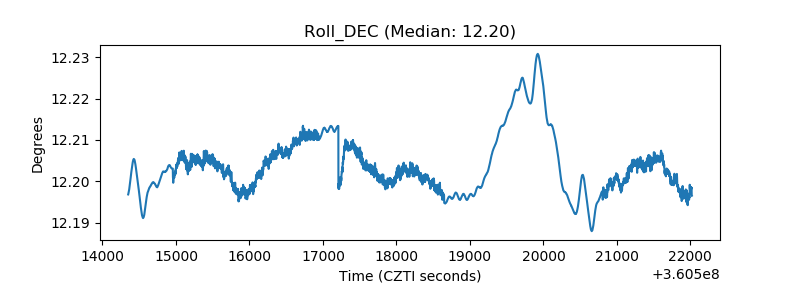 |
| _Roll_RA | 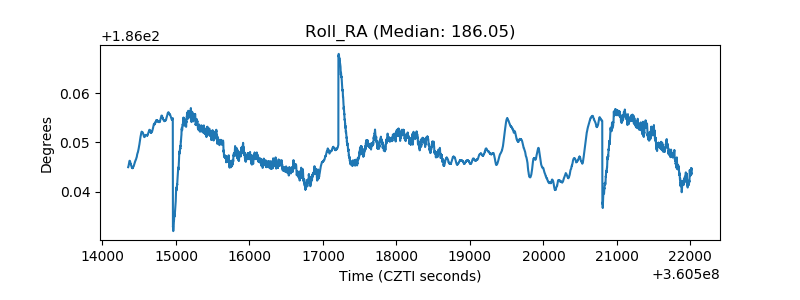 |
| Veto Counter | 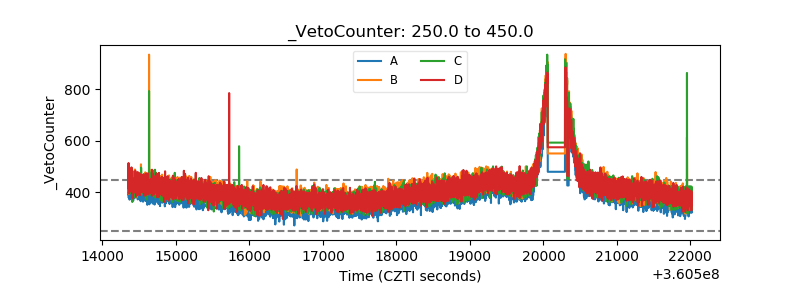 |