| Param | Original file | Final file |
|---|---|---|
| Filename | modeM0/AS1A10_071T11_9000004436_30740cztM0_level2.evt | modeM0/AS1A10_071T11_9000004436_30740cztM0_level2_quad_clean.evt |
| Size (bytes) | 1,581,315,840 | 222,675,840 |
| Size | 1.5 GB | 212.4 MB |
| Events in quadrant A | 8,457,427 | 1,440,311 |
| Events in quadrant B | 14,151,082 | 1,420,879 |
| Events in quadrant C | 9,101,255 | 1,375,130 |
| Events in quadrant D | 14,992,203 | 1,290,399 |
| Mode SS | |||
|---|---|---|---|
| Quadrant | BADHDUFLAG | Total packets | Discarded packets |
| A | 0 | 360 | 0 |
| B | 0 | 360 | 0 |
| C | 0 | 360 | 0 |
| D | 0 | 360 | 0 |
| Mode M9 | |||
|---|---|---|---|
| Quadrant | BADHDUFLAG | Total packets | Discarded packets |
| A | 0 | 21 | 0 |
| B | 0 | 22 | 0 |
| C | 0 | 22 | 0 |
| D | 0 | 22 | 0 |
| Mode M0 | |||
|---|---|---|---|
| Quadrant | BADHDUFLAG | Total packets | Discarded packets |
| A | 0 | 36568 | 4 |
| B | 0 | 55068 | 4 |
| C | 0 | 38233 | 4 |
| D | 0 | 56419 | 4 |
| Quadrant | Total seconds | Saturated seconds | Saturation percentage |
|---|---|---|---|
| A | 17661 | 118 | 0.668139% |
| B | 17661 | 483 | 2.734839% |
| C | 17661 | 342 | 1.936470% |
| D | 17661 | 940 | 5.322462% |
Noise dominated data is calculated using 1-second bins in cleaned event files. If a bin has >2000 counts, and if more than 50% of those come from <1% of pixels, then it is considered to be noise-dominated and hence unusable.
| Quadrant | # 1 sec bins | Bins with >0 counts | Bins with >2000 counts | High rate bins dominated by noise | Noise dominated (total time) | Noise dominated (detector-on time) | Marked lightcurve |
|---|---|---|---|---|---|---|---|
| A | 19651 | 17662 | 1 | 1 | 0.01% | 0.01% | 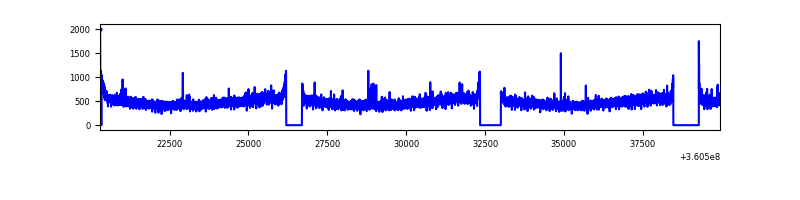 |
| B | 19651 | 17661 | 169 | 169 | 0.86% | 0.96% | 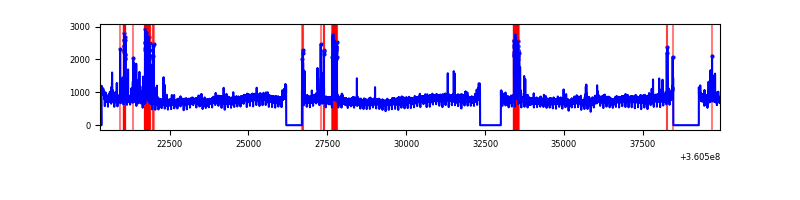 |
| C | 19651 | 17661 | 51 | 51 | 0.26% | 0.29% | 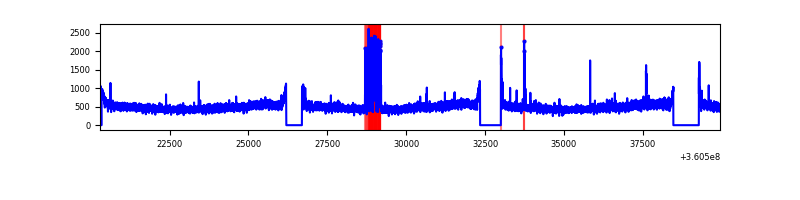 |
| D | 19651 | 17663 | 787 | 787 | 4.00% | 4.46% | 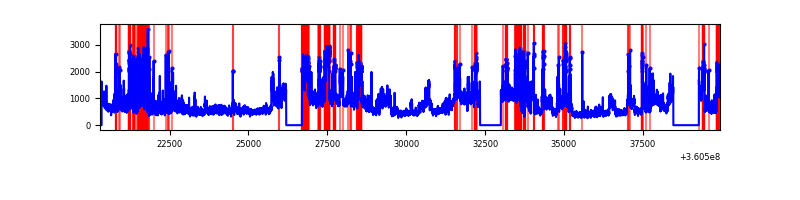 |
Top three noisy pixels from each quadrant. If the there are fewer than three noisy pixels in the level2.evt file, extra rows are filled as -1
| Pixel properties | Quadrant properties | ||||||
|---|---|---|---|---|---|---|---|
| Quadrant | DetID | PixID | Counts | Sigma | Mean | Median | Sigma |
| A | 13 | 254 | 32994 | 70.82 | 2178 | 2134 | 435.8 |
| A | 0 | 13 | 24439 | 51.19 | 2178 | 2134 | 435.8 |
| A | 3 | 137 | 21996 | 45.58 | 2178 | 2134 | 435.8 |
| B | 6 | 159 | 4961523 | 12043.62 | 2138 | 2083 | 411.8 |
| B | 5 | 255 | 480133 | 1160.91 | 2138 | 2083 | 411.8 |
| B | 5 | 172 | 185472 | 445.34 | 2138 | 2083 | 411.8 |
| C | 3 | 233 | 521684 | 1063.24 | 2078 | 2087 | 488.7 |
| C | 14 | 238 | 336909 | 685.14 | 2078 | 2087 | 488.7 |
| C | 2 | 114 | 41950 | 81.57 | 2078 | 2087 | 488.7 |
| D | 8 | 195 | 5288207 | 10057.11 | 2050 | 2013 | 525.6 |
| D | 13 | 249 | 1135486 | 2156.46 | 2050 | 2013 | 525.6 |
| D | 10 | 253 | 457342 | 866.27 | 2050 | 2013 | 525.6 |
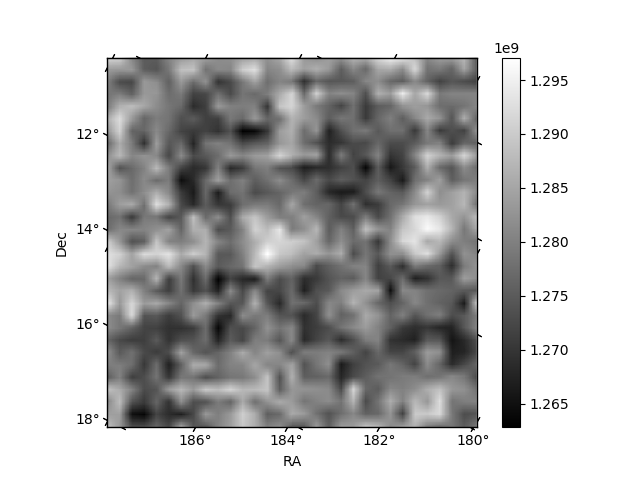
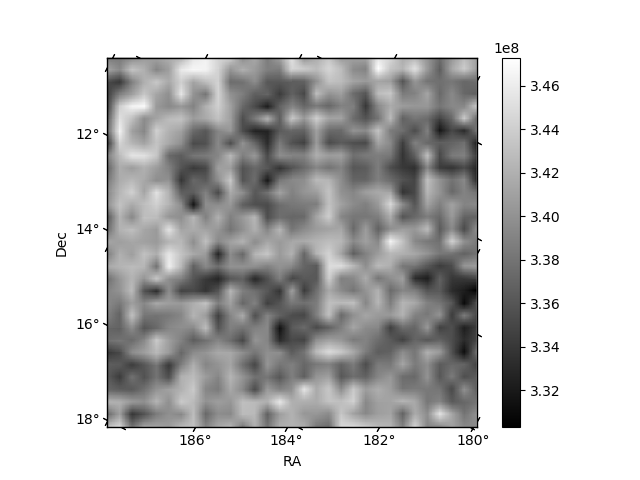
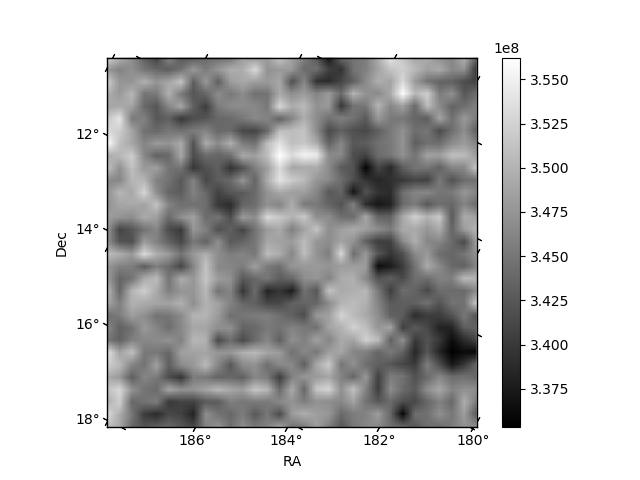
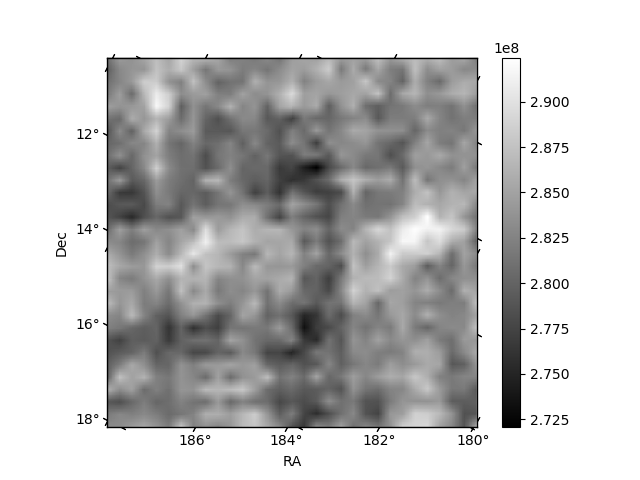
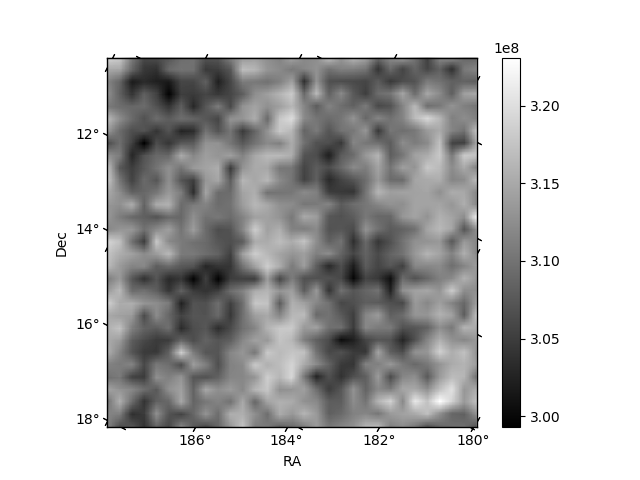
Histogram calculated using DETX and DETY for each event in the final _common_clean file
| Quadrant A | 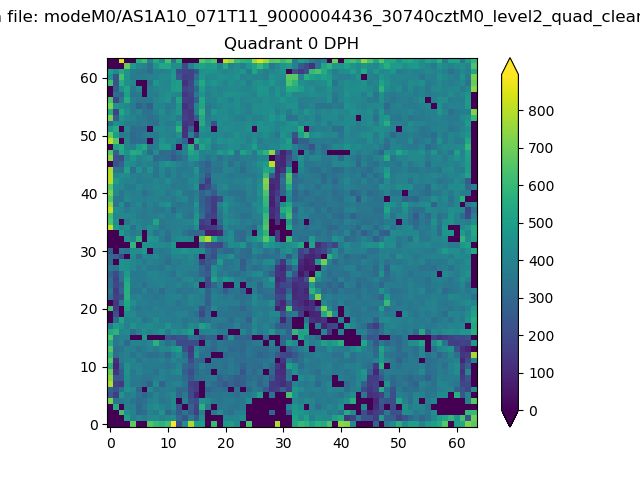 |
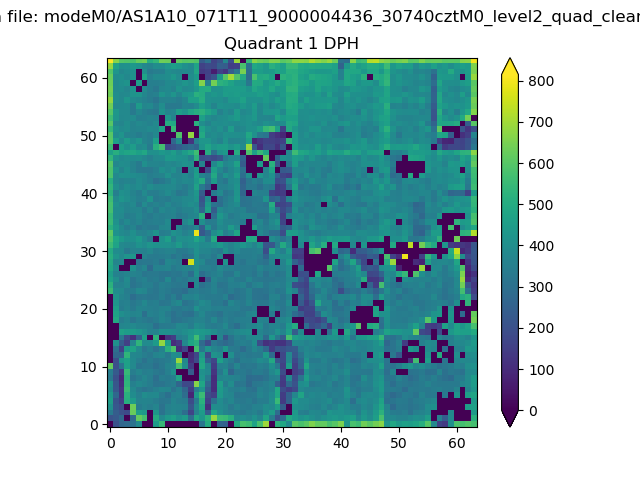 |
Quadrant B |
|---|---|---|---|
| Quadrant D |  |
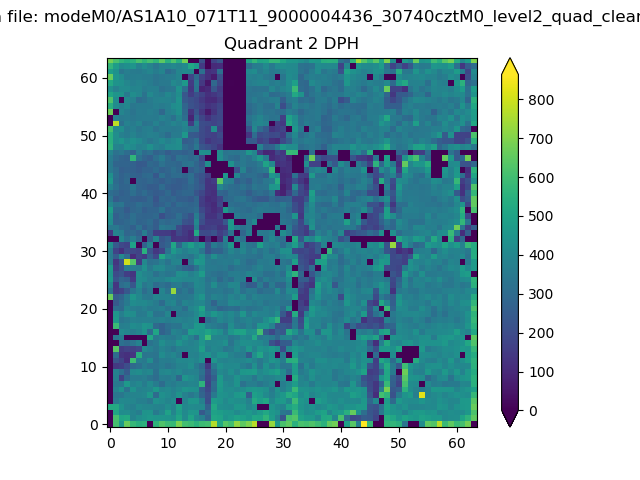 |
Quadrant C |
| Plot type | Count rate plots | Images |
|---|---|---|
| Comparison with Poisson distribution Blue bars denote a histogram of data divided into 1 sec bins. Red curve is a Poisson curve with rate = median count rate of data. |
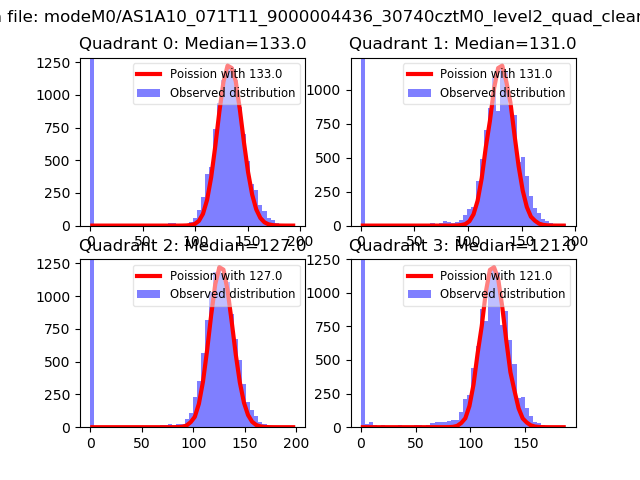 |
 |
| Quadrant-wise count rates Data is divided into 100 sec bins |
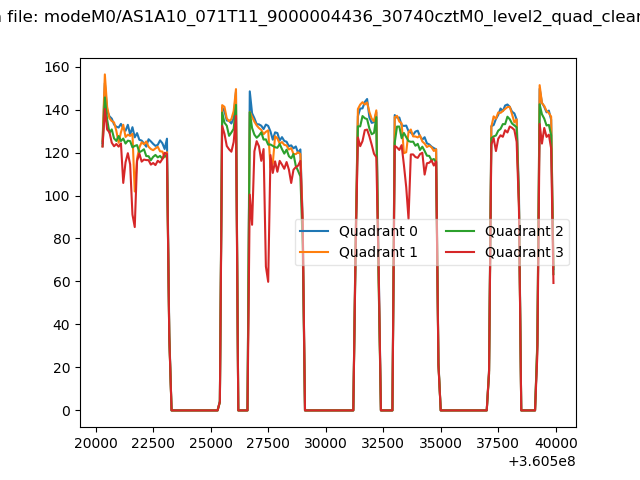 |
|
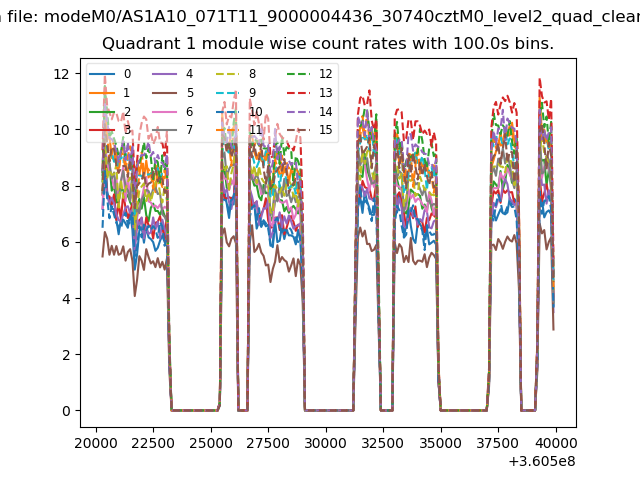
| Module-wise count rates for Quadrant A Data is divided into 100 sec bins |
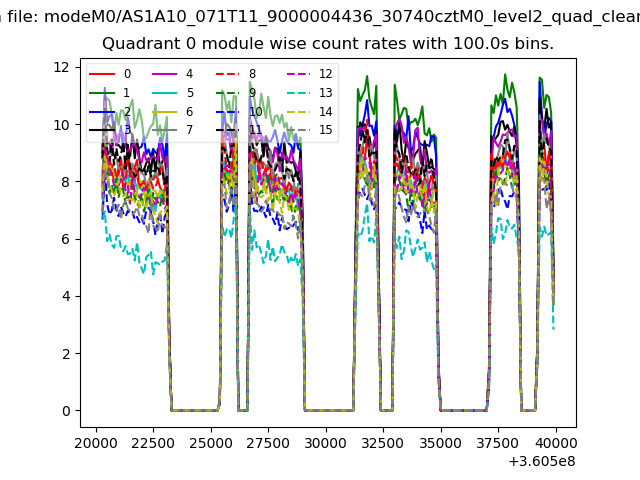 |
 |
| Module-wise count rates for Quadrant B Data is divided into 100 sec bins |
 |
 |
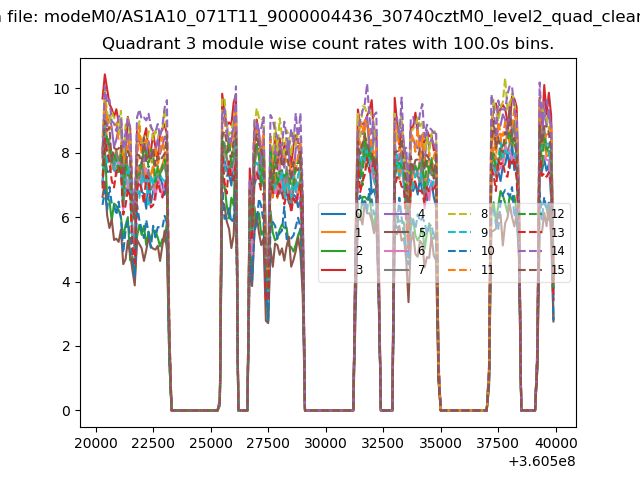
| Module-wise count rates for Quadrant C Data is divided into 100 sec bins |
 |
 |
| Module-wise count rates for Quadrant D Data is divided into 100 sec bins |
 |
 |
| Parameter | Plot |
|---|---|
| CZT HV Monitor | 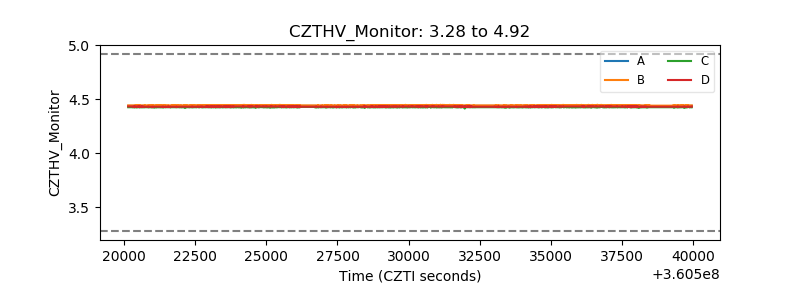 |
| D_VDD | 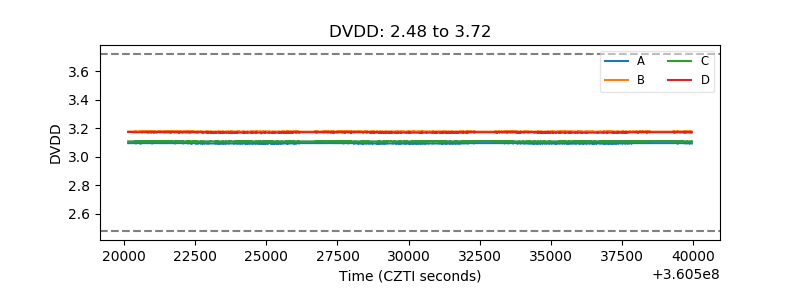 |
| Temperature 1 | 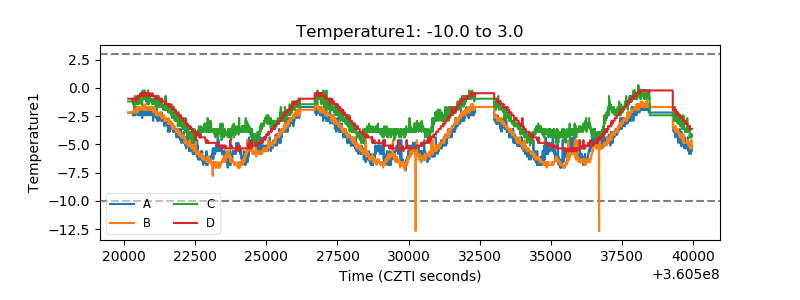 |
| Veto HV Monitor | 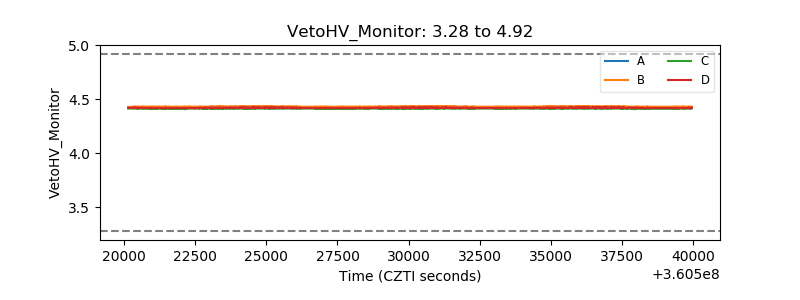 |
| Veto LLD |  |
| Alpha Counter | 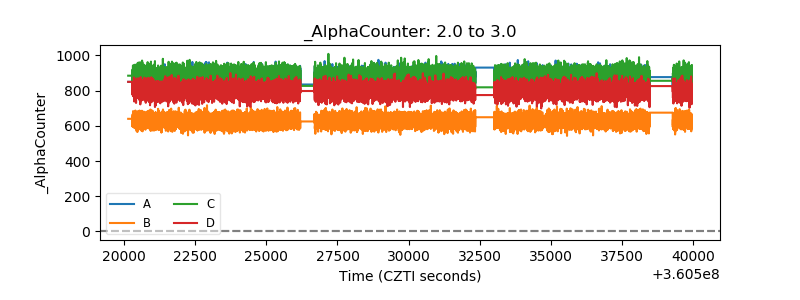 |
| _CPM_Rate | 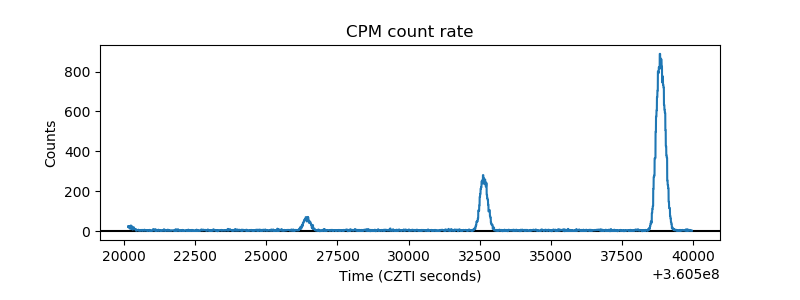 |
| CZT Counter | 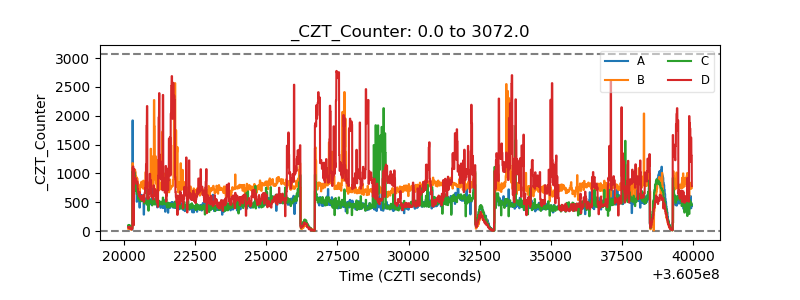 |
| +2.5 Volts monitor |  |
| +5 Volts monitor |  |
| _ROLL_ROT | 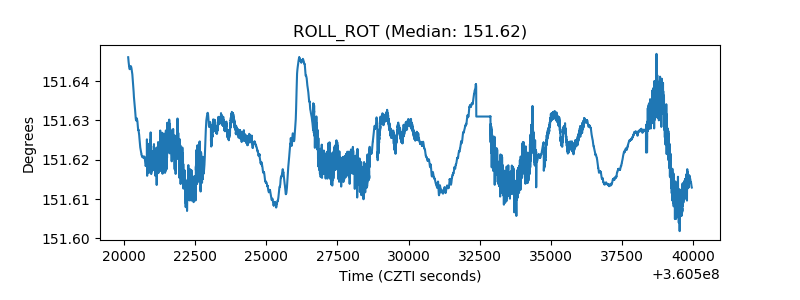 |
| _Roll_DEC | 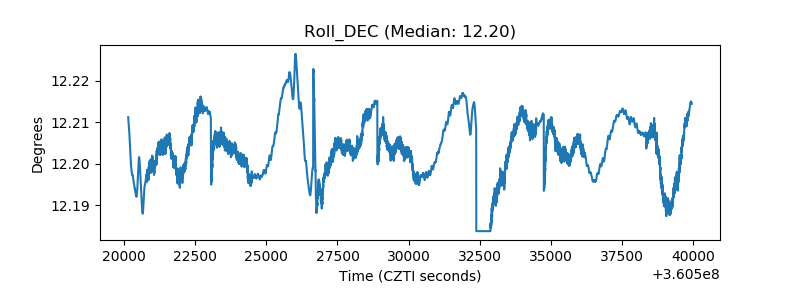 |
| _Roll_RA | 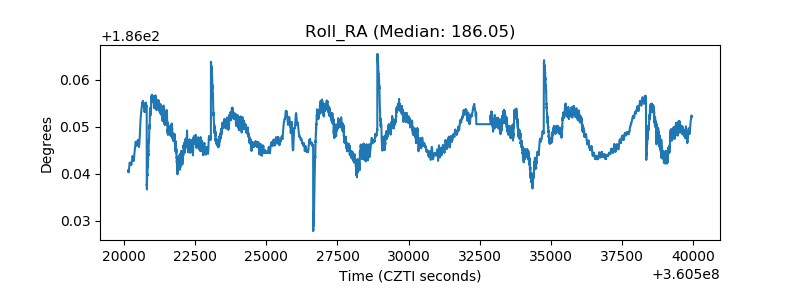 |
| Veto Counter |  |