| Param | Original file | Final file |
|---|---|---|
| Filename | modeM0/AS1A10_053T35_9000004438cztM0_level2.fits | modeM0/AS1A10_053T35_9000004438cztM0_level2_quad_clean.evt |
| Size (bytes) | 559,774,080 | 396,227,520 |
| Size | 533.8 MB | 377.9 MB |
| Events in quadrant A | 3,492,738 | 2,150,994 |
| Events in quadrant B | 3,260,836 | 2,134,497 |
| Events in quadrant C | 3,399,282 | 2,038,845 |
| Events in quadrant D | 3,009,788 | 1,883,889 |
| Mode M0 | |||
|---|---|---|---|
| Quadrant | BADHDUFLAG | Total packets | Discarded packets |
| A | 0 | 120503 | 0 |
| B | 0 | 172695 | 0 |
| C | 0 | 120855 | 0 |
| D | 0 | 148506 | 0 |
| Mode SS | |||
|---|---|---|---|
| Quadrant | BADHDUFLAG | Total packets | Discarded packets |
| A | 0 | 1122 | 0 |
| B | 0 | 1122 | 0 |
| C | 0 | 1122 | 0 |
| D | 0 | 1122 | 0 |
| Mode M9 | |||
|---|---|---|---|
| Quadrant | BADHDUFLAG | Total packets | Discarded packets |
| A | 0 | 88 | 0 |
| B | 0 | 88 | 0 |
| C | 0 | 88 | 0 |
| D | 0 | 88 | 0 |
| Quadrant | Total seconds | Saturated seconds | Saturation percentage |
|---|---|---|---|
| A | 55239 | 992 | 1.795833% |
| B | 55241 | 1834 | 3.319998% |
| C | 55241 | 1270 | 2.299017% |
| D | 55239 | 2121 | 3.839678% |
Noise dominated data is calculated using 1-second bins in cleaned event files. If a bin has >2000 counts, and if more than 50% of those come from <1% of pixels, then it is considered to be noise-dominated and hence unusable.
| Quadrant | # 1 sec bins | Bins with >0 counts | Bins with >2000 counts | High rate bins dominated by noise | Noise dominated (total time) | Noise dominated (detector-on time) | Marked lightcurve |
|---|---|---|---|---|---|---|---|
| A | 69366 | 55232 | 0 | 0 | 0.00% | 0.00% | 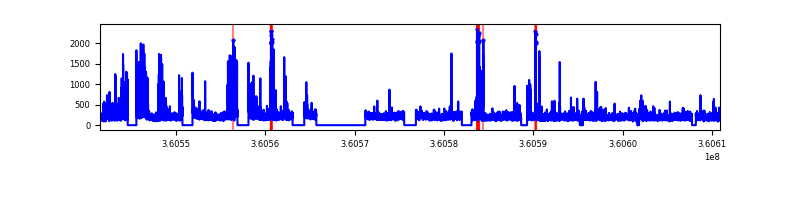 |
| B | 69366 | 55227 | 0 | 0 | 0.00% | 0.00% |  |
| C | 69365 | 55231 | 0 | 0 | 0.00% | 0.00% |  |
| D | 69366 | 55225 | 0 | 0 | 0.00% | 0.00% | 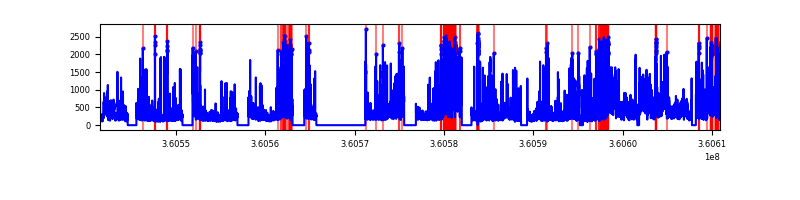 |
Top three noisy pixels from each quadrant. If the there are fewer than three noisy pixels in the level2.evt file, extra rows are filled as -1
| Pixel properties | Quadrant properties | ||||||
|---|---|---|---|---|---|---|---|
| Quadrant | DetID | PixID | Counts | Sigma | Mean | Median | Sigma |
| A | 7 | 110 | 2838 | 9.0 | 910 | 856 | 220.1 |
| A | 0 | 29 | 2774 | 8.71 | 910 | 856 | 220.1 |
| A | 9 | 19 | 2576 | 7.81 | 910 | 856 | 220.1 |
| B | 2 | 9 | 2639 | 10.73 | 862 | 822 | 169.3 |
| B | 5 | 128 | 2217 | 8.24 | 862 | 822 | 169.3 |
| B | 3 | 80 | 2208 | 8.19 | 862 | 822 | 169.3 |
| C | 1 | 81 | 2666 | 8.03 | 899 | 844 | 226.8 |
| C | 1 | 80 | 2634 | 7.89 | 899 | 844 | 226.8 |
| C | 3 | 187 | 2320 | 6.51 | 899 | 844 | 226.8 |
| D | 15 | 46 | 2225 | 6.36 | 858 | 784 | 226.6 |
| D | 10 | 189 | 2110 | 5.85 | 858 | 784 | 226.6 |
| D | 6 | 231 | 2096 | 5.79 | 858 | 784 | 226.6 |
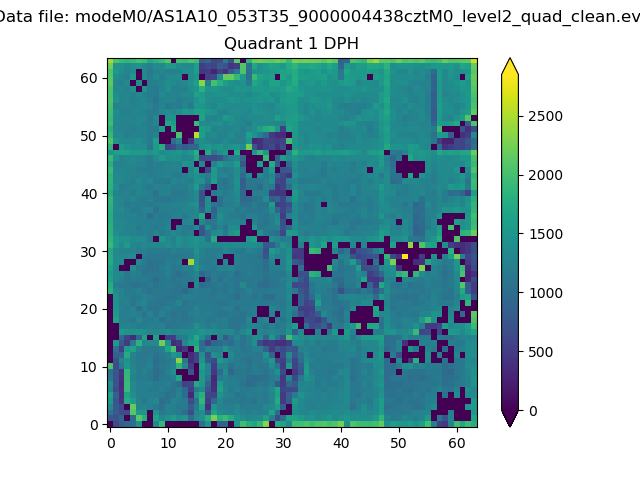
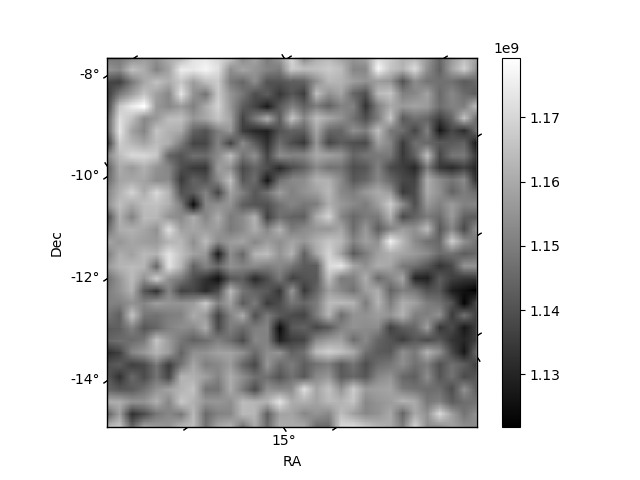
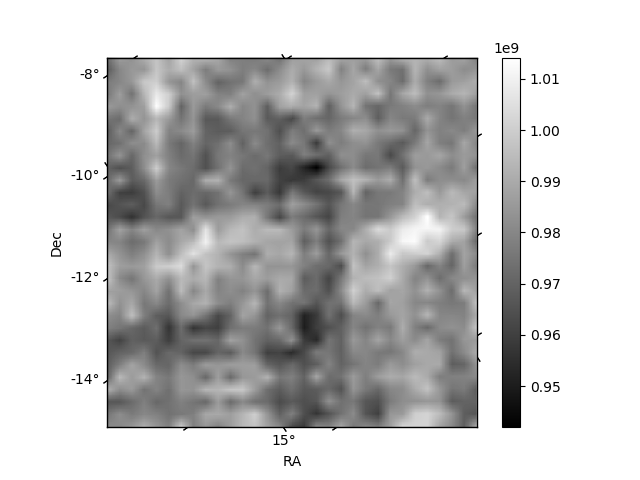
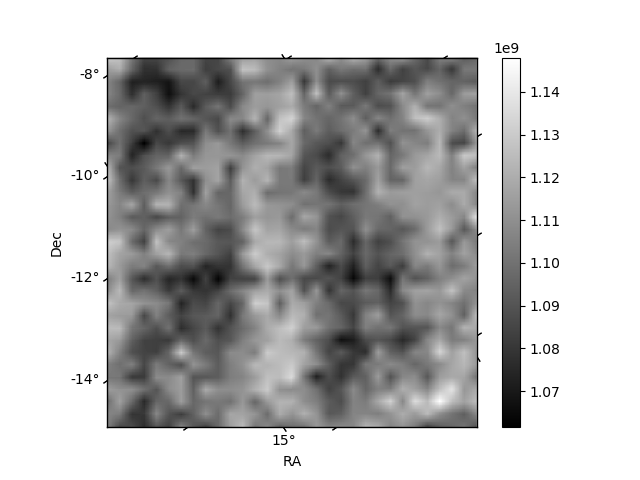
Histogram calculated using DETX and DETY for each event in the final _common_clean file
| Quadrant A |  |
 |
Quadrant B |
|---|---|---|---|
| Quadrant D | 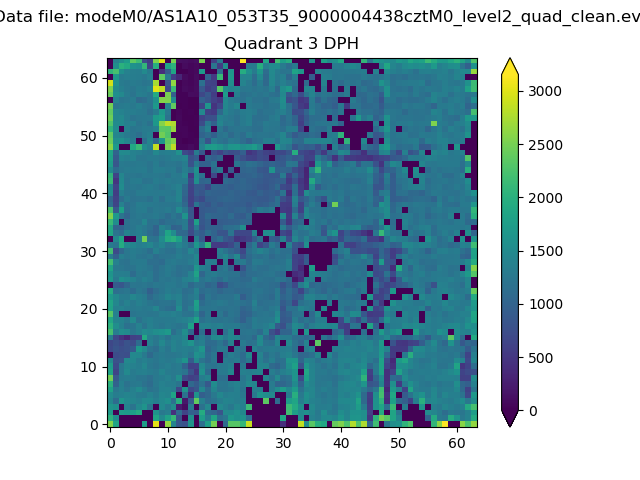 |
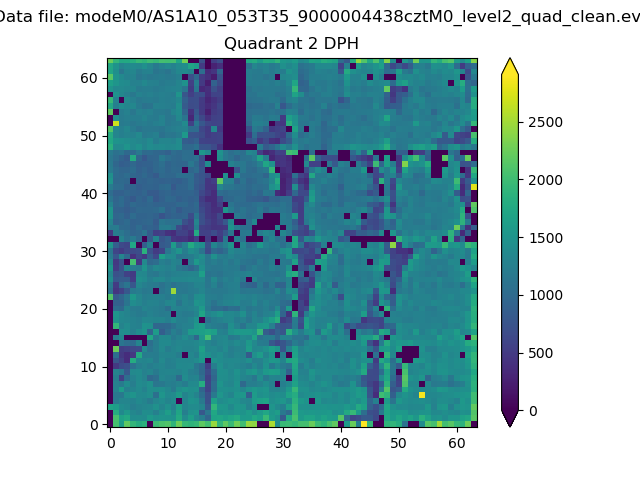 |
Quadrant C |
| Plot type | Count rate plots | Images |
|---|---|---|
| Comparison with Poisson distribution Blue bars denote a histogram of data divided into 1 sec bins. Red curve is a Poisson curve with rate = median count rate of data. |
 |
 |
| Quadrant-wise count rates Data is divided into 100 sec bins |
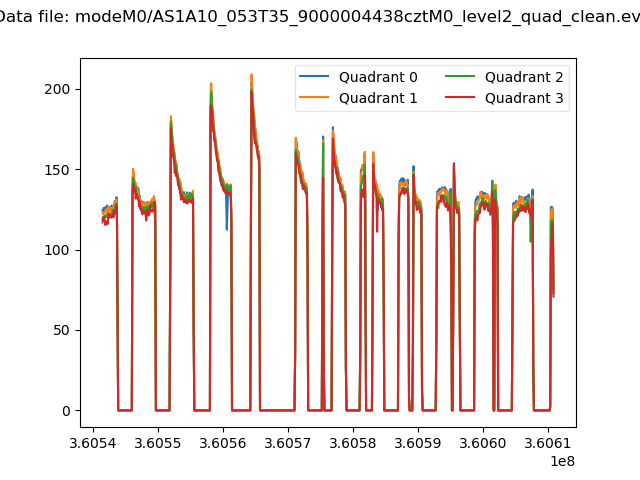 |
|
| Module-wise count rates for Quadrant A Data is divided into 100 sec bins |
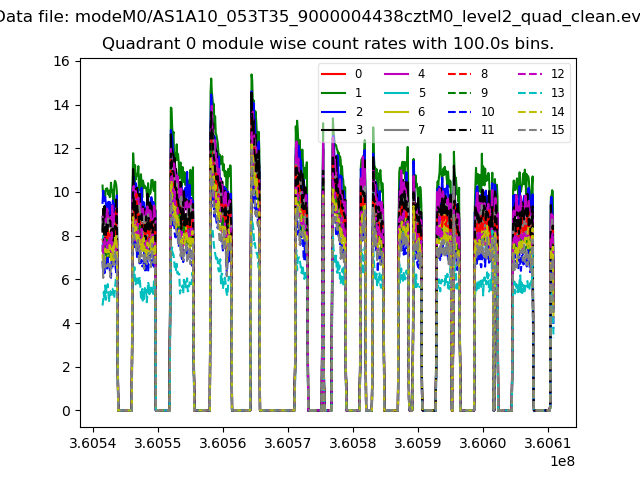 |
 |
| Module-wise count rates for Quadrant B Data is divided into 100 sec bins |
 |
 |
| Module-wise count rates for Quadrant C Data is divided into 100 sec bins |
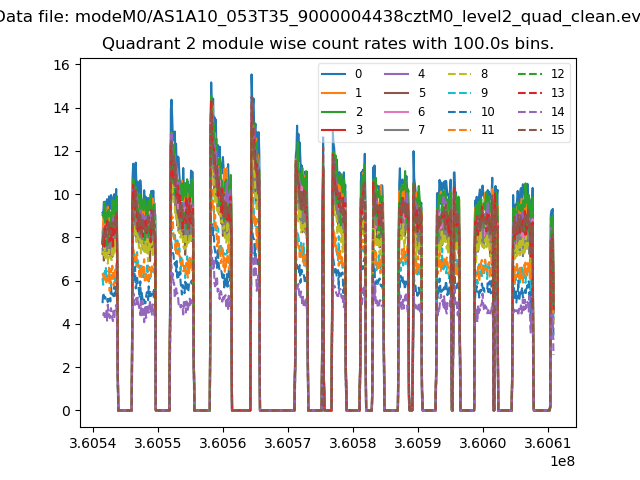 |
 |
| Module-wise count rates for Quadrant D Data is divided into 100 sec bins |
 |
 |
| Parameter | Plot |
|---|---|
| CZT HV Monitor | 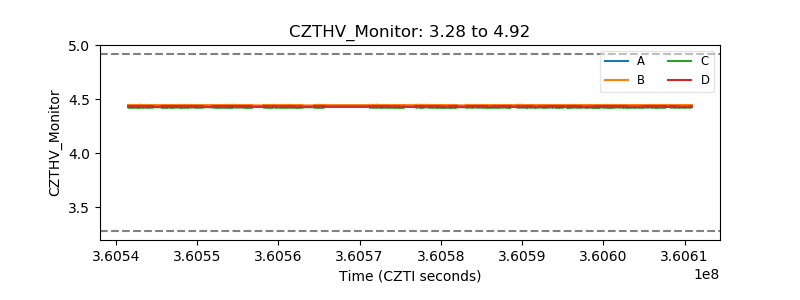 |
| D_VDD |  |
| Temperature 1 |  |
| Veto HV Monitor |  |
| Veto LLD |  |
| Alpha Counter | 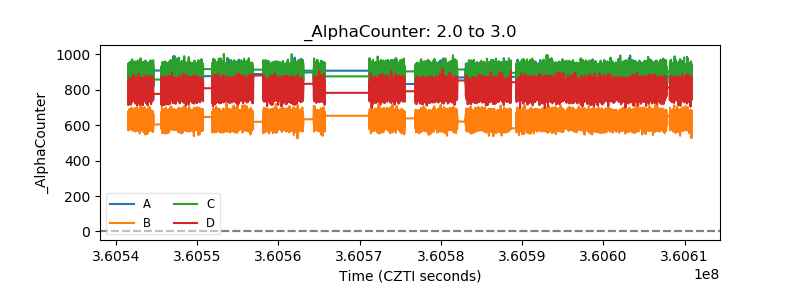 |
| _CPM_Rate | 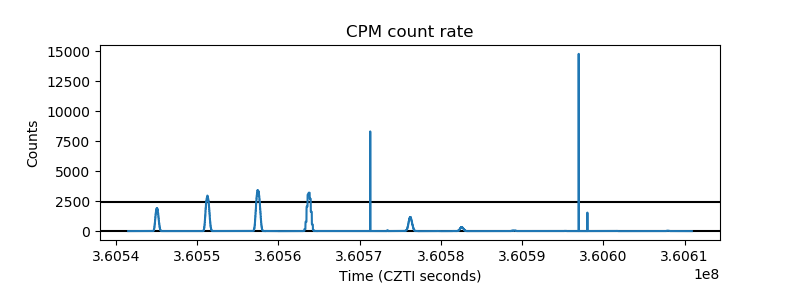 |
| CZT Counter | 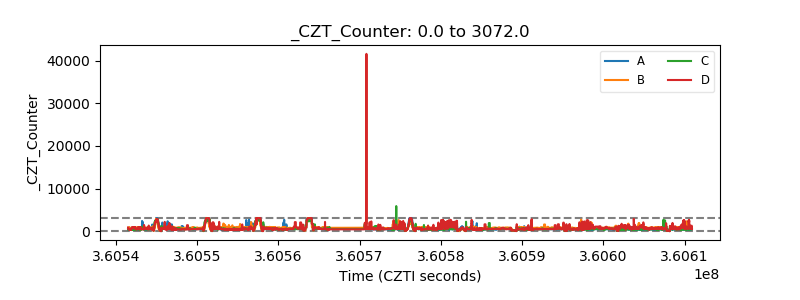 |
| +2.5 Volts monitor |  |
| +5 Volts monitor |  |
| _ROLL_ROT | 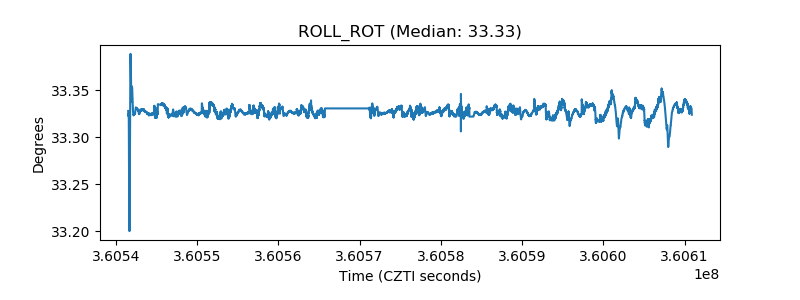 |
| _Roll_DEC |  |
| _Roll_RA | 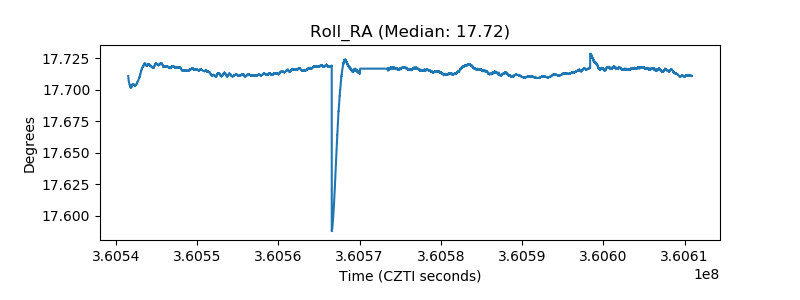 |
| Veto Counter |  |