| Param | Original file | Final file |
|---|---|---|
| Filename | modeM0/AS1A10_053T35_9000004438_30740cztM0_level2.evt | modeM0/AS1A10_053T35_9000004438_30740cztM0_level2_quad_clean.evt |
| Size (bytes) | 387,855,360 | 66,288,960 |
| Size | 369.9 MB | 63.2 MB |
| Events in quadrant A | 2,668,382 | 429,136 |
| Events in quadrant B | 3,568,496 | 430,145 |
| Events in quadrant C | 2,414,482 | 416,408 |
| Events in quadrant D | 2,784,798 | 410,790 |
| Mode M0 | |||
|---|---|---|---|
| Quadrant | BADHDUFLAG | Total packets | Discarded packets |
| A | 0 | 11006 | 1 |
| B | 0 | 13841 | 1 |
| C | 0 | 10092 | 3 |
| D | 0 | 11111 | 1 |
| Mode SS | |||
|---|---|---|---|
| Quadrant | BADHDUFLAG | Total packets | Discarded packets |
| A | 0 | 94 | 0 |
| B | 0 | 94 | 0 |
| C | 0 | 94 | 0 |
| D | 0 | 94 | 0 |
| Mode M9 | |||
|---|---|---|---|
| Quadrant | BADHDUFLAG | Total packets | Discarded packets |
| A | 0 | 10 | 0 |
| B | 0 | 10 | 0 |
| C | 0 | 10 | 0 |
| D | 0 | 10 | 0 |
| Quadrant | Total seconds | Saturated seconds | Saturation percentage |
|---|---|---|---|
| A | 4561 | 86 | 1.885551% |
| B | 4561 | 83 | 1.819776% |
| C | 4560 | 97 | 2.127193% |
| D | 4560 | 49 | 1.074561% |
Noise dominated data is calculated using 1-second bins in cleaned event files. If a bin has >2000 counts, and if more than 50% of those come from <1% of pixels, then it is considered to be noise-dominated and hence unusable.
| Quadrant | # 1 sec bins | Bins with >0 counts | Bins with >2000 counts | High rate bins dominated by noise | Noise dominated (total time) | Noise dominated (detector-on time) | Marked lightcurve |
|---|---|---|---|---|---|---|---|
| A | 5541 | 4561 | 24 | 24 | 0.43% | 0.53% | 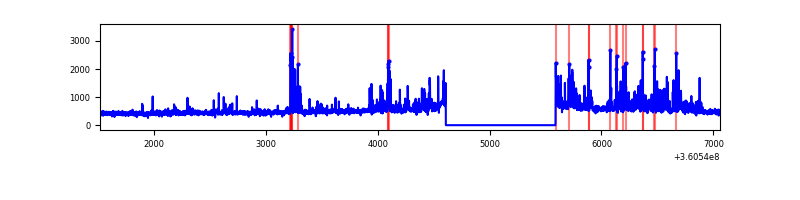 |
| B | 5541 | 4561 | 0 | 0 | 0.00% | 0.00% | 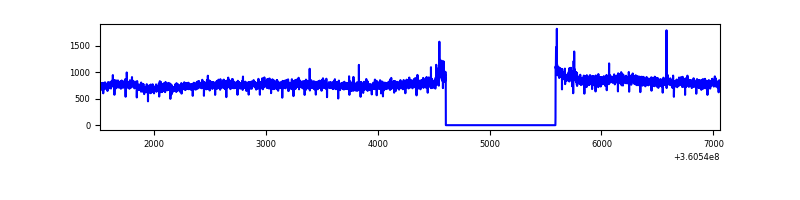 |
| C | 5540 | 4560 | 3 | 3 | 0.05% | 0.07% | 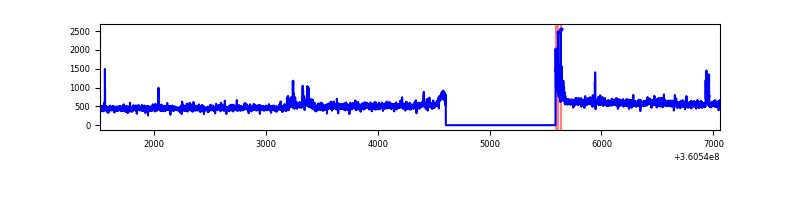 |
| D | 5540 | 4560 | 5 | 5 | 0.09% | 0.11% | 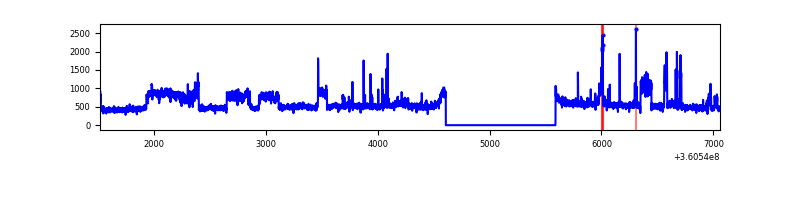 |
Top three noisy pixels from each quadrant. If the there are fewer than three noisy pixels in the level2.evt file, extra rows are filled as -1
| Pixel properties | Quadrant properties | ||||||
|---|---|---|---|---|---|---|---|
| Quadrant | DetID | PixID | Counts | Sigma | Mean | Median | Sigma |
| A | 0 | 13 | 446008 | 3816.3 | 572 | 559 | 116.7 |
| A | 13 | 254 | 8433 | 67.46 | 572 | 559 | 116.7 |
| A | 8 | 192 | 8296 | 66.29 | 572 | 559 | 116.7 |
| B | 6 | 159 | 1309863 | 11913.09 | 567 | 554 | 109.9 |
| B | 12 | 111 | 13569 | 118.42 | 567 | 554 | 109.9 |
| B | 11 | 111 | 12463 | 108.36 | 567 | 554 | 109.9 |
| C | 3 | 233 | 113453 | 859.61 | 553 | 558 | 131.3 |
| C | 14 | 238 | 94050 | 711.87 | 553 | 558 | 131.3 |
| C | 0 | 10 | 32560 | 243.67 | 553 | 558 | 131.3 |
| D | 8 | 195 | 608248 | 4381.55 | 559 | 544 | 138.7 |
| D | 2 | 250 | 36529 | 259.45 | 559 | 544 | 138.7 |
| D | 2 | 234 | 19215 | 134.62 | 559 | 544 | 138.7 |
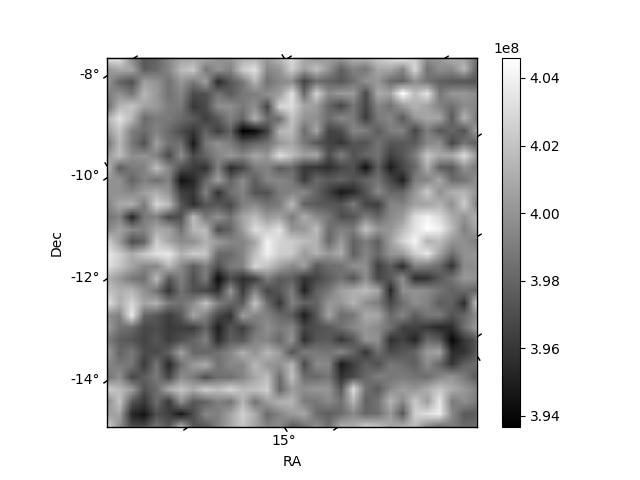
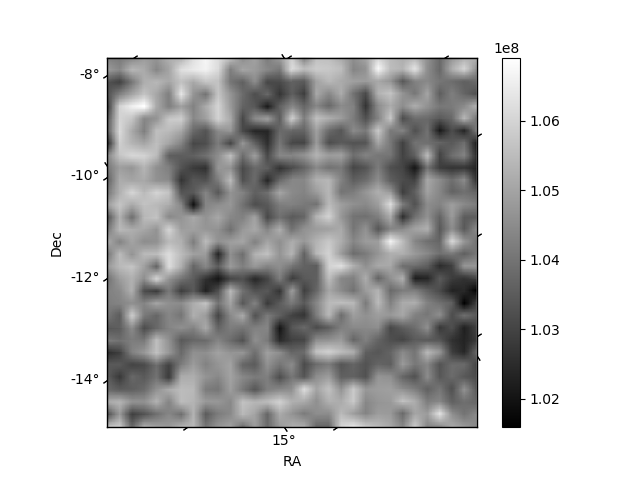
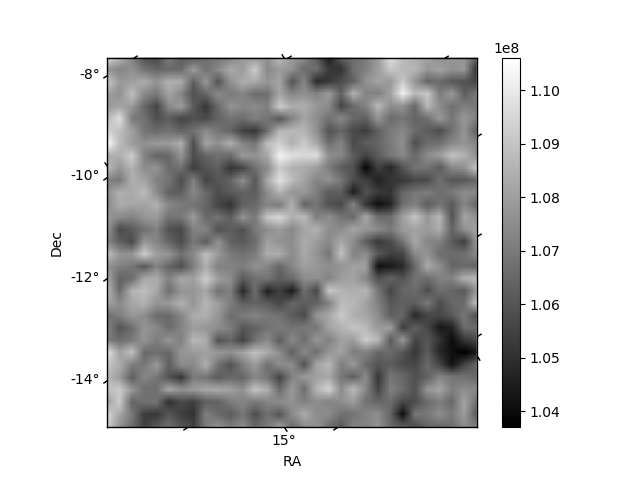
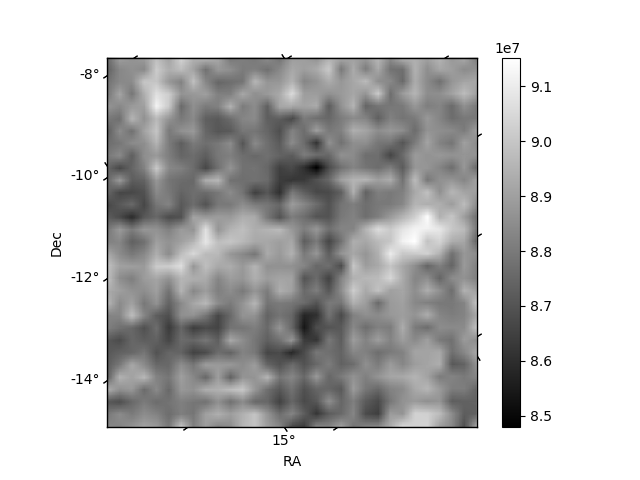
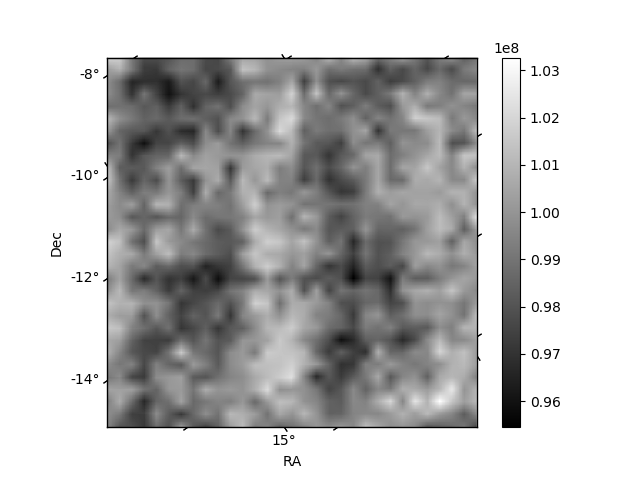
Histogram calculated using DETX and DETY for each event in the final _common_clean file
| Quadrant A | 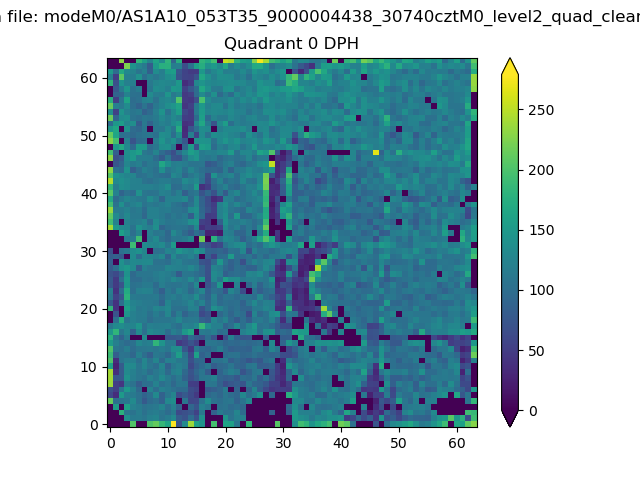 |
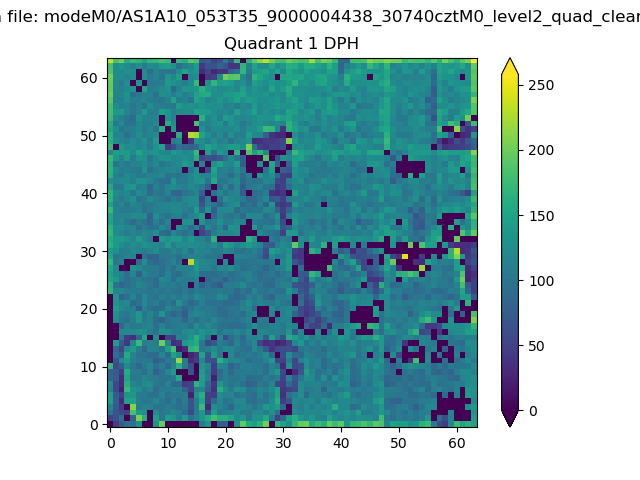 |
Quadrant B |
|---|---|---|---|
| Quadrant D | 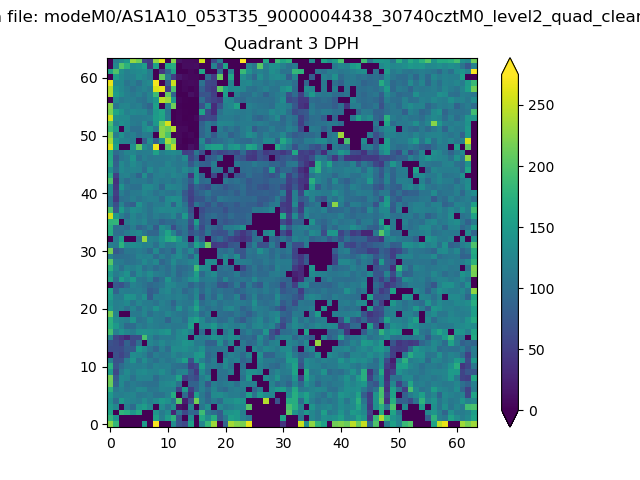 |
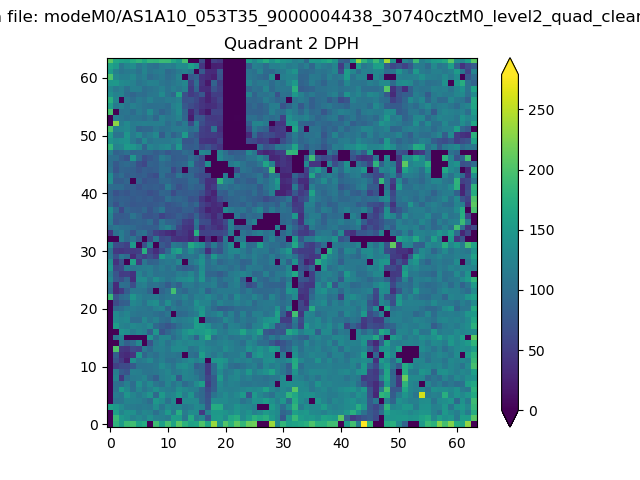 |
Quadrant C |
| Plot type | Count rate plots | Images |
|---|---|---|
| Comparison with Poisson distribution Blue bars denote a histogram of data divided into 1 sec bins. Red curve is a Poisson curve with rate = median count rate of data. |
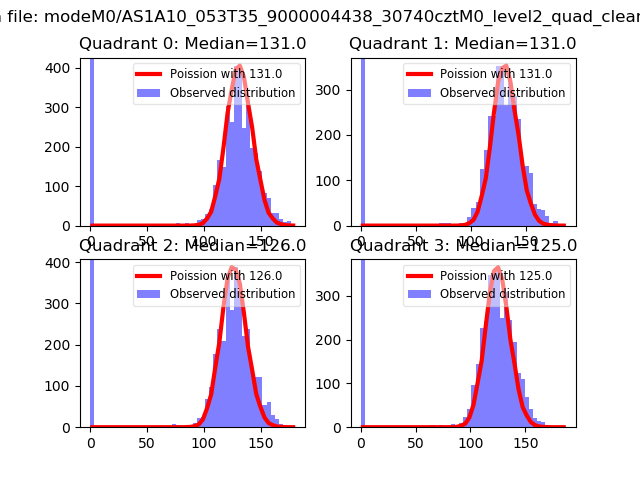 |
 |
| Quadrant-wise count rates Data is divided into 100 sec bins |
 |
|
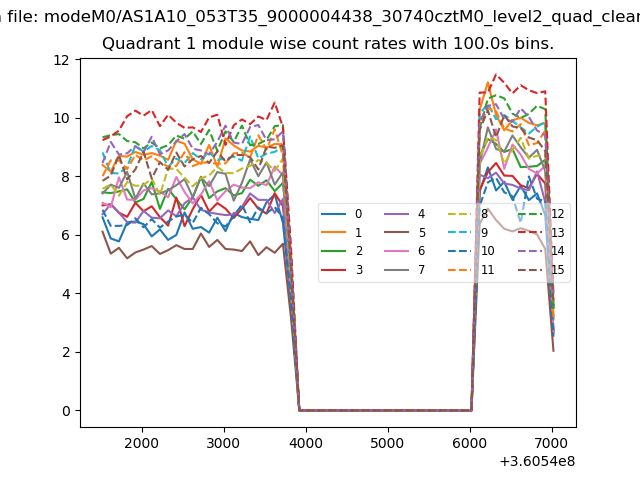
| Module-wise count rates for Quadrant A Data is divided into 100 sec bins |
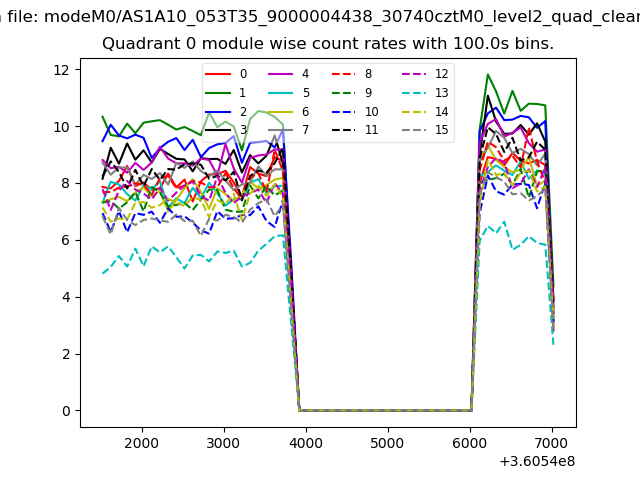 |
 |
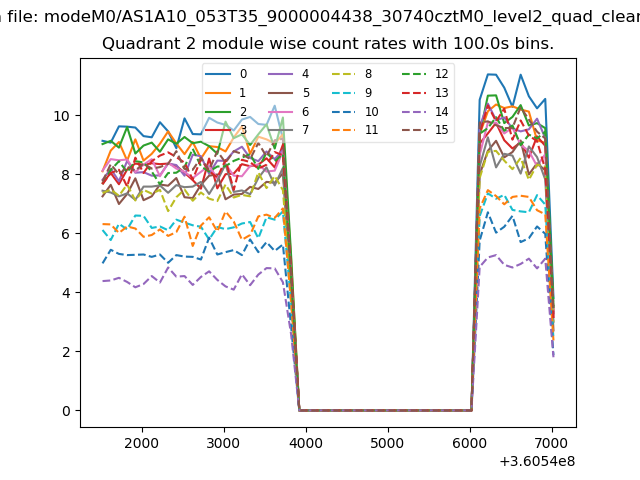
| Module-wise count rates for Quadrant B Data is divided into 100 sec bins |
 |
 |
| Module-wise count rates for Quadrant C Data is divided into 100 sec bins |
 |
 |
| Module-wise count rates for Quadrant D Data is divided into 100 sec bins |
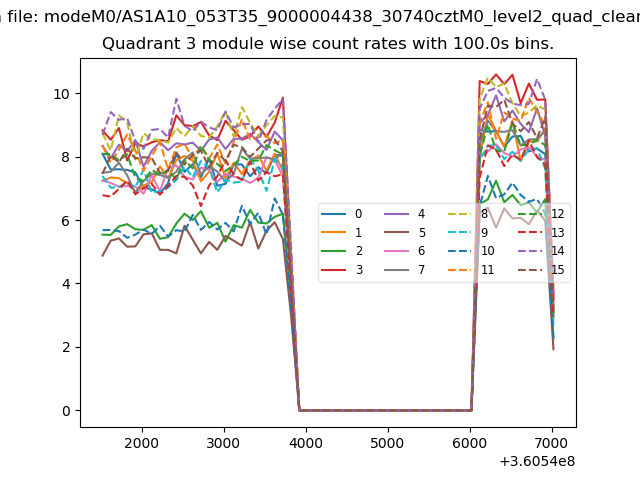 |
 |
| Parameter | Plot |
|---|---|
| CZT HV Monitor | 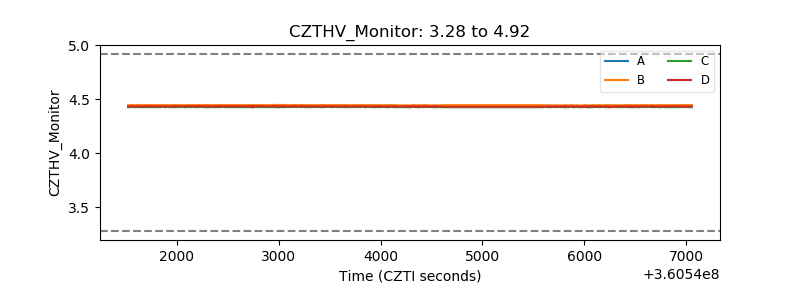 |
| D_VDD | 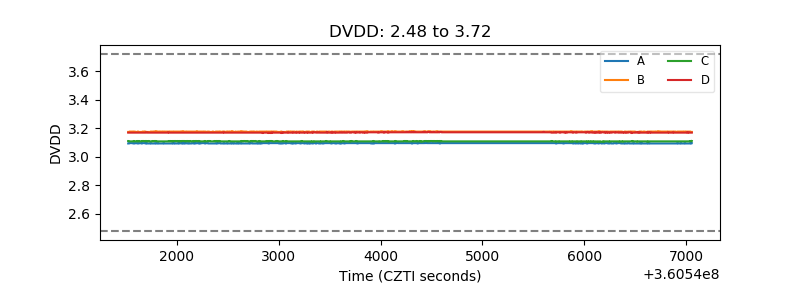 |
| Temperature 1 | 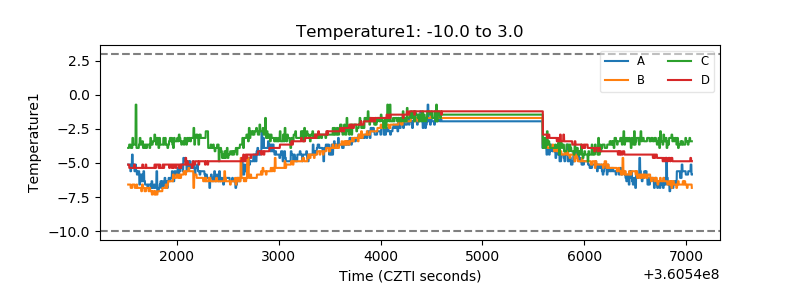 |
| Veto HV Monitor | 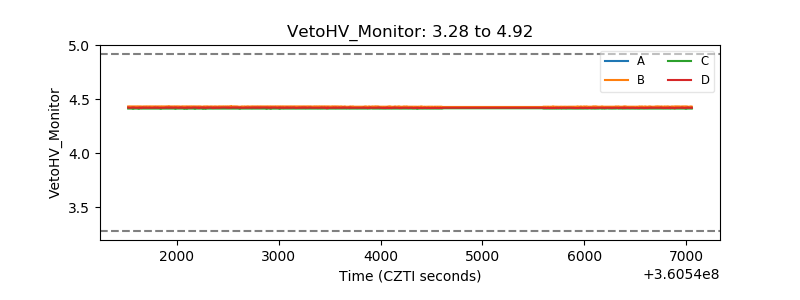 |
| Veto LLD | 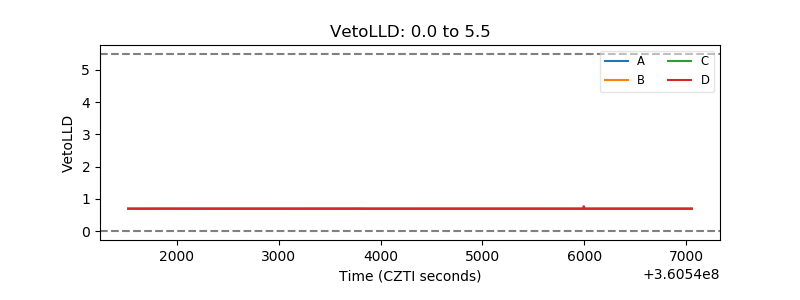 |
| Alpha Counter |  |
| _CPM_Rate | 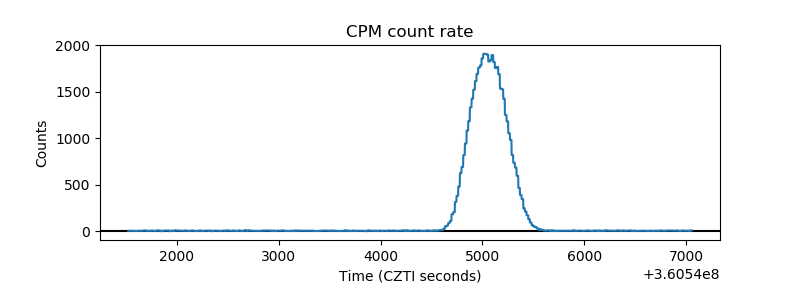 |
| CZT Counter | 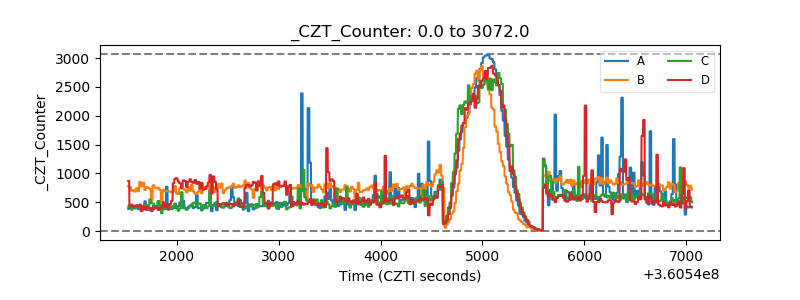 |
| +2.5 Volts monitor |  |
| +5 Volts monitor |  |
| _ROLL_ROT | 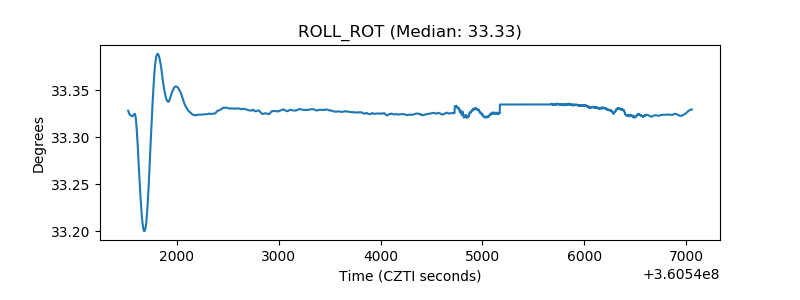 |
| _Roll_DEC | 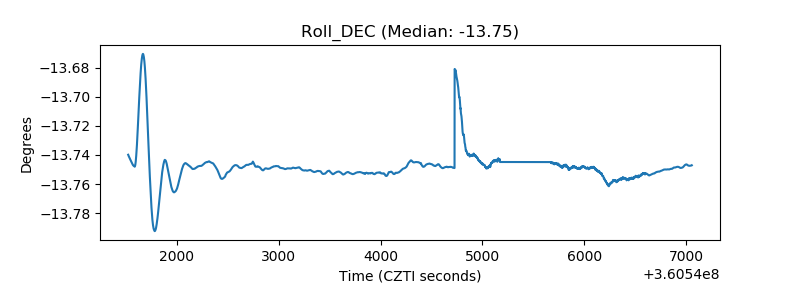 |
| _Roll_RA | 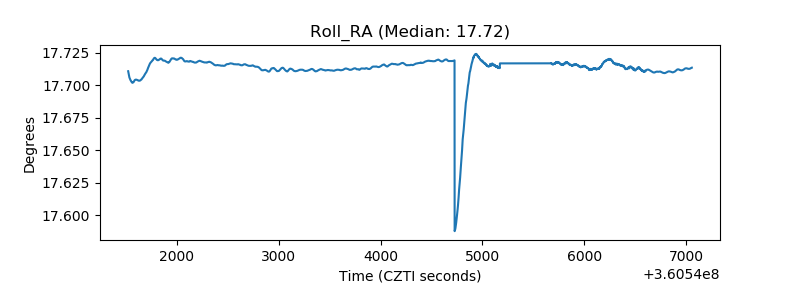 |
| Veto Counter | 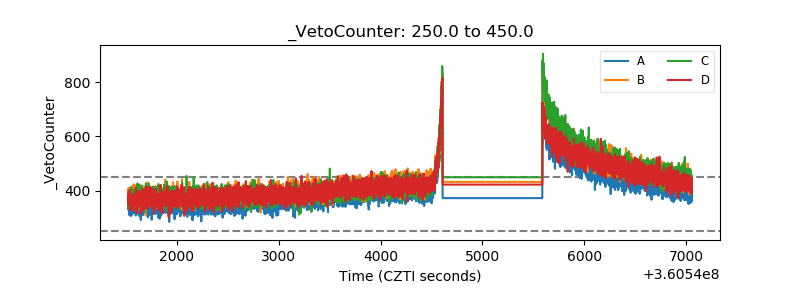 |