| Param | Original file | Final file |
|---|---|---|
| Filename | modeM0/AS1A10_053T35_9000004438_30742cztM0_level2.evt | modeM0/AS1A10_053T35_9000004438_30742cztM0_level2_quad_clean.evt |
| Size (bytes) | 551,986,560 | 101,934,720 |
| Size | 526.4 MB | 97.2 MB |
| Events in quadrant A | 3,638,775 | 665,090 |
| Events in quadrant B | 5,179,735 | 673,673 |
| Events in quadrant C | 3,591,232 | 655,198 |
| Events in quadrant D | 3,872,013 | 644,808 |
| Mode M0 | |||
|---|---|---|---|
| Quadrant | BADHDUFLAG | Total packets | Discarded packets |
| A | 0 | 14984 | 2 |
| B | 0 | 19685 | 2 |
| C | 0 | 14681 | 2 |
| D | 0 | 15755 | 2 |
| Mode SS | |||
|---|---|---|---|
| Quadrant | BADHDUFLAG | Total packets | Discarded packets |
| A | 0 | 130 | 0 |
| B | 0 | 130 | 0 |
| C | 0 | 130 | 0 |
| D | 0 | 130 | 0 |
| Mode M9 | |||
|---|---|---|---|
| Quadrant | BADHDUFLAG | Total packets | Discarded packets |
| A | 0 | 12 | 0 |
| B | 0 | 12 | 0 |
| C | 0 | 12 | 0 |
| D | 0 | 12 | 0 |
| Quadrant | Total seconds | Saturated seconds | Saturation percentage |
|---|---|---|---|
| A | 6429 | 66 | 1.026598% |
| B | 6429 | 70 | 1.088816% |
| C | 6429 | 151 | 2.348732% |
| D | 6429 | 174 | 2.706486% |
Noise dominated data is calculated using 1-second bins in cleaned event files. If a bin has >2000 counts, and if more than 50% of those come from <1% of pixels, then it is considered to be noise-dominated and hence unusable.
| Quadrant | # 1 sec bins | Bins with >0 counts | Bins with >2000 counts | High rate bins dominated by noise | Noise dominated (total time) | Noise dominated (detector-on time) | Marked lightcurve |
|---|---|---|---|---|---|---|---|
| A | 7559 | 6429 | 27 | 27 | 0.36% | 0.42% | 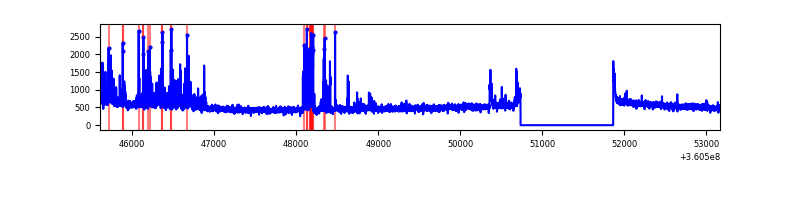 |
| B | 7559 | 6429 | 3 | 3 | 0.04% | 0.05% | 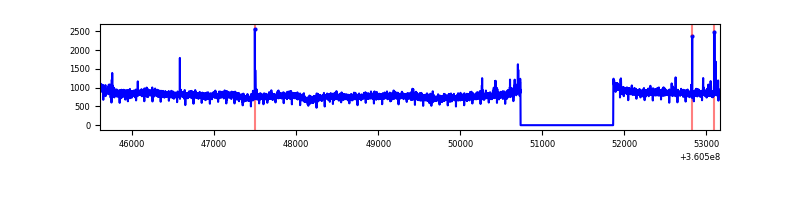 |
| C | 7559 | 6429 | 3 | 3 | 0.04% | 0.05% | 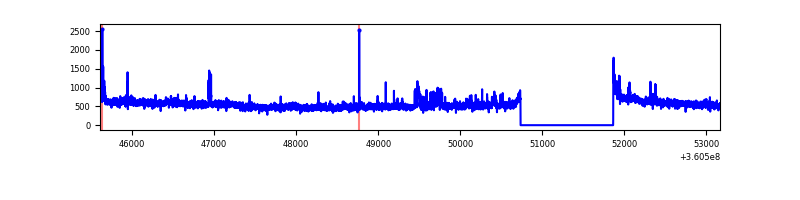 |
| D | 7559 | 6430 | 150 | 150 | 1.98% | 2.33% | 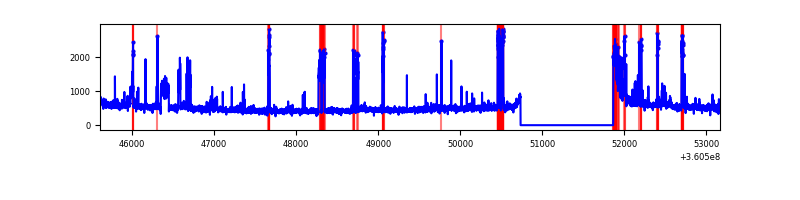 |
Top three noisy pixels from each quadrant. If the there are fewer than three noisy pixels in the level2.evt file, extra rows are filled as -1
| Pixel properties | Quadrant properties | ||||||
|---|---|---|---|---|---|---|---|
| Quadrant | DetID | PixID | Counts | Sigma | Mean | Median | Sigma |
| A | 0 | 13 | 422347 | 2514.77 | 829 | 813 | 167.6 |
| A | 8 | 192 | 15770 | 89.23 | 829 | 813 | 167.6 |
| A | 13 | 254 | 12270 | 68.35 | 829 | 813 | 167.6 |
| B | 6 | 159 | 1874269 | 11873.74 | 827 | 808 | 157.8 |
| B | 15 | 33 | 21891 | 133.62 | 827 | 808 | 157.8 |
| B | 12 | 111 | 19334 | 117.42 | 827 | 808 | 157.8 |
| C | 3 | 233 | 190706 | 1005.65 | 808 | 815 | 188.8 |
| C | 14 | 238 | 156333 | 823.62 | 808 | 815 | 188.8 |
| C | 0 | 10 | 37954 | 196.69 | 808 | 815 | 188.8 |
| D | 8 | 195 | 392940 | 1891.71 | 805 | 791 | 207.3 |
| D | 12 | 227 | 175690 | 843.7 | 805 | 791 | 207.3 |
| D | 13 | 174 | 156751 | 752.34 | 805 | 791 | 207.3 |
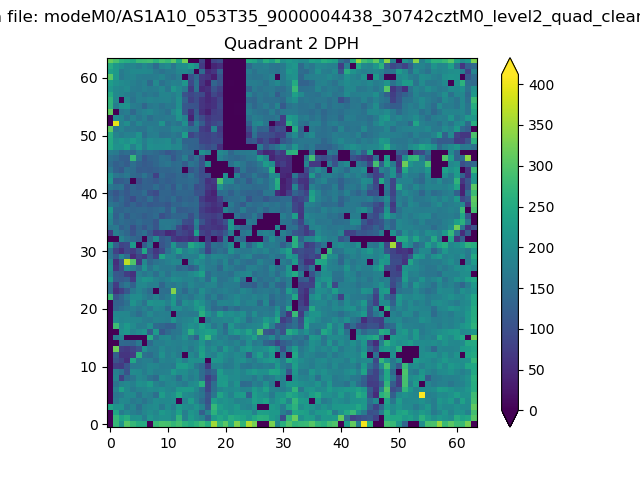
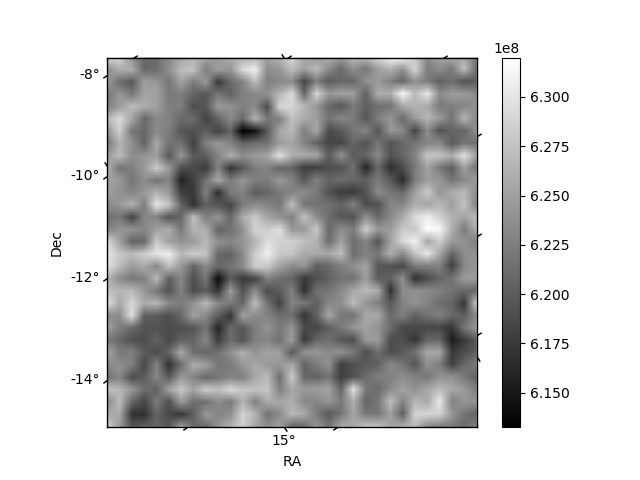
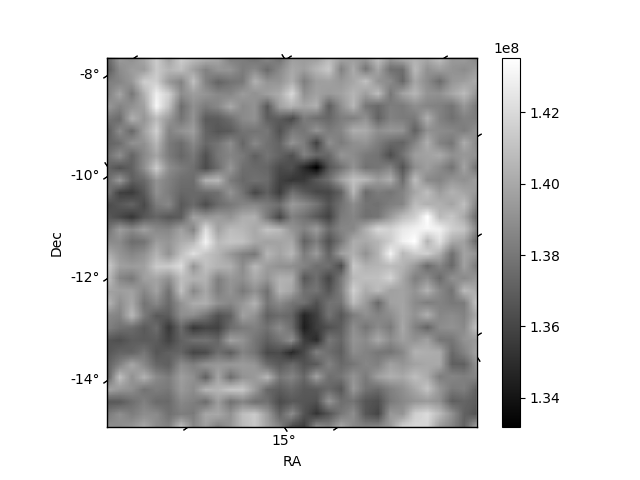
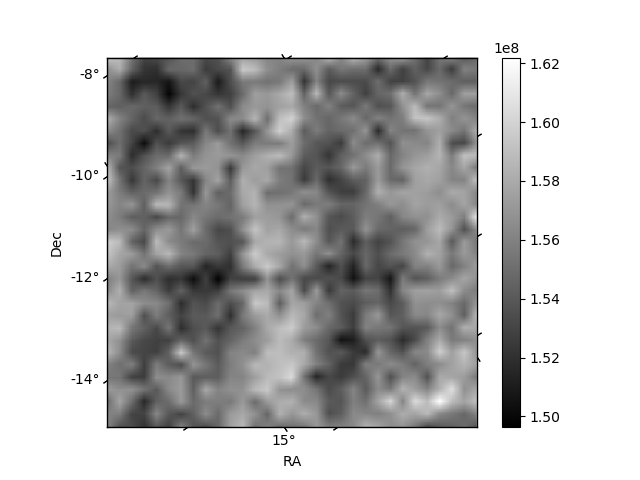
Histogram calculated using DETX and DETY for each event in the final _common_clean file
| Quadrant A | 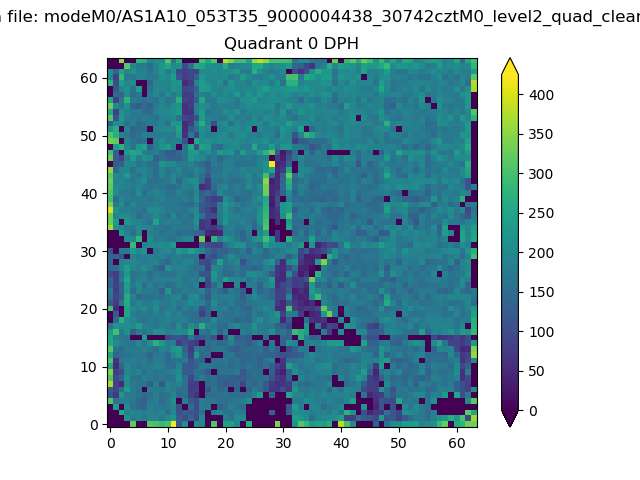 |
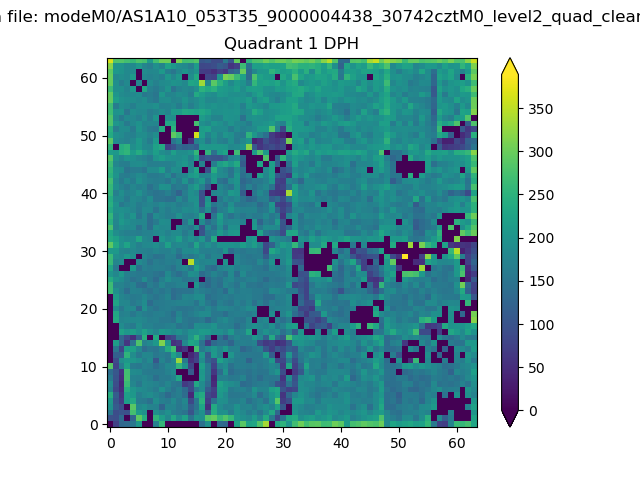 |
Quadrant B |
|---|---|---|---|
| Quadrant D | 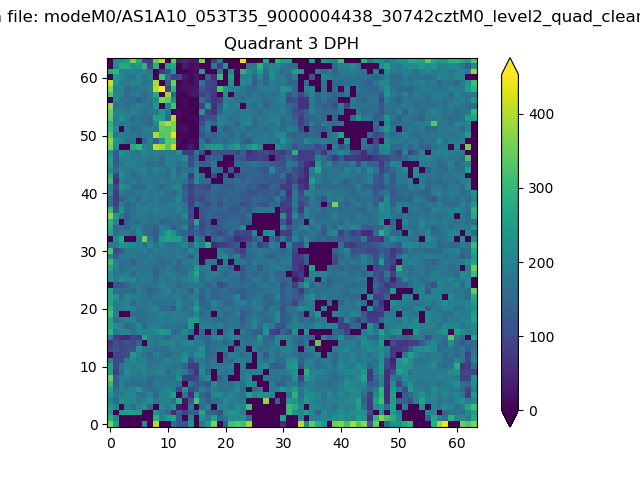 |
 |
Quadrant C |
| Plot type | Count rate plots | Images |
|---|---|---|
| Comparison with Poisson distribution Blue bars denote a histogram of data divided into 1 sec bins. Red curve is a Poisson curve with rate = median count rate of data. |
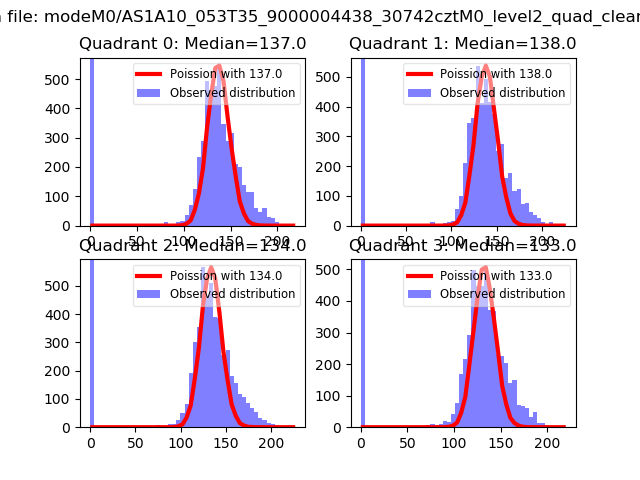 |
 |
| Quadrant-wise count rates Data is divided into 100 sec bins |
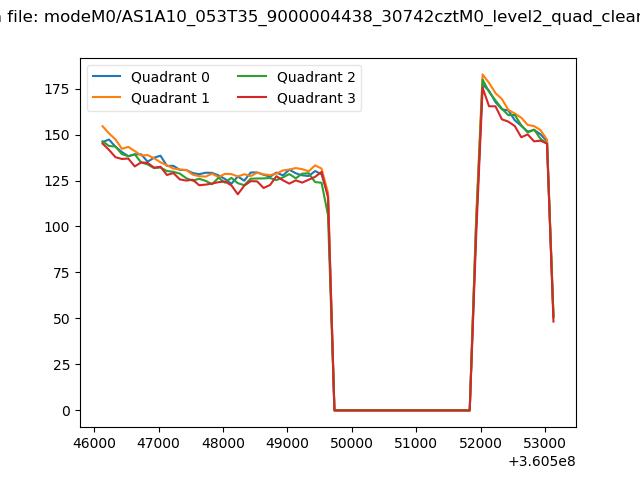 |
|
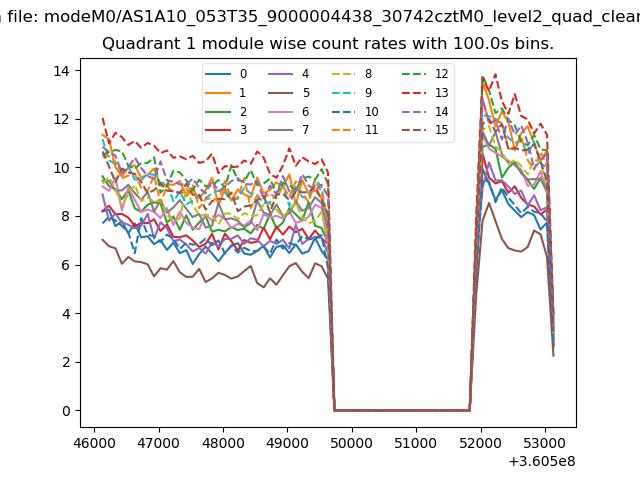
| Module-wise count rates for Quadrant A Data is divided into 100 sec bins |
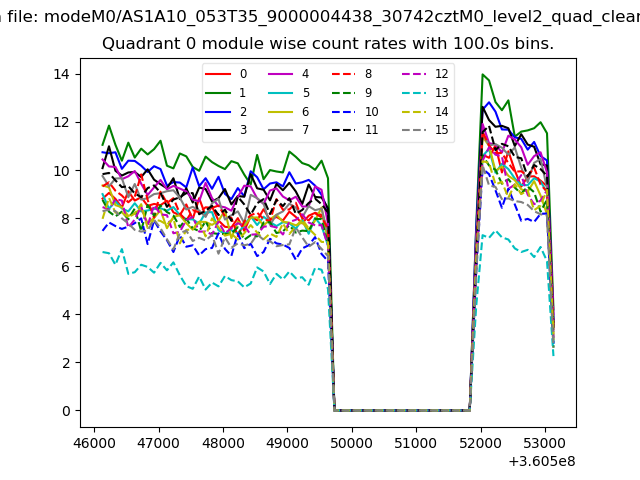 |
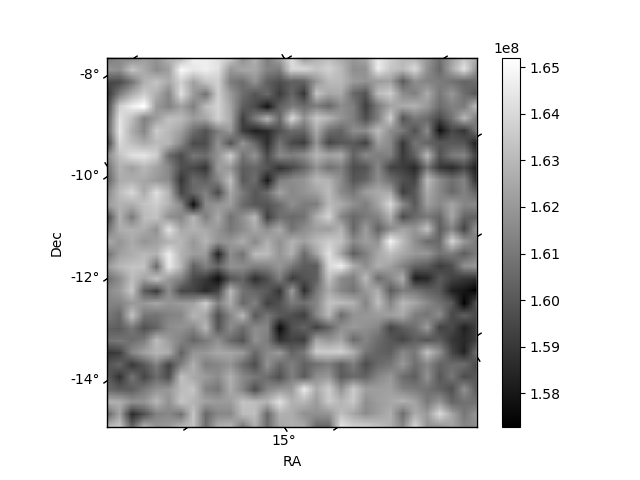 |
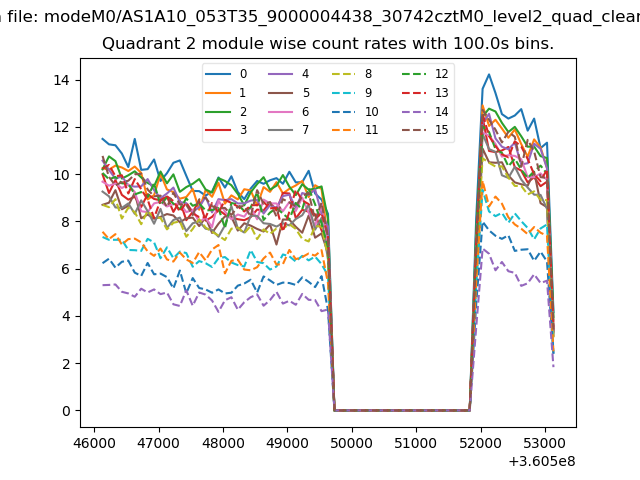
| Module-wise count rates for Quadrant B Data is divided into 100 sec bins |
 |
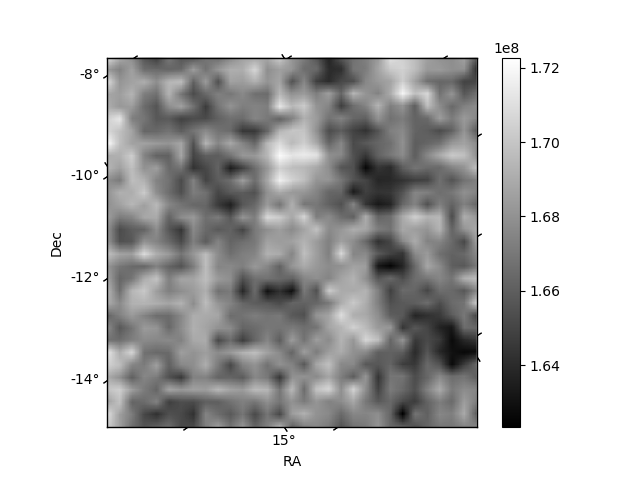 |
| Module-wise count rates for Quadrant C Data is divided into 100 sec bins |
 |
 |
| Module-wise count rates for Quadrant D Data is divided into 100 sec bins |
 |
 |
| Parameter | Plot |
|---|---|
| CZT HV Monitor | 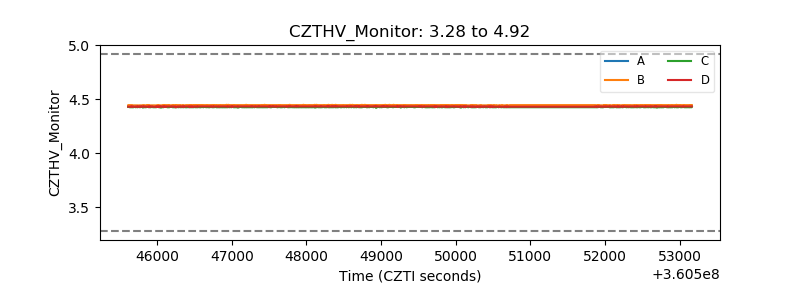 |
| D_VDD | 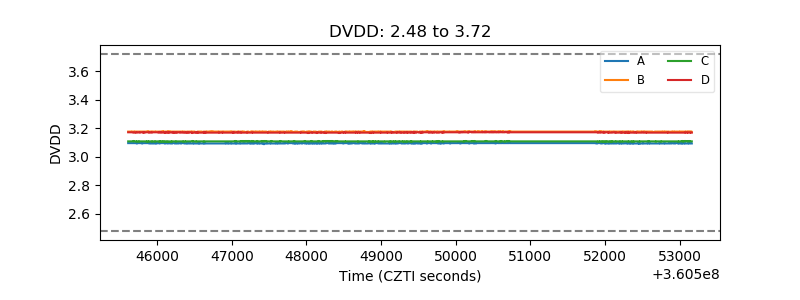 |
| Temperature 1 | 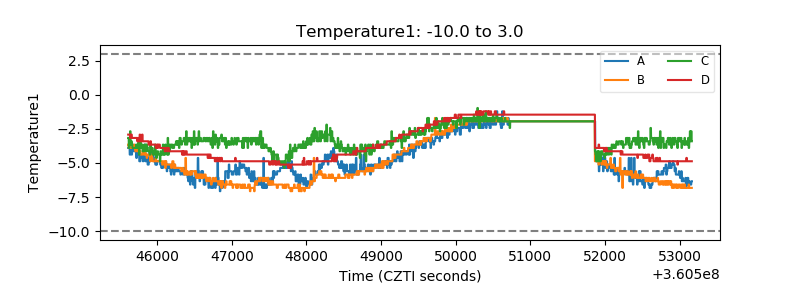 |
| Veto HV Monitor | 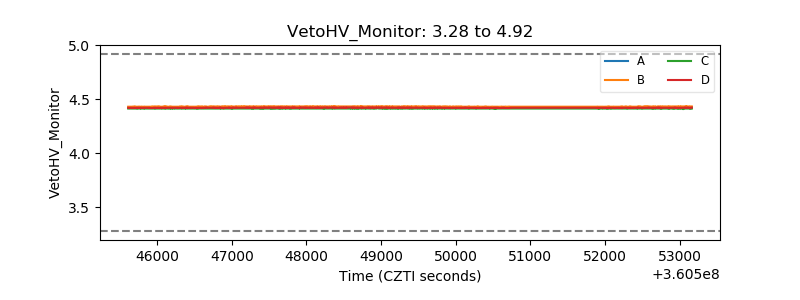 |
| Veto LLD | 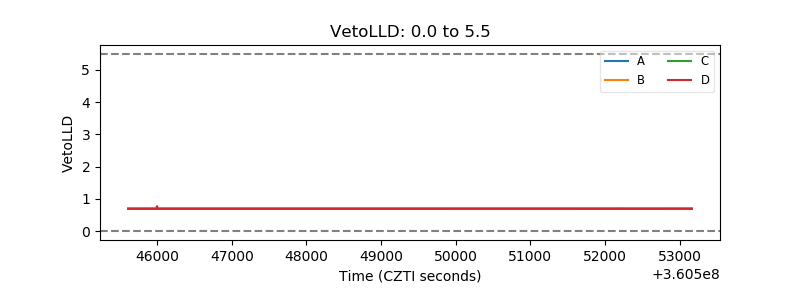 |
| Alpha Counter |  |
| _CPM_Rate |  |
| CZT Counter | 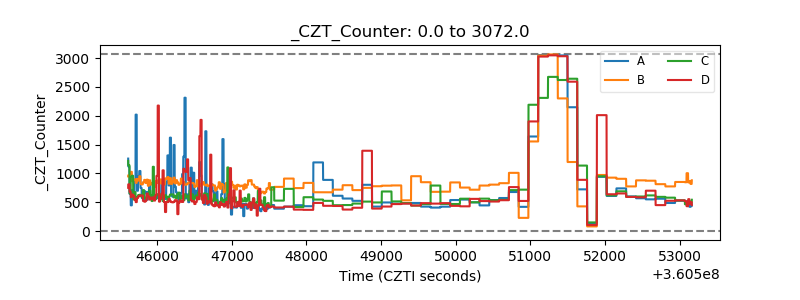 |
| +2.5 Volts monitor |  |
| +5 Volts monitor |  |
| _ROLL_ROT | 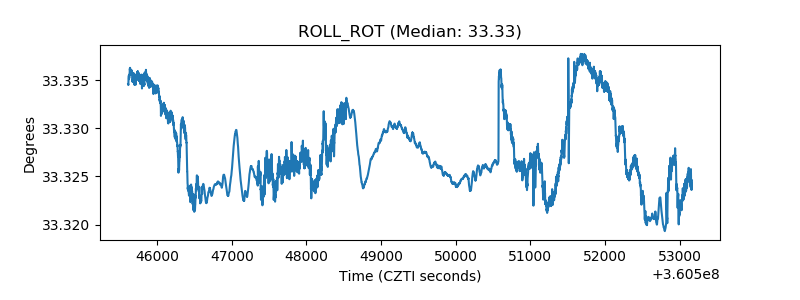 |
| _Roll_DEC | 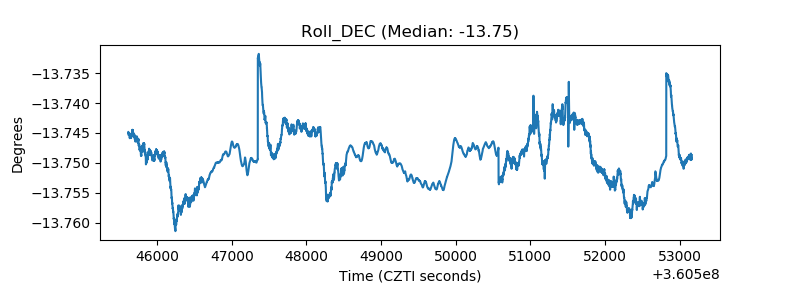 |
| _Roll_RA | 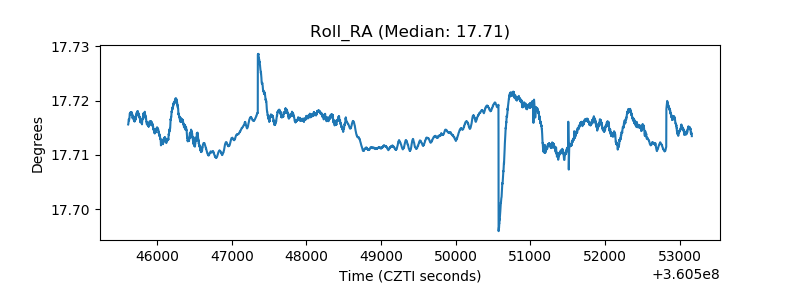 |
| Veto Counter |  |