| Param | Original file | Final file |
|---|---|---|
| Filename | modeM0/AS1A10_053T35_9000004438_30743cztM0_level2.evt | modeM0/AS1A10_053T35_9000004438_30743cztM0_level2_quad_clean.evt |
| Size (bytes) | 543,738,240 | 111,657,600 |
| Size | 518.5 MB | 106.5 MB |
| Events in quadrant A | 3,617,233 | 737,230 |
| Events in quadrant B | 5,399,882 | 748,149 |
| Events in quadrant C | 3,490,016 | 735,471 |
| Events in quadrant D | 3,533,044 | 720,788 |
| Mode M0 | |||
|---|---|---|---|
| Quadrant | BADHDUFLAG | Total packets | Discarded packets |
| A | 0 | 14815 | 2 |
| B | 0 | 20104 | 2 |
| C | 0 | 14366 | 2 |
| D | 0 | 14604 | 2 |
| Mode SS | |||
|---|---|---|---|
| Quadrant | BADHDUFLAG | Total packets | Discarded packets |
| A | 0 | 128 | 0 |
| B | 0 | 128 | 0 |
| C | 0 | 128 | 0 |
| D | 0 | 128 | 0 |
| Mode M9 | |||
|---|---|---|---|
| Quadrant | BADHDUFLAG | Total packets | Discarded packets |
| A | 0 | 17 | 0 |
| B | 0 | 18 | 0 |
| C | 0 | 18 | 0 |
| D | 0 | 18 | 0 |
| Quadrant | Total seconds | Saturated seconds | Saturation percentage |
|---|---|---|---|
| A | 6307 | 143 | 2.267322% |
| B | 6306 | 134 | 2.124960% |
| C | 6306 | 102 | 1.617507% |
| D | 6306 | 95 | 1.506502% |
Noise dominated data is calculated using 1-second bins in cleaned event files. If a bin has >2000 counts, and if more than 50% of those come from <1% of pixels, then it is considered to be noise-dominated and hence unusable.
| Quadrant | # 1 sec bins | Bins with >0 counts | Bins with >2000 counts | High rate bins dominated by noise | Noise dominated (total time) | Noise dominated (detector-on time) | Marked lightcurve |
|---|---|---|---|---|---|---|---|
| A | 7547 | 6308 | 63 | 63 | 0.83% | 1.00% | 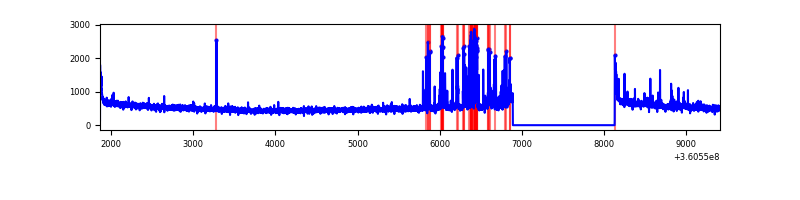 |
| B | 7546 | 6306 | 25 | 25 | 0.33% | 0.40% | 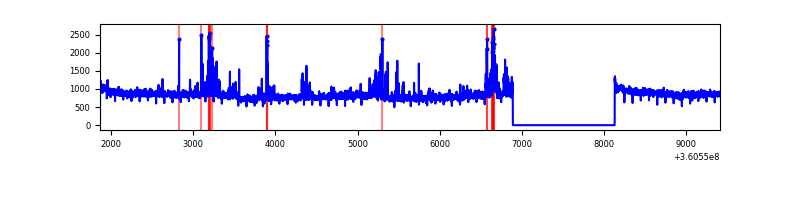 |
| C | 7546 | 6307 | 3 | 3 | 0.04% | 0.05% | 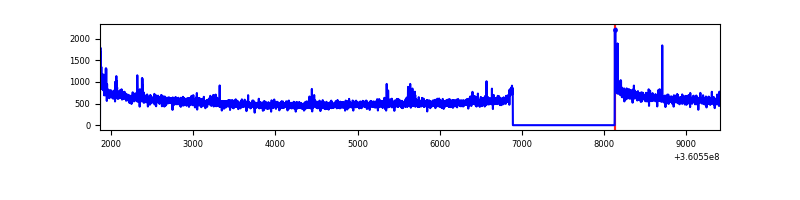 |
| D | 7546 | 6306 | 59 | 59 | 0.78% | 0.94% | 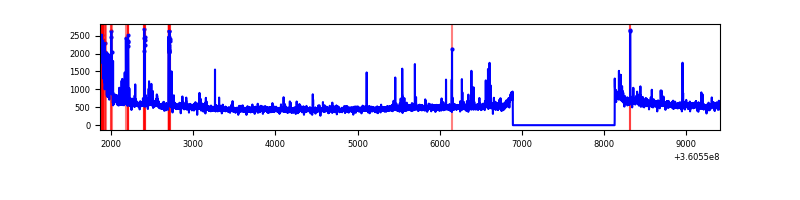 |
Top three noisy pixels from each quadrant. If the there are fewer than three noisy pixels in the level2.evt file, extra rows are filled as -1
| Pixel properties | Quadrant properties | ||||||
|---|---|---|---|---|---|---|---|
| Quadrant | DetID | PixID | Counts | Sigma | Mean | Median | Sigma |
| A | 0 | 13 | 348533 | 2087.1 | 836 | 823 | 166.6 |
| A | 8 | 192 | 39306 | 230.99 | 836 | 823 | 166.6 |
| A | 13 | 254 | 11524 | 64.23 | 836 | 823 | 166.6 |
| B | 6 | 159 | 1818744 | 11501.92 | 836 | 816 | 158.1 |
| B | 15 | 33 | 184525 | 1162.32 | 836 | 816 | 158.1 |
| B | 5 | 255 | 65667 | 410.31 | 836 | 816 | 158.1 |
| C | 14 | 238 | 139773 | 719.32 | 826 | 835 | 193.2 |
| C | 3 | 233 | 65700 | 335.82 | 826 | 835 | 193.2 |
| C | 0 | 10 | 31800 | 160.31 | 826 | 835 | 193.2 |
| D | 12 | 227 | 189590 | 919.84 | 826 | 810 | 205.2 |
| D | 8 | 195 | 76960 | 371.05 | 826 | 810 | 205.2 |
| D | 2 | 250 | 44661 | 213.67 | 826 | 810 | 205.2 |
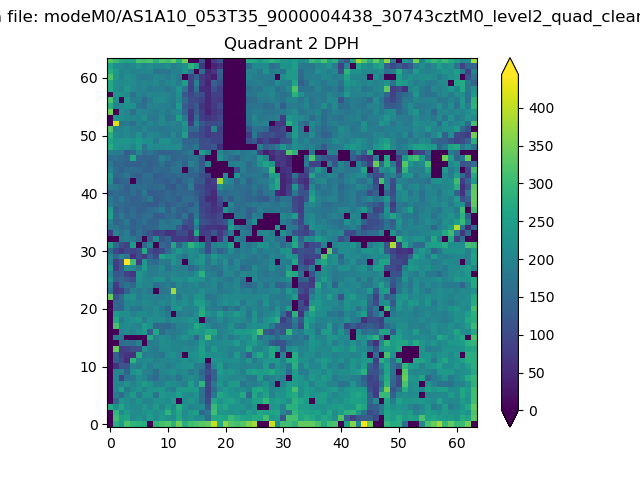
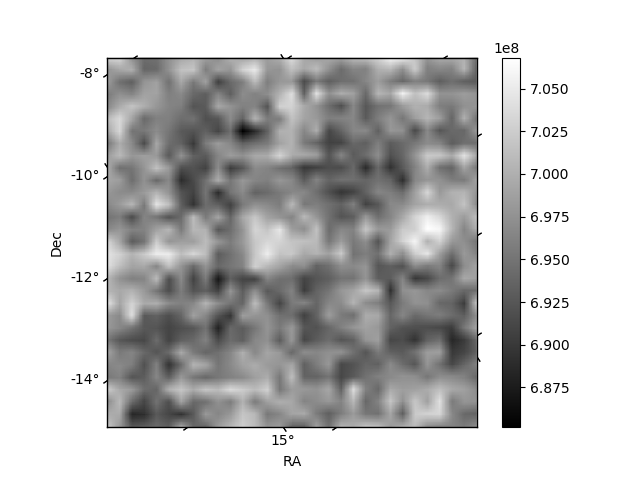
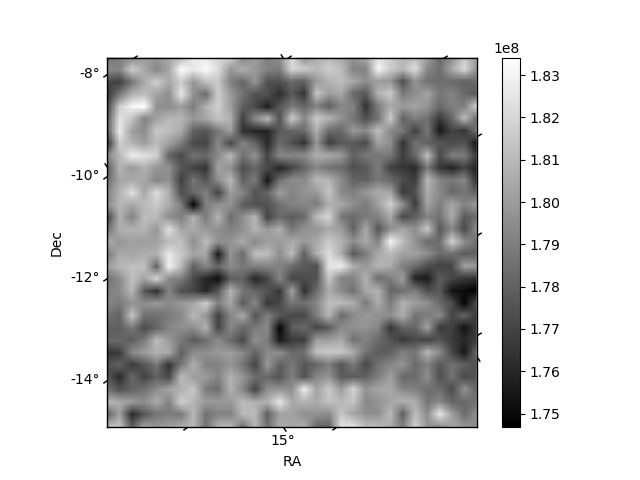
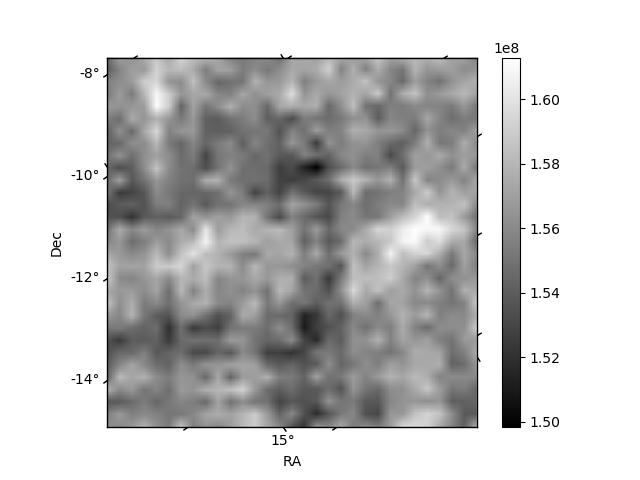
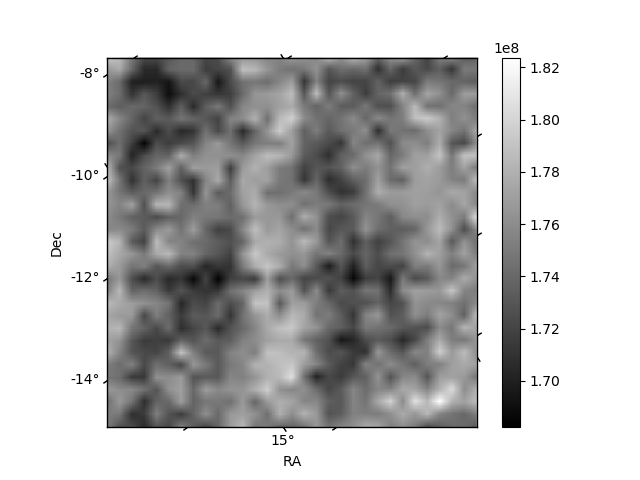
Histogram calculated using DETX and DETY for each event in the final _common_clean file
| Quadrant A | 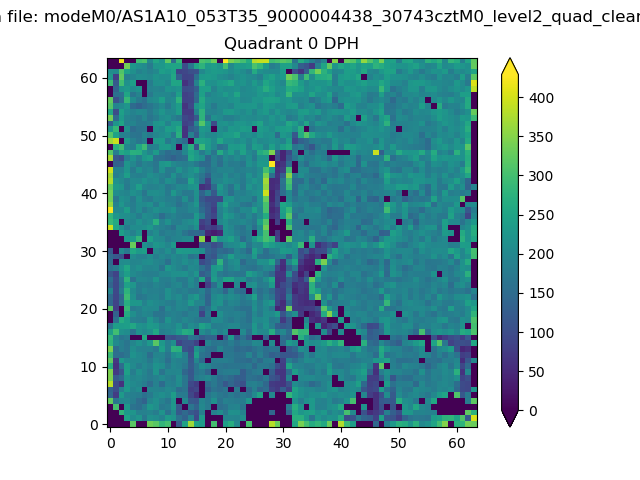 |
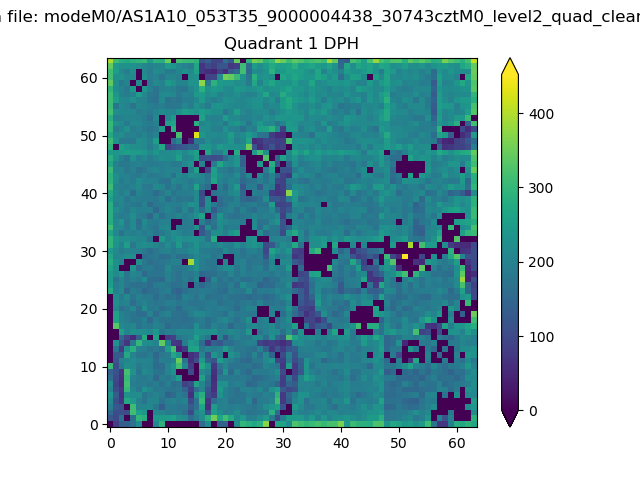 |
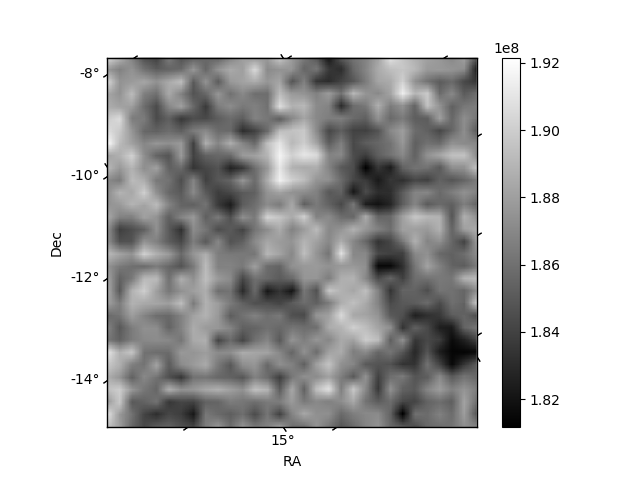
Quadrant B |
|---|---|---|---|
| Quadrant D | 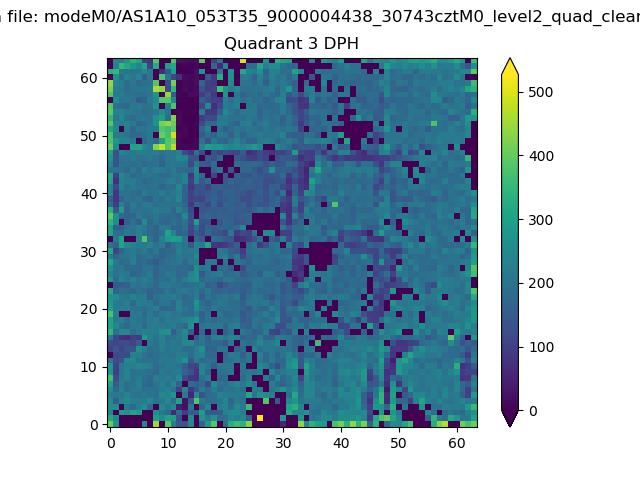 |
 |
Quadrant C |
| Plot type | Count rate plots | Images |
|---|---|---|
| Comparison with Poisson distribution Blue bars denote a histogram of data divided into 1 sec bins. Red curve is a Poisson curve with rate = median count rate of data. |
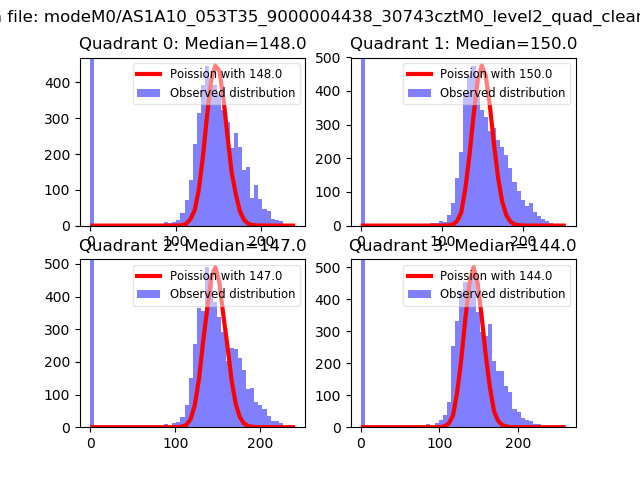 |
 |
| Quadrant-wise count rates Data is divided into 100 sec bins |
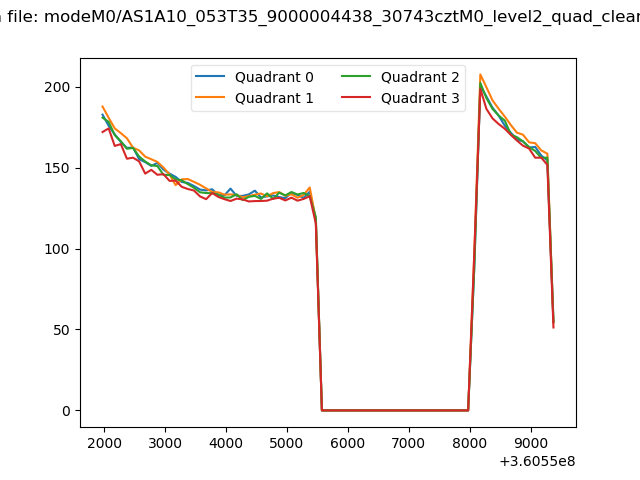 |
|
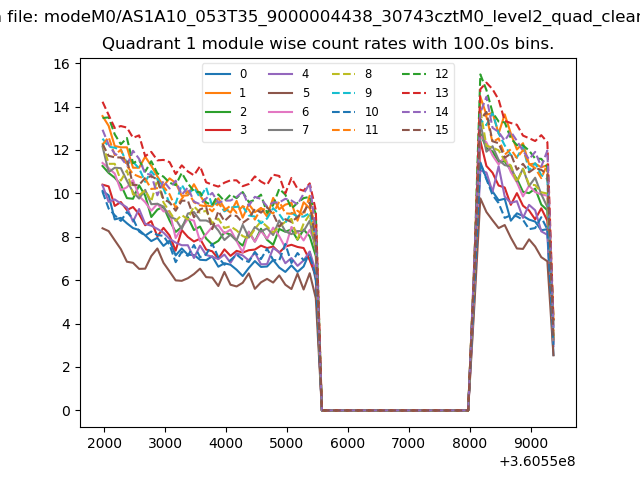
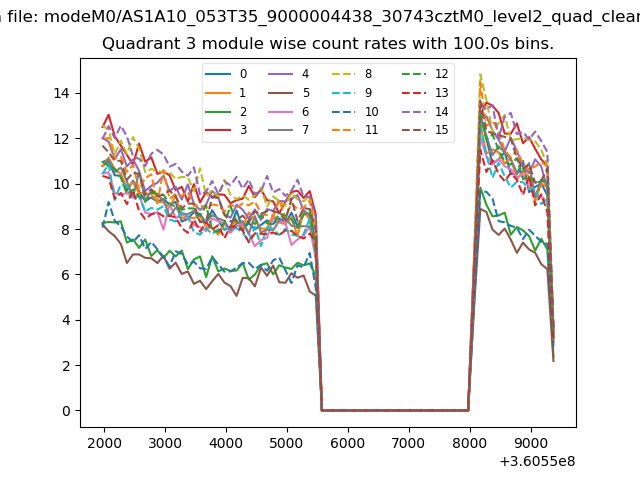
| Module-wise count rates for Quadrant A Data is divided into 100 sec bins |
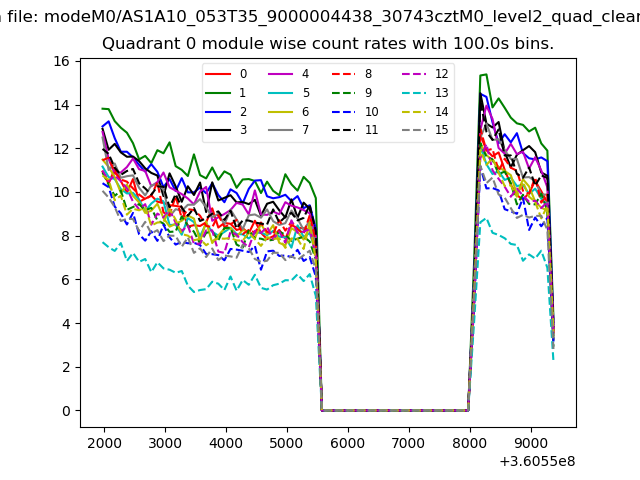 |
 |
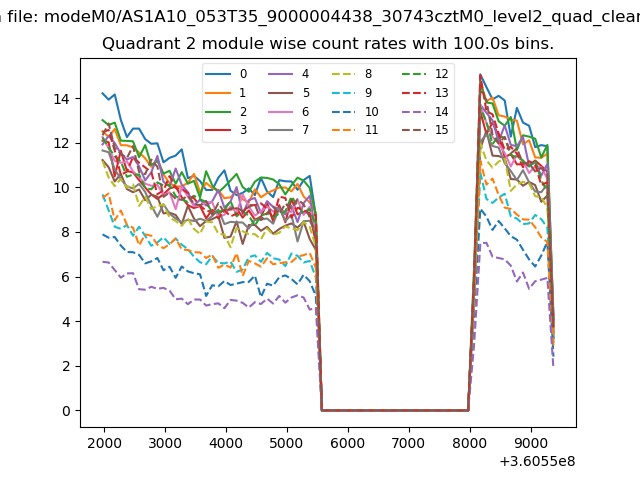
| Module-wise count rates for Quadrant B Data is divided into 100 sec bins |
 |
 |
| Module-wise count rates for Quadrant C Data is divided into 100 sec bins |
 |
 |
| Module-wise count rates for Quadrant D Data is divided into 100 sec bins |
 |
 |
| Parameter | Plot |
|---|---|
| CZT HV Monitor | 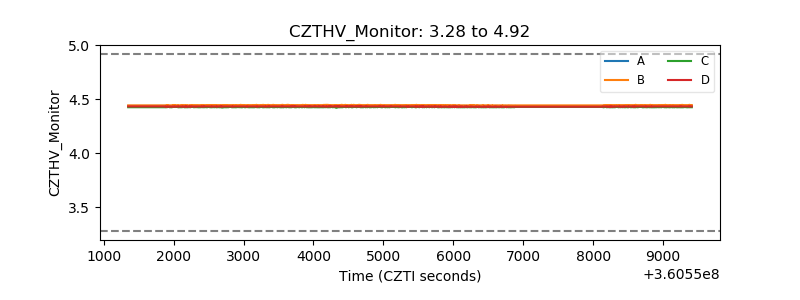 |
| D_VDD | 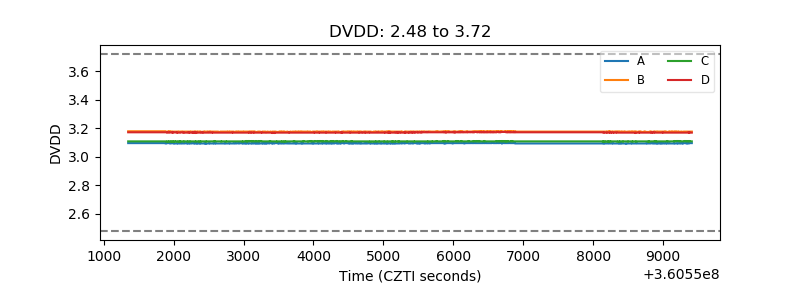 |
| Temperature 1 | 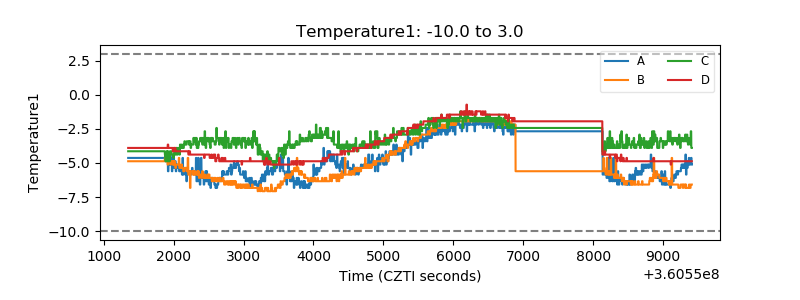 |
| Veto HV Monitor | 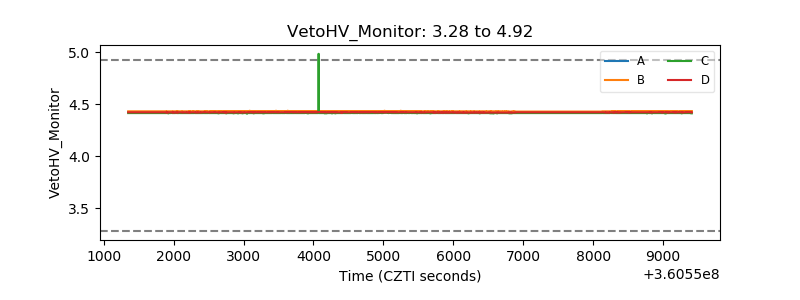 |
| Veto LLD | 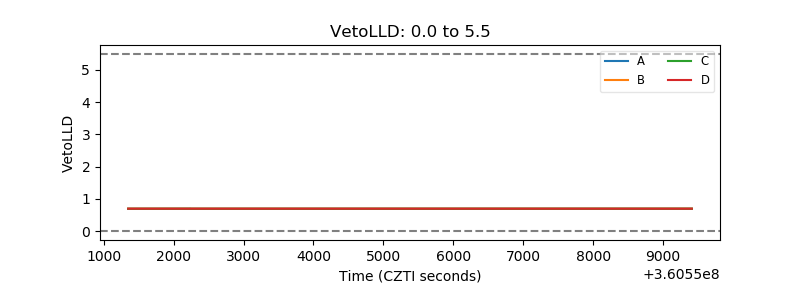 |
| Alpha Counter |  |
| _CPM_Rate | 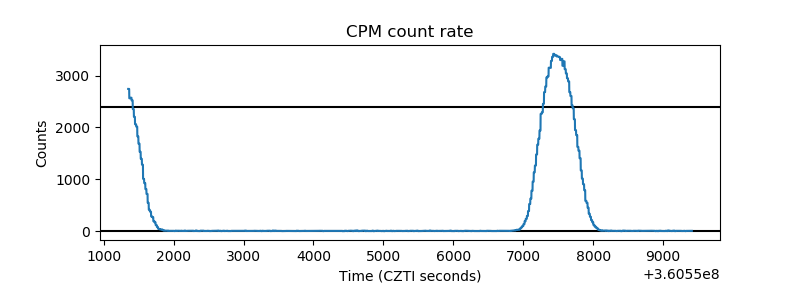 |
| CZT Counter | 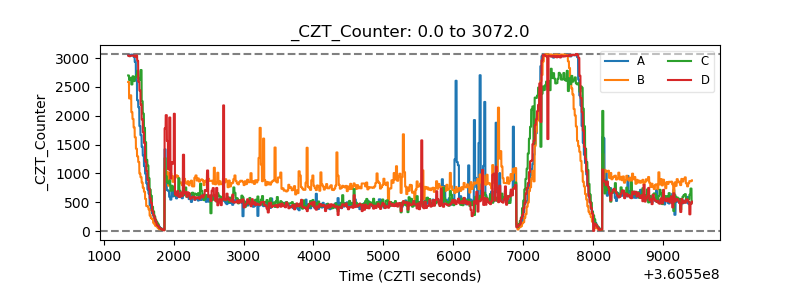 |
| +2.5 Volts monitor |  |
| +5 Volts monitor |  |
| _ROLL_ROT | 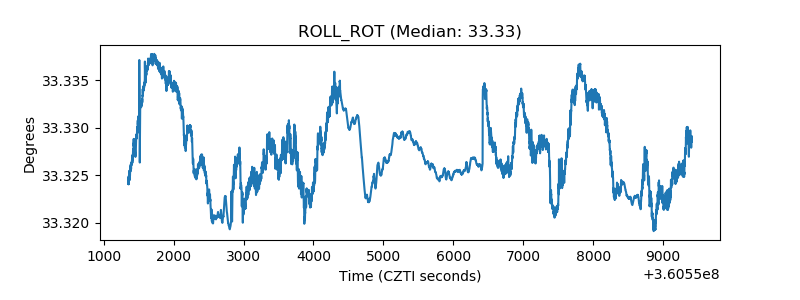 |
| _Roll_DEC | 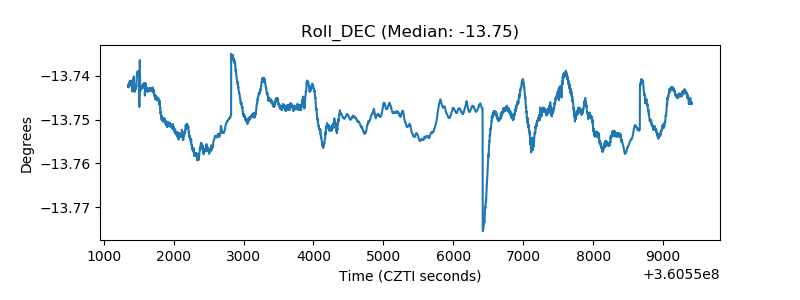 |
| _Roll_RA | 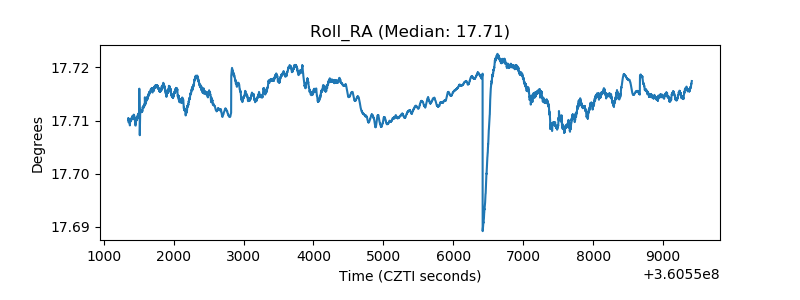 |
| Veto Counter |  |