| Param | Original file | Final file |
|---|---|---|
| Filename | modeM0/AS1A10_053T35_9000004438_30749cztM0_level2.evt | modeM0/AS1A10_053T35_9000004438_30749cztM0_level2_quad_clean.evt |
| Size (bytes) | 574,395,840 | 86,716,800 |
| Size | 547.8 MB | 82.7 MB |
| Events in quadrant A | 3,511,912 | 543,931 |
| Events in quadrant B | 5,451,290 | 542,665 |
| Events in quadrant C | 3,627,047 | 529,918 |
| Events in quadrant D | 4,328,830 | 519,363 |
| Mode M0 | |||
|---|---|---|---|
| Quadrant | BADHDUFLAG | Total packets | Discarded packets |
| A | 0 | 14802 | 2 |
| B | 0 | 21608 | 2 |
| C | 0 | 15018 | 2 |
| D | 0 | 17385 | 2 |
| Mode SS | |||
|---|---|---|---|
| Quadrant | BADHDUFLAG | Total packets | Discarded packets |
| A | 0 | 144 | 0 |
| B | 0 | 144 | 0 |
| C | 0 | 144 | 0 |
| D | 0 | 144 | 0 |
| Mode M9 | |||
|---|---|---|---|
| Quadrant | BADHDUFLAG | Total packets | Discarded packets |
| A | 0 | 2 | 0 |
| B | 0 | 2 | 0 |
| C | 0 | 2 | 0 |
| D | 0 | 2 | 0 |
| Quadrant | Total seconds | Saturated seconds | Saturation percentage |
|---|---|---|---|
| A | 7026 | 187 | 2.661543% |
| B | 7026 | 296 | 4.212923% |
| C | 7026 | 196 | 2.789638% |
| D | 7027 | 341 | 4.852711% |
Noise dominated data is calculated using 1-second bins in cleaned event files. If a bin has >2000 counts, and if more than 50% of those come from <1% of pixels, then it is considered to be noise-dominated and hence unusable.
| Quadrant | # 1 sec bins | Bins with >0 counts | Bins with >2000 counts | High rate bins dominated by noise | Noise dominated (total time) | Noise dominated (detector-on time) | Marked lightcurve |
|---|---|---|---|---|---|---|---|
| A | 7301 | 7026 | 10 | 10 | 0.14% | 0.14% | 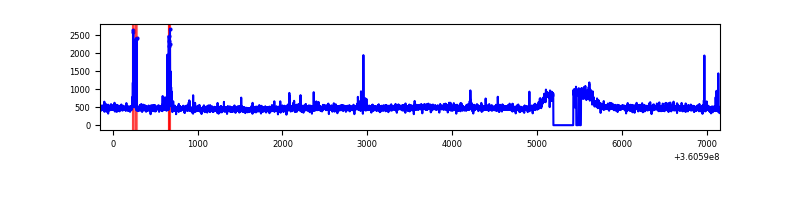 |
| B | 7301 | 7026 | 25 | 25 | 0.34% | 0.36% | 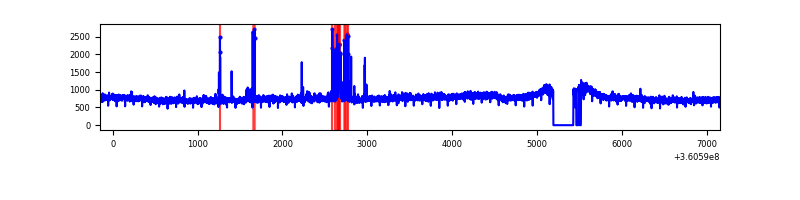 |
| C | 7301 | 7026 | 1 | 1 | 0.01% | 0.01% | 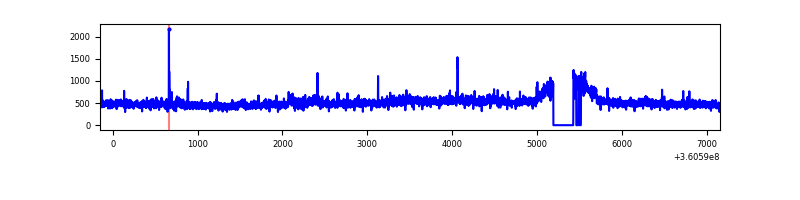 |
| D | 7302 | 7027 | 172 | 172 | 2.36% | 2.45% | 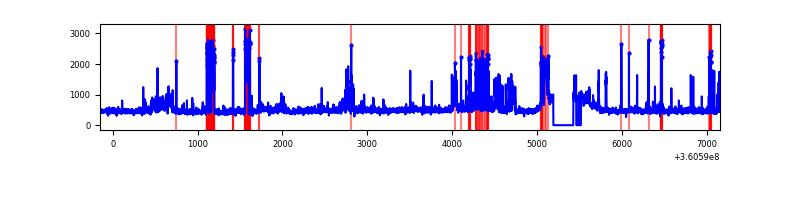 |
Top three noisy pixels from each quadrant. If the there are fewer than three noisy pixels in the level2.evt file, extra rows are filled as -1
| Pixel properties | Quadrant properties | ||||||
|---|---|---|---|---|---|---|---|
| Quadrant | DetID | PixID | Counts | Sigma | Mean | Median | Sigma |
| A | 0 | 13 | 75885 | 421.13 | 880 | 860 | 178.2 |
| A | 15 | 192 | 40863 | 224.54 | 880 | 860 | 178.2 |
| A | 13 | 254 | 13289 | 69.77 | 880 | 860 | 178.2 |
| B | 6 | 159 | 1912384 | 11359.75 | 859 | 836 | 168.3 |
| B | 5 | 255 | 109742 | 647.2 | 859 | 836 | 168.3 |
| B | 12 | 111 | 21341 | 121.85 | 859 | 836 | 168.3 |
| C | 14 | 238 | 135340 | 679.74 | 838 | 844 | 197.9 |
| C | 0 | 10 | 115936 | 581.67 | 838 | 844 | 197.9 |
| C | 3 | 233 | 46608 | 231.29 | 838 | 844 | 197.9 |
| D | 13 | 168 | 808279 | 3943.69 | 851 | 828 | 204.7 |
| D | 8 | 195 | 102819 | 498.14 | 851 | 828 | 204.7 |
| D | 2 | 250 | 67274 | 324.53 | 851 | 828 | 204.7 |
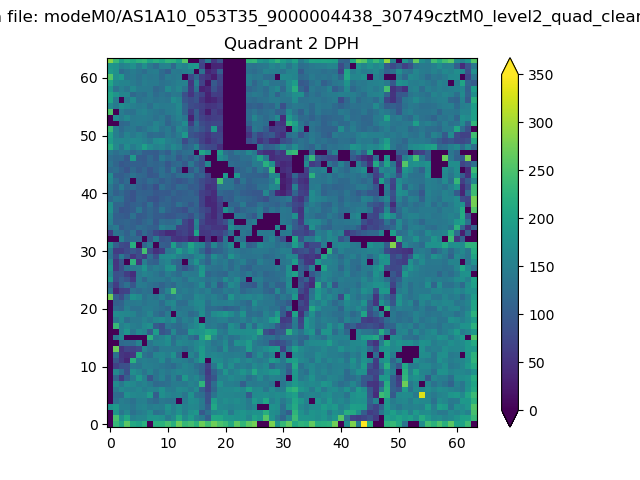
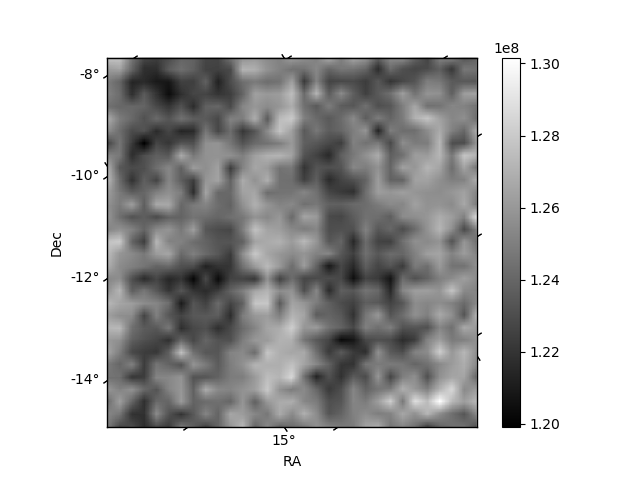
Histogram calculated using DETX and DETY for each event in the final _common_clean file
| Quadrant A | 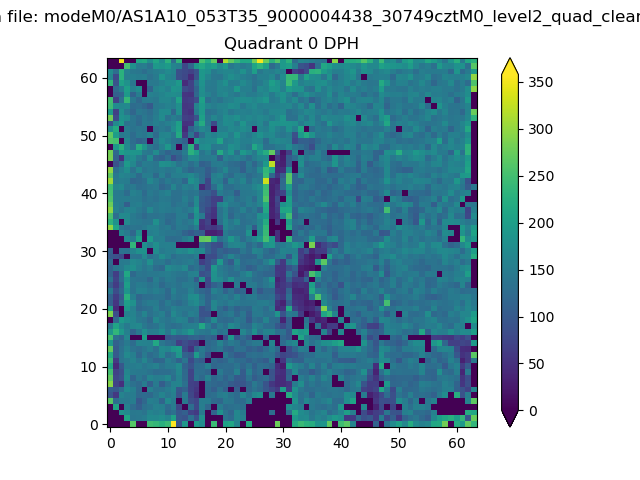 |
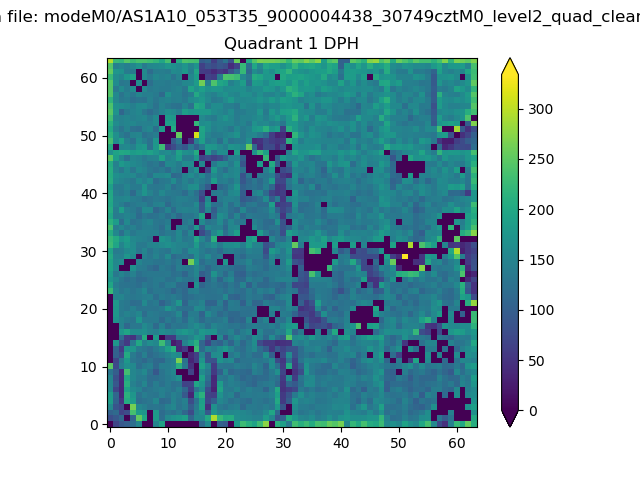 |
Quadrant B |
|---|---|---|---|
| Quadrant D | 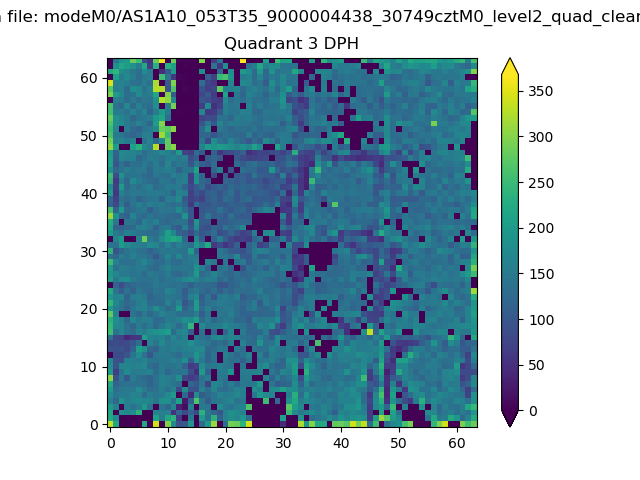 |
 |
Quadrant C |
| Plot type | Count rate plots | Images |
|---|---|---|
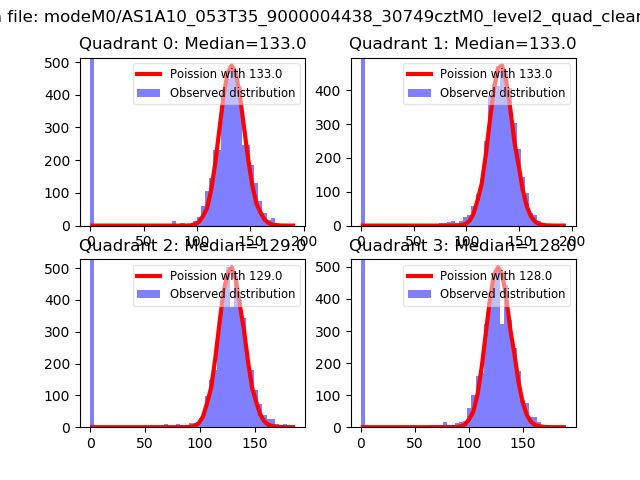
| Comparison with Poisson distribution Blue bars denote a histogram of data divided into 1 sec bins. Red curve is a Poisson curve with rate = median count rate of data. |
 |
 |
| Quadrant-wise count rates Data is divided into 100 sec bins |
 |
|
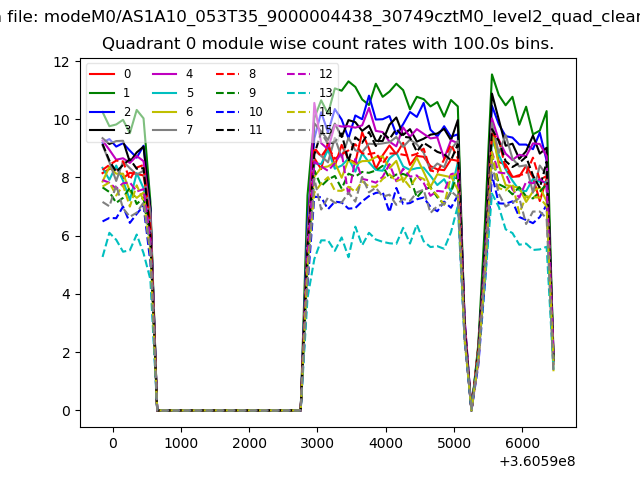
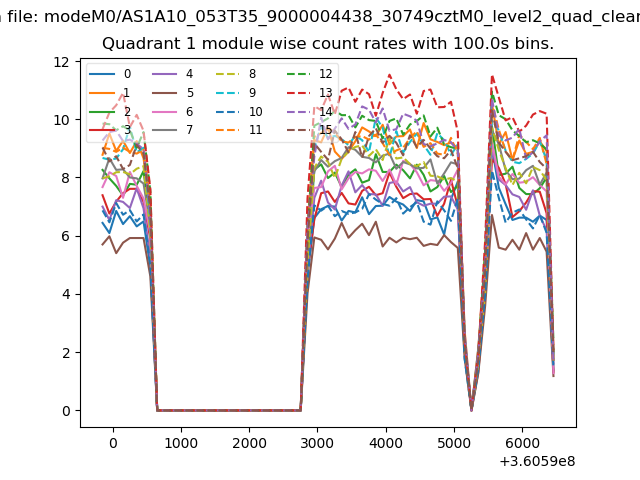
| Module-wise count rates for Quadrant A Data is divided into 100 sec bins |
 |
 |
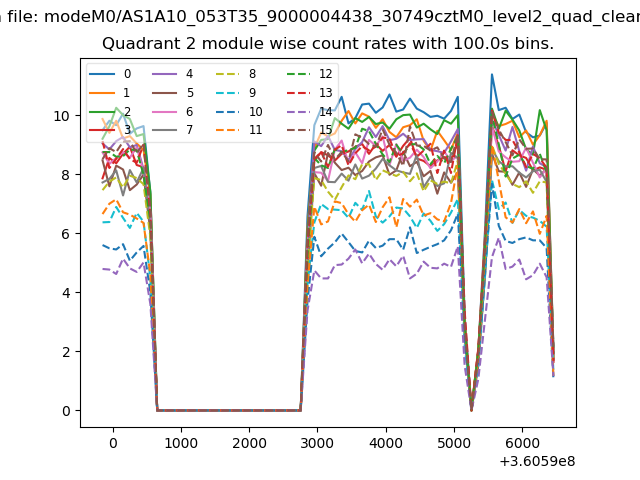
| Module-wise count rates for Quadrant B Data is divided into 100 sec bins |
 |
 |
| Module-wise count rates for Quadrant C Data is divided into 100 sec bins |
 |
 |
| Module-wise count rates for Quadrant D Data is divided into 100 sec bins |
 |
 |
| Parameter | Plot |
|---|---|
| CZT HV Monitor | 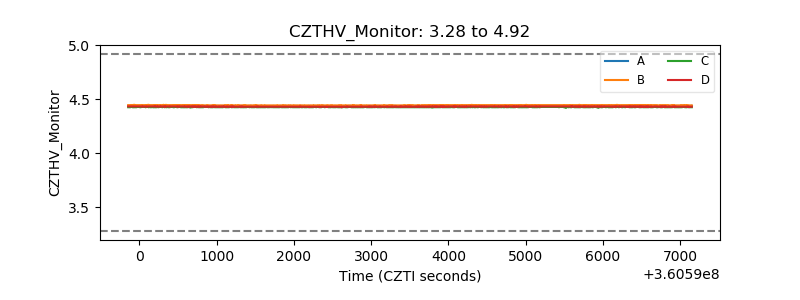 |
| D_VDD | 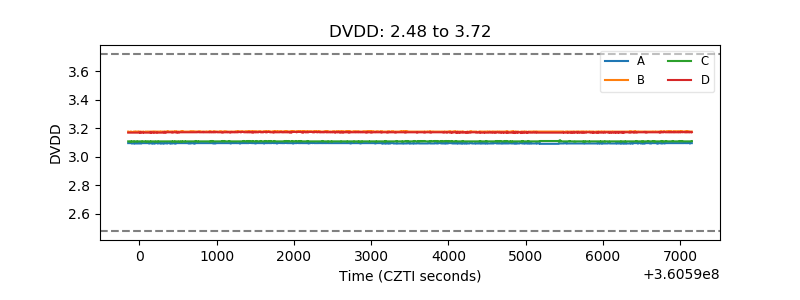 |
| Temperature 1 | 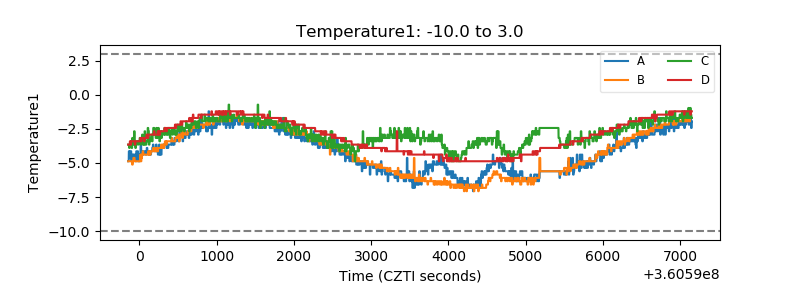 |
| Veto HV Monitor | 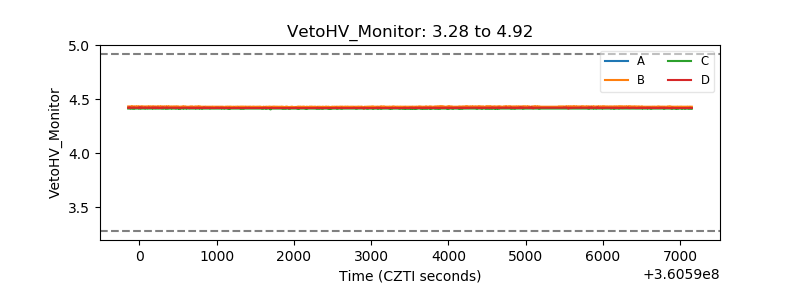 |
| Veto LLD | 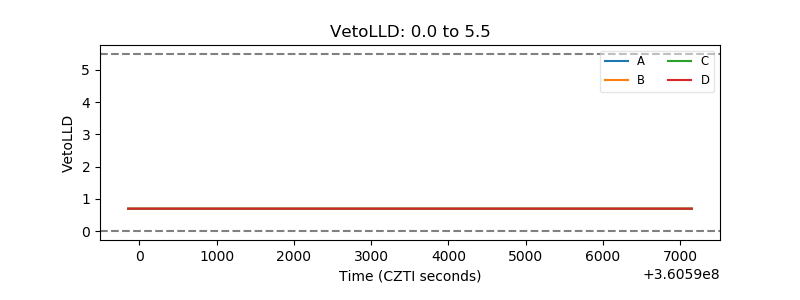 |
| Alpha Counter |  |
| _CPM_Rate | 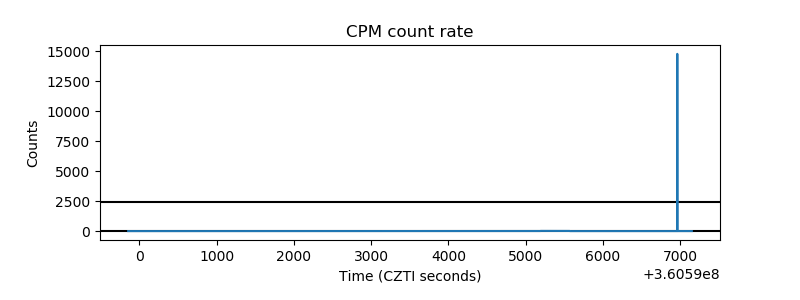 |
| CZT Counter | 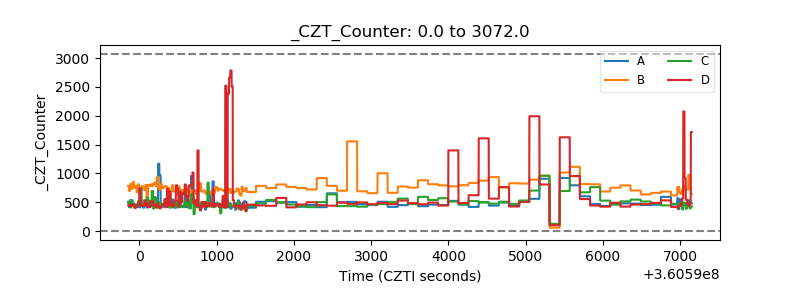 |
| +2.5 Volts monitor |  |
| +5 Volts monitor |  |
| _ROLL_ROT | 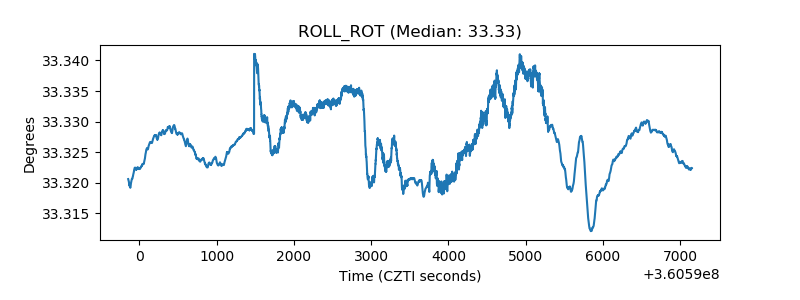 |
| _Roll_DEC | 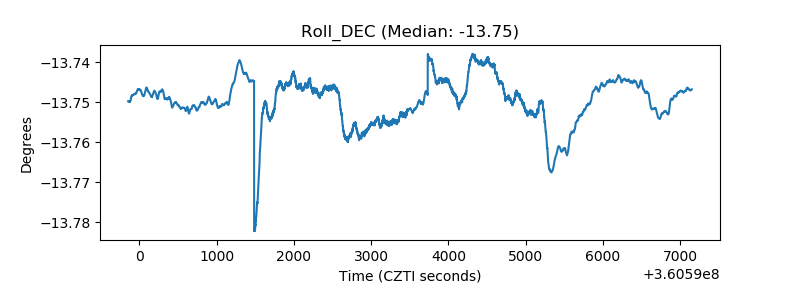 |
| _Roll_RA | 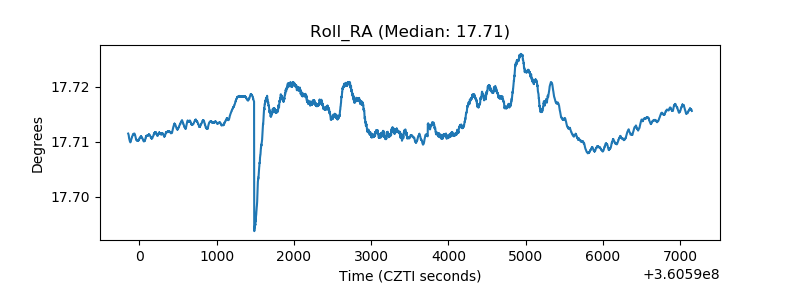 |
| Veto Counter | 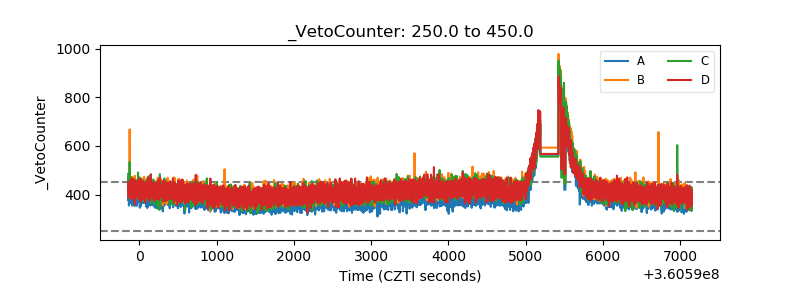 |