| Param | Original file | Final file |
|---|---|---|
| Filename | modeM0/AS1A10_053T35_9000004438_30750cztM0_level2.evt | modeM0/AS1A10_053T35_9000004438_30750cztM0_level2_quad_clean.evt |
| Size (bytes) | 654,909,120 | 87,353,280 |
| Size | 624.6 MB | 83.3 MB |
| Events in quadrant A | 3,644,322 | 544,206 |
| Events in quadrant B | 5,974,485 | 541,806 |
| Events in quadrant C | 3,757,718 | 528,716 |
| Events in quadrant D | 5,954,953 | 512,991 |
| Mode M0 | |||
|---|---|---|---|
| Quadrant | BADHDUFLAG | Total packets | Discarded packets |
| A | 0 | 15457 | 1 |
| B | 0 | 23387 | 1 |
| C | 0 | 15502 | 1 |
| D | 0 | 22703 | 1 |
| Mode SS | |||
|---|---|---|---|
| Quadrant | BADHDUFLAG | Total packets | Discarded packets |
| A | 0 | 152 | 0 |
| B | 0 | 152 | 0 |
| C | 0 | 152 | 0 |
| D | 0 | 152 | 0 |
| Mode M9 | |||
|---|---|---|---|
| Quadrant | BADHDUFLAG | Total packets | Discarded packets |
| A | 0 | 2 | 0 |
| B | 0 | 2 | 0 |
| C | 0 | 2 | 0 |
| D | 0 | 2 | 0 |
| Quadrant | Total seconds | Saturated seconds | Saturation percentage |
|---|---|---|---|
| A | 7425 | 164 | 2.208754% |
| B | 7426 | 334 | 4.497711% |
| C | 7426 | 179 | 2.410450% |
| D | 7426 | 349 | 4.699704% |
Noise dominated data is calculated using 1-second bins in cleaned event files. If a bin has >2000 counts, and if more than 50% of those come from <1% of pixels, then it is considered to be noise-dominated and hence unusable.
| Quadrant | # 1 sec bins | Bins with >0 counts | Bins with >2000 counts | High rate bins dominated by noise | Noise dominated (total time) | Noise dominated (detector-on time) | Marked lightcurve |
|---|---|---|---|---|---|---|---|
| A | 7635 | 7425 | 0 | 0 | 0.00% | 0.00% | 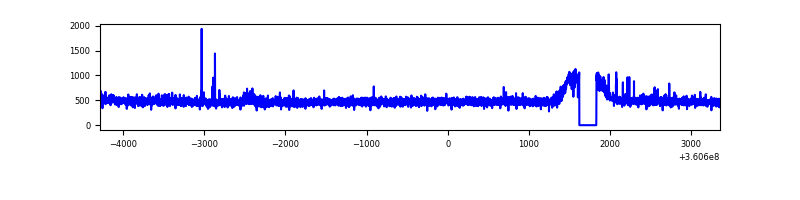 |
| B | 7636 | 7426 | 74 | 74 | 0.97% | 1.00% | 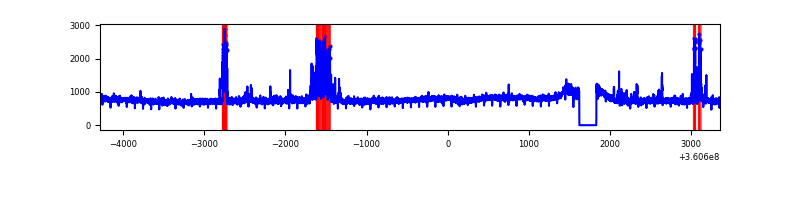 |
| C | 7636 | 7426 | 0 | 0 | 0.00% | 0.00% | 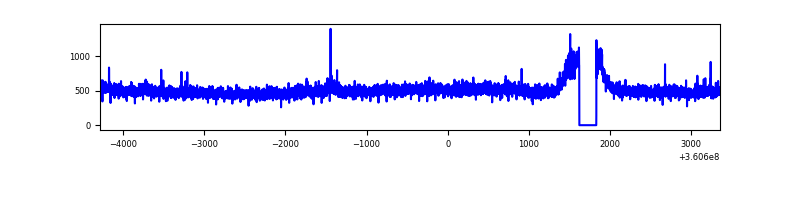 |
| D | 7636 | 7426 | 194 | 194 | 2.54% | 2.61% | 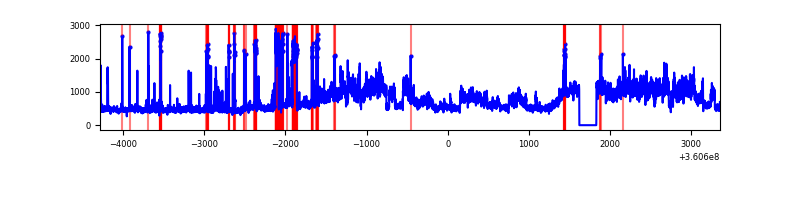 |
Top three noisy pixels from each quadrant. If the there are fewer than three noisy pixels in the level2.evt file, extra rows are filled as -1
| Pixel properties | Quadrant properties | ||||||
|---|---|---|---|---|---|---|---|
| Quadrant | DetID | PixID | Counts | Sigma | Mean | Median | Sigma |
| A | 15 | 192 | 37158 | 191.98 | 930 | 908 | 188.8 |
| A | 0 | 13 | 19235 | 97.06 | 930 | 908 | 188.8 |
| A | 13 | 254 | 14522 | 72.1 | 930 | 908 | 188.8 |
| B | 6 | 159 | 1999702 | 11367.91 | 906 | 883 | 175.8 |
| B | 5 | 255 | 311821 | 1768.4 | 906 | 883 | 175.8 |
| B | 0 | 190 | 68210 | 382.91 | 906 | 883 | 175.8 |
| C | 14 | 238 | 141189 | 663.52 | 887 | 894 | 211.4 |
| C | 3 | 233 | 114889 | 539.14 | 887 | 894 | 211.4 |
| C | 0 | 10 | 17832 | 80.11 | 887 | 894 | 211.4 |
| D | 8 | 195 | 1766976 | 8080.03 | 899 | 872 | 218.6 |
| D | 12 | 227 | 380277 | 1735.8 | 899 | 872 | 218.6 |
| D | 13 | 138 | 119628 | 543.32 | 899 | 872 | 218.6 |
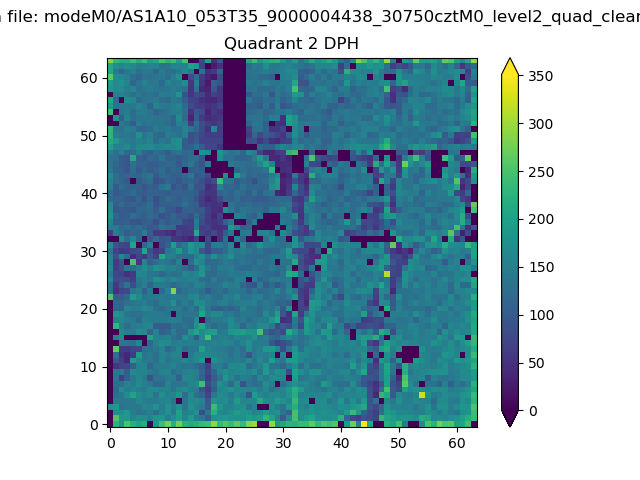
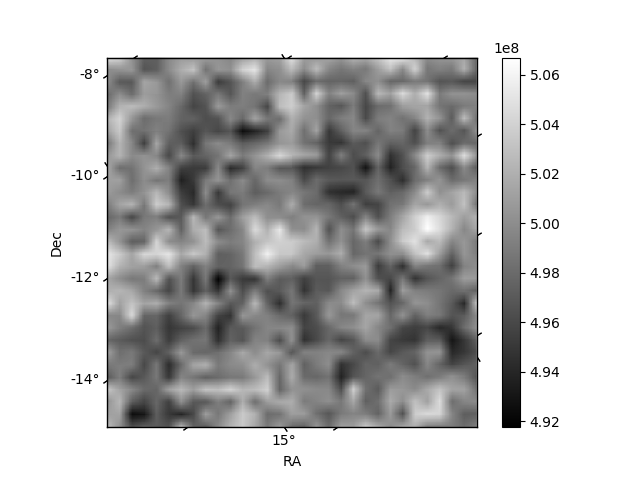
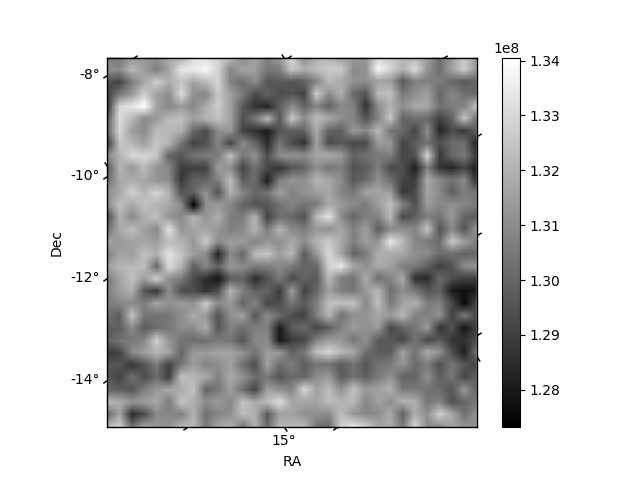
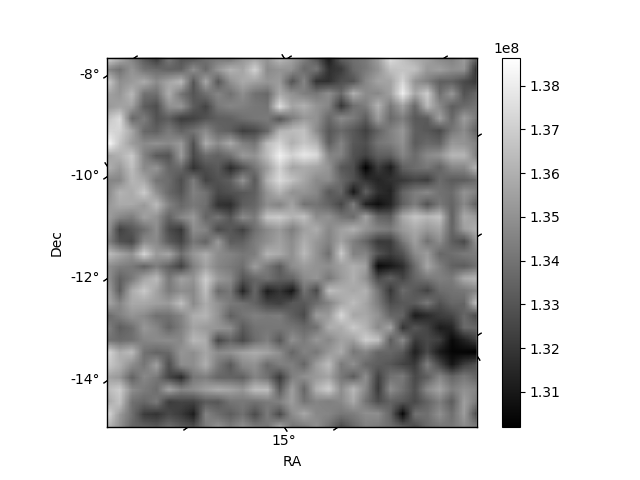
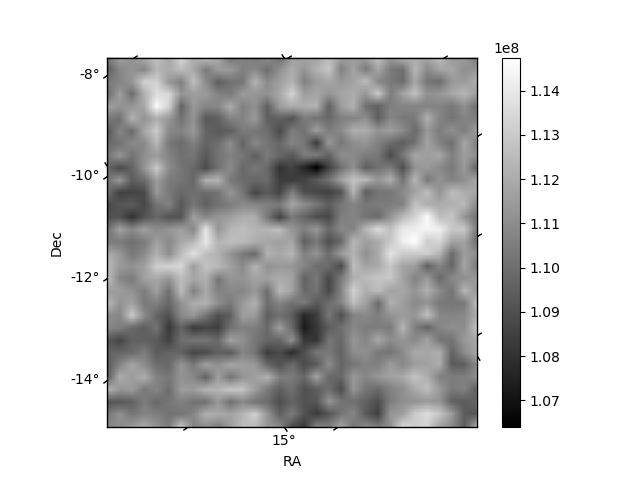
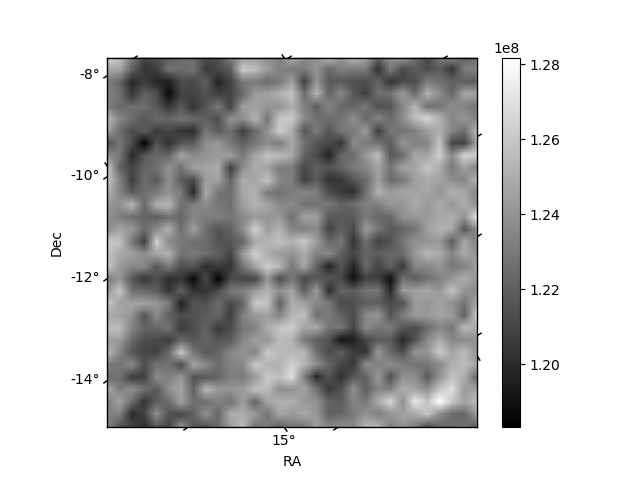
Histogram calculated using DETX and DETY for each event in the final _common_clean file
| Quadrant A | 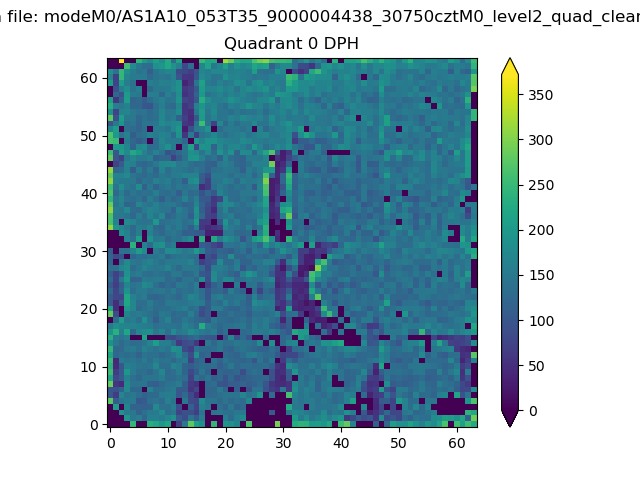 |
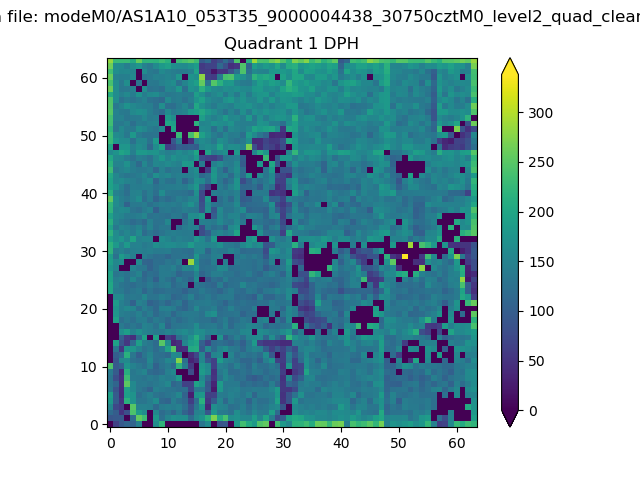 |
Quadrant B |
|---|---|---|---|
| Quadrant D | 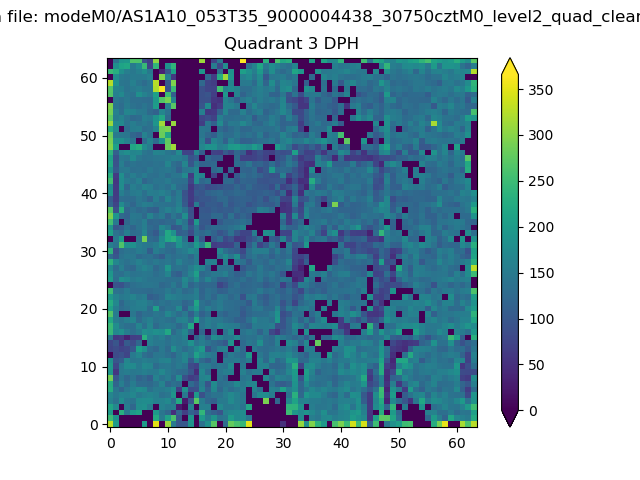 |
 |
Quadrant C |
| Plot type | Count rate plots | Images |
|---|---|---|
| Comparison with Poisson distribution Blue bars denote a histogram of data divided into 1 sec bins. Red curve is a Poisson curve with rate = median count rate of data. |
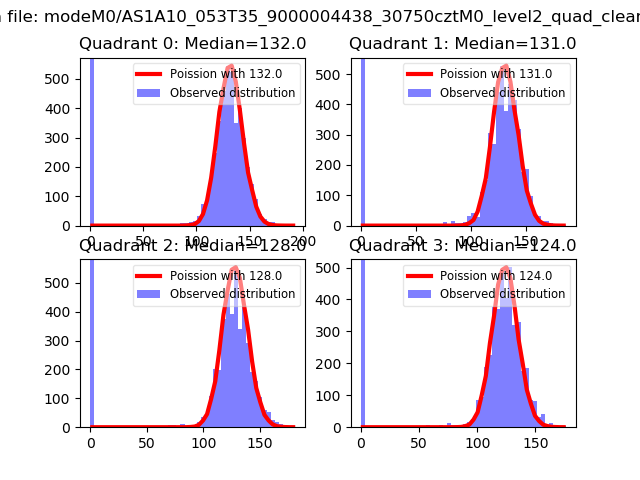 |
 |
| Quadrant-wise count rates Data is divided into 100 sec bins |
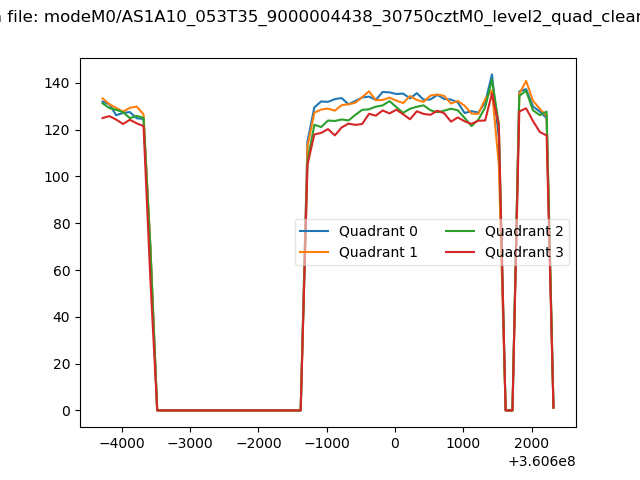 |
|
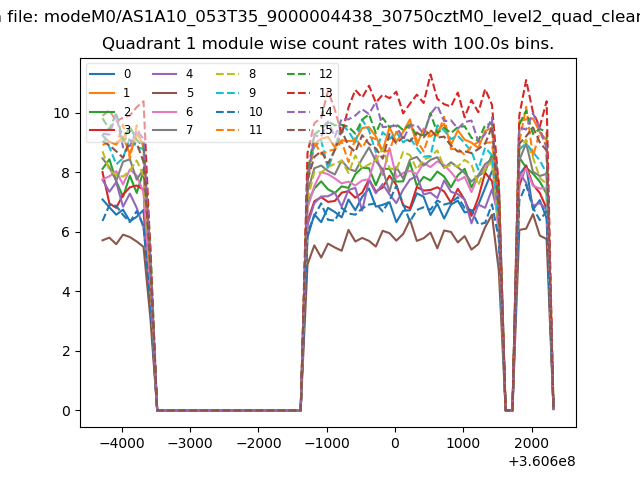
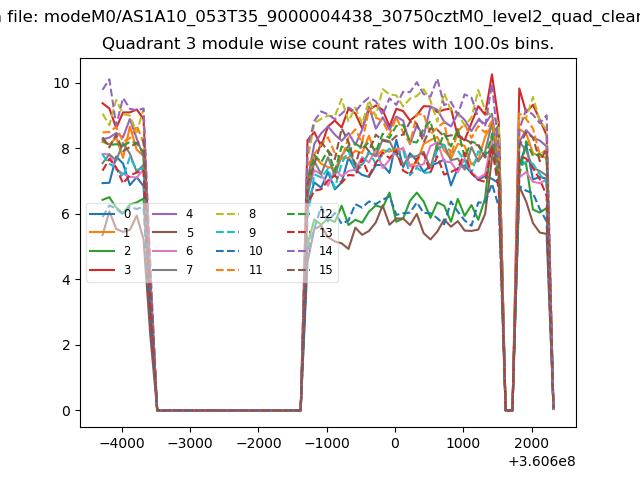
| Module-wise count rates for Quadrant A Data is divided into 100 sec bins |
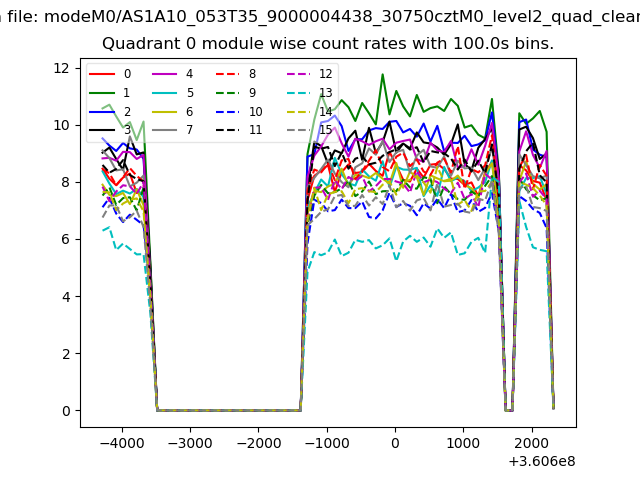 |
 |
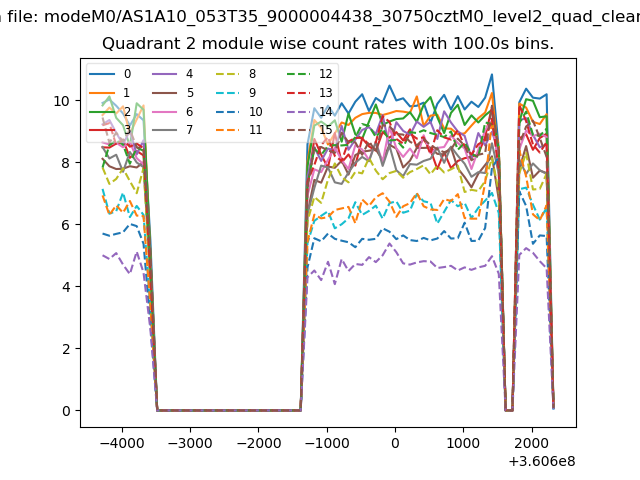
| Module-wise count rates for Quadrant B Data is divided into 100 sec bins |
 |
 |
| Module-wise count rates for Quadrant C Data is divided into 100 sec bins |
 |
 |
| Module-wise count rates for Quadrant D Data is divided into 100 sec bins |
 |
 |
| Parameter | Plot |
|---|---|
| CZT HV Monitor | 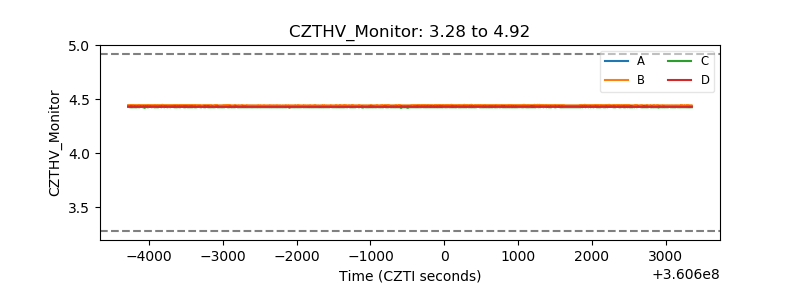 |
| D_VDD | 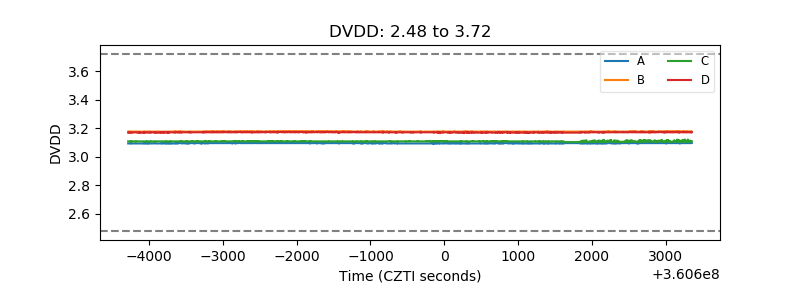 |
| Temperature 1 | 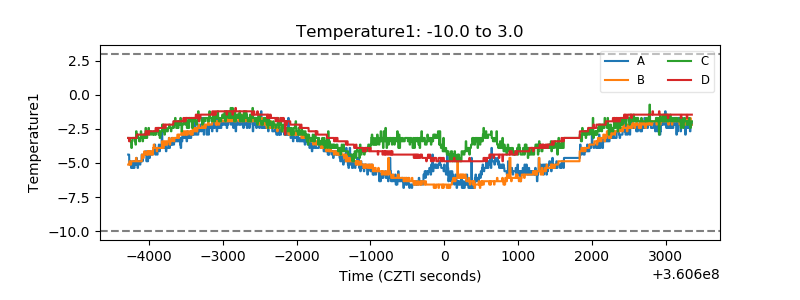 |
| Veto HV Monitor | 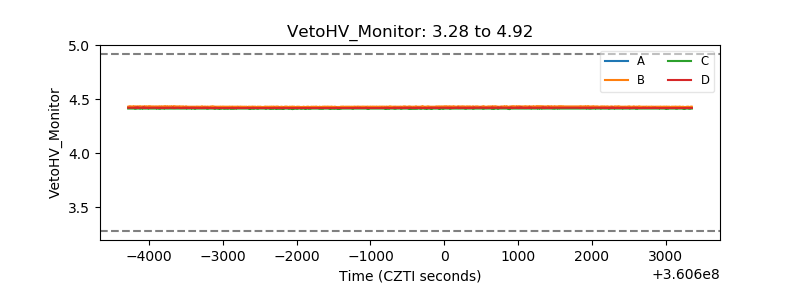 |
| Veto LLD | 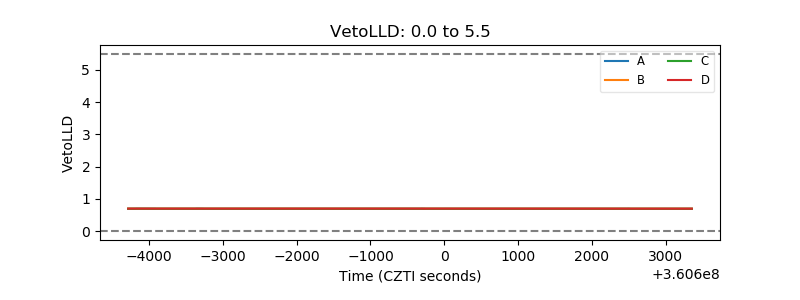 |
| Alpha Counter | 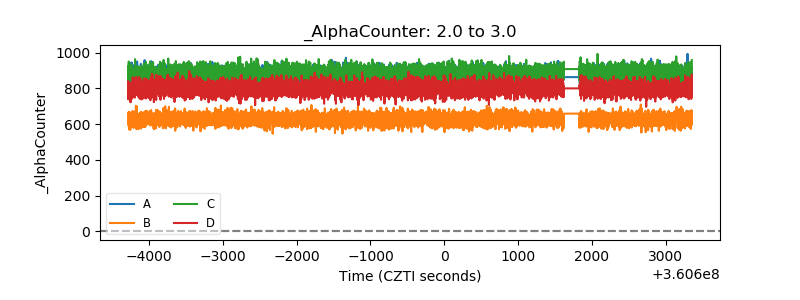 |
| _CPM_Rate | 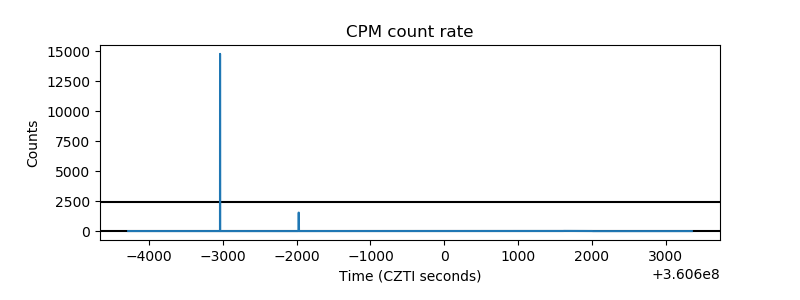 |
| CZT Counter | 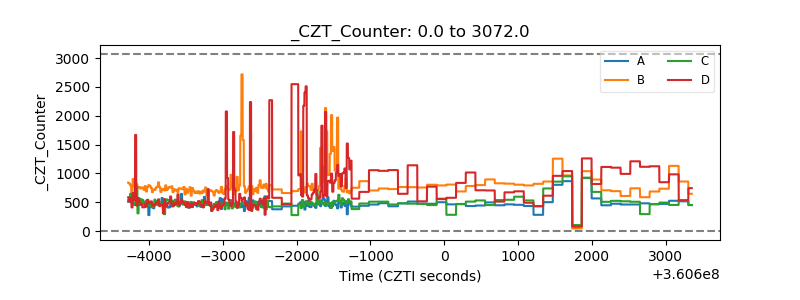 |
| +2.5 Volts monitor |  |
| +5 Volts monitor |  |
| _ROLL_ROT | 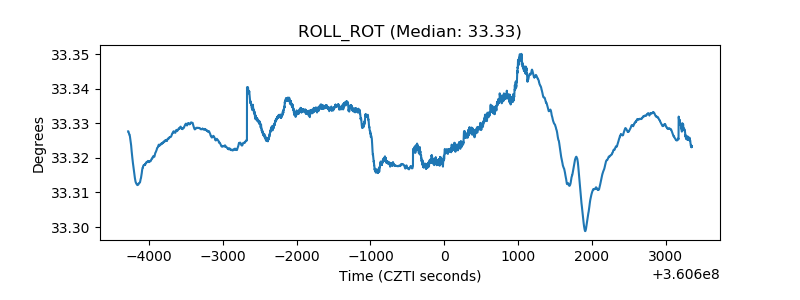 |
| _Roll_DEC | 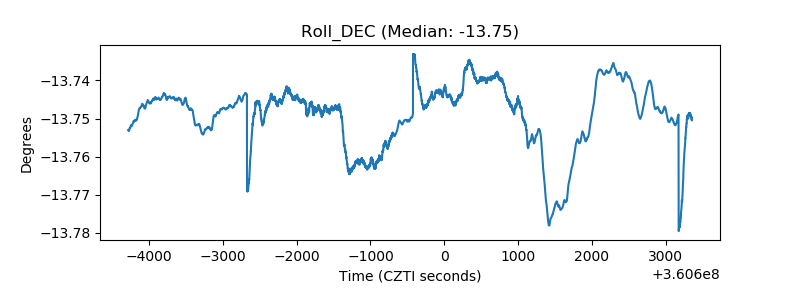 |
| _Roll_RA | 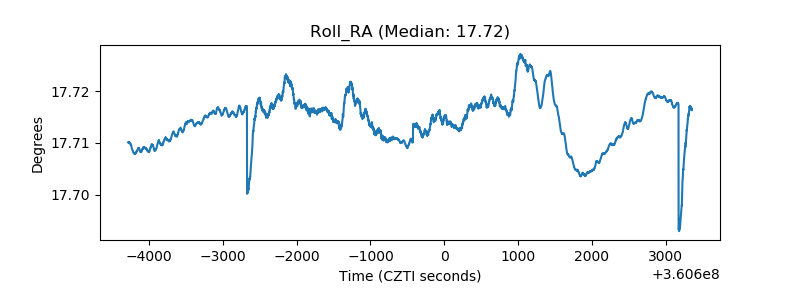 |
| Veto Counter | 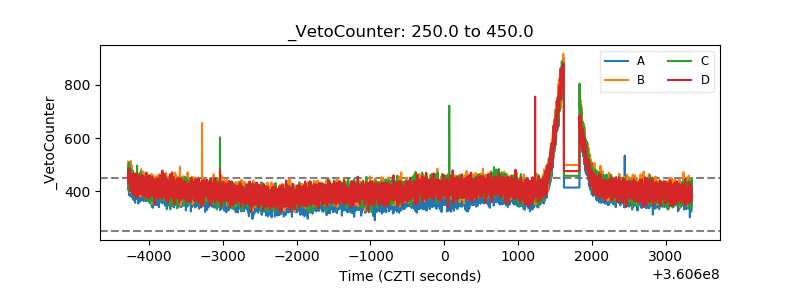 |