| Param | Original file | Final file |
|---|---|---|
| Filename | modeM0/AS1A10_053T35_9000004438_30754cztM0_level2.evt | modeM0/AS1A10_053T35_9000004438_30754cztM0_level2_quad_clean.evt |
| Size (bytes) | 723,991,680 | 80,366,400 |
| Size | 690.5 MB | 76.6 MB |
| Events in quadrant A | 3,873,472 | 480,508 |
| Events in quadrant B | 6,590,361 | 476,358 |
| Events in quadrant C | 4,262,666 | 456,870 |
| Events in quadrant D | 6,645,337 | 449,560 |
| Mode M0 | |||
|---|---|---|---|
| Quadrant | BADHDUFLAG | Total packets | Discarded packets |
| A | 0 | 16718 | 1 |
| B | 0 | 25811 | 1 |
| C | 0 | 17585 | 1 |
| D | 0 | 25572 | 1 |
| Mode SS | |||
|---|---|---|---|
| Quadrant | BADHDUFLAG | Total packets | Discarded packets |
| A | 0 | 166 | 0 |
| B | 0 | 166 | 0 |
| C | 0 | 166 | 0 |
| D | 0 | 166 | 0 |
| Mode M9 | |||
|---|---|---|---|
| Quadrant | BADHDUFLAG | Total packets | Discarded packets |
| A | 0 | 5 | 0 |
| B | 0 | 5 | 0 |
| C | 0 | 5 | 0 |
| D | 0 | 5 | 0 |
| Quadrant | Total seconds | Saturated seconds | Saturation percentage |
|---|---|---|---|
| A | 8203 | 54 | 0.658296% |
| B | 8204 | 269 | 3.278888% |
| C | 8204 | 179 | 2.181863% |
| D | 8204 | 301 | 3.668942% |
Noise dominated data is calculated using 1-second bins in cleaned event files. If a bin has >2000 counts, and if more than 50% of those come from <1% of pixels, then it is considered to be noise-dominated and hence unusable.
| Quadrant | # 1 sec bins | Bins with >0 counts | Bins with >2000 counts | High rate bins dominated by noise | Noise dominated (total time) | Noise dominated (detector-on time) | Marked lightcurve |
|---|---|---|---|---|---|---|---|
| A | 8638 | 8203 | 0 | 0 | 0.00% | 0.00% | 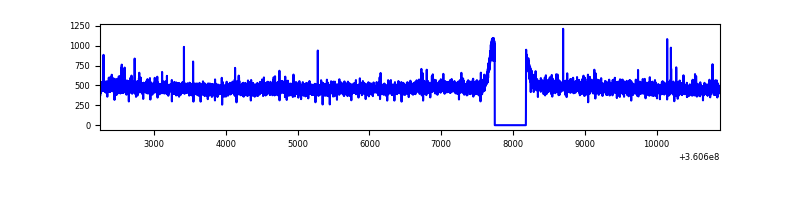 |
| B | 8639 | 8204 | 115 | 115 | 1.33% | 1.40% | 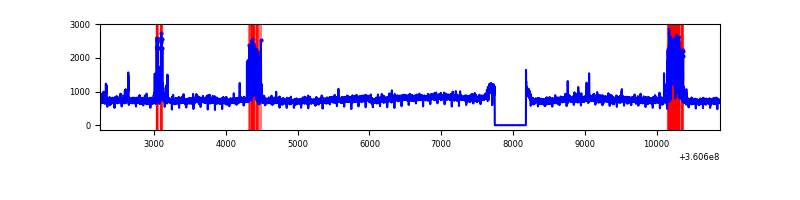 |
| C | 8639 | 8204 | 53 | 53 | 0.61% | 0.65% | 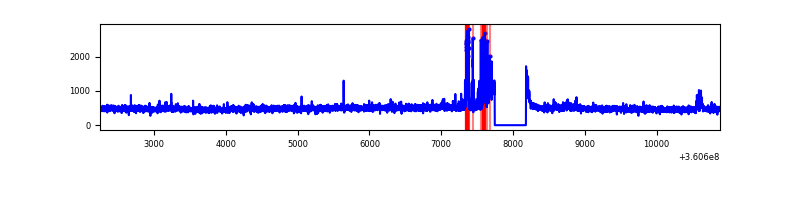 |
| D | 8639 | 8204 | 259 | 259 | 3.00% | 3.16% | 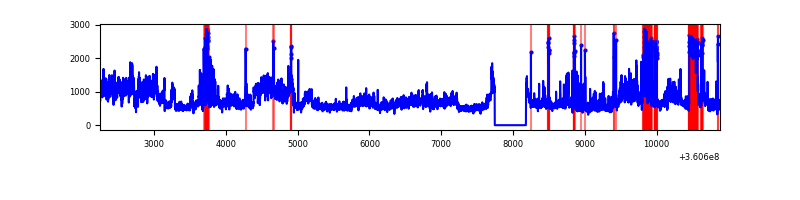 |
Top three noisy pixels from each quadrant. If the there are fewer than three noisy pixels in the level2.evt file, extra rows are filled as -1
| Pixel properties | Quadrant properties | ||||||
|---|---|---|---|---|---|---|---|
| Quadrant | DetID | PixID | Counts | Sigma | Mean | Median | Sigma |
| A | 13 | 254 | 16704 | 77.53 | 998 | 977 | 202.9 |
| A | 0 | 13 | 13782 | 63.13 | 998 | 977 | 202.9 |
| A | 3 | 137 | 10222 | 45.58 | 998 | 977 | 202.9 |
| B | 6 | 159 | 2238061 | 11725.89 | 978 | 952 | 190.8 |
| B | 5 | 255 | 424808 | 2221.66 | 978 | 952 | 190.8 |
| B | 0 | 190 | 63266 | 326.62 | 978 | 952 | 190.8 |
| C | 10 | 22 | 224135 | 990.56 | 948 | 955 | 225.3 |
| C | 14 | 238 | 153533 | 677.2 | 948 | 955 | 225.3 |
| C | 3 | 233 | 108051 | 475.33 | 948 | 955 | 225.3 |
| D | 8 | 195 | 2329605 | 10144.13 | 960 | 935 | 229.6 |
| D | 13 | 249 | 382793 | 1663.45 | 960 | 935 | 229.6 |
| D | 12 | 227 | 243172 | 1055.23 | 960 | 935 | 229.6 |
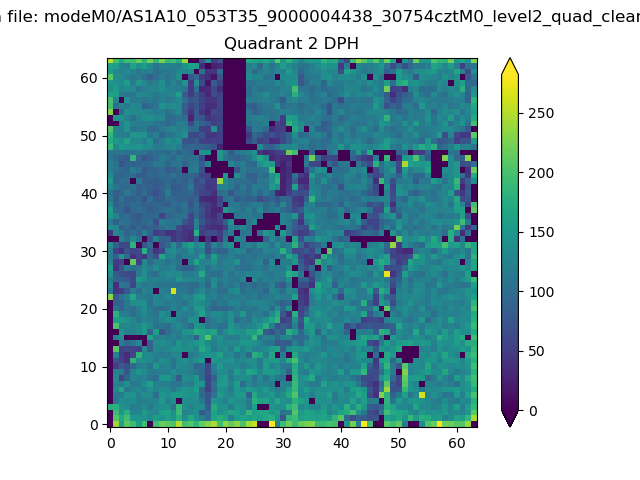
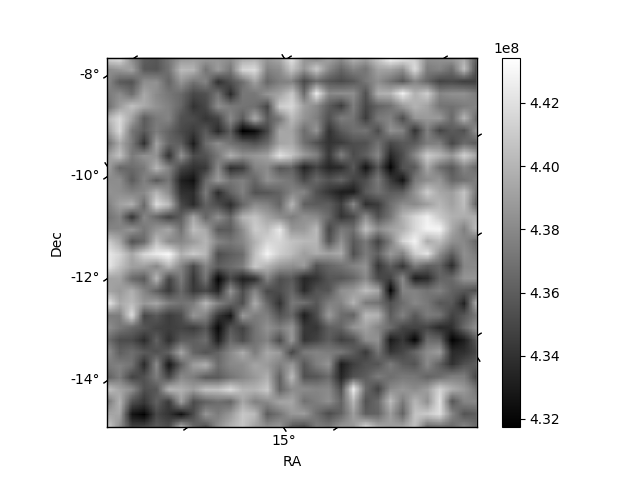
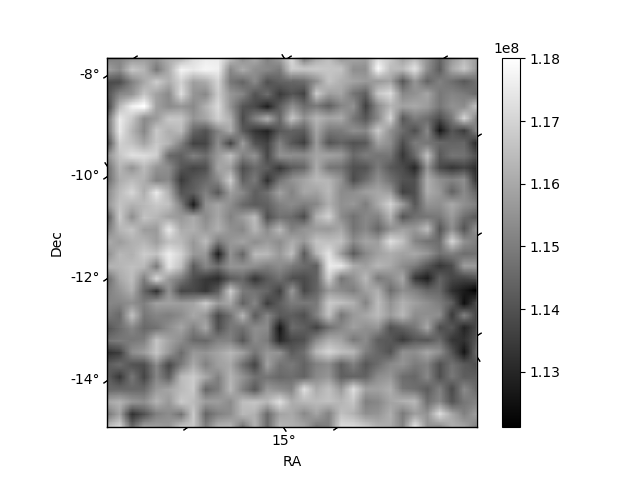
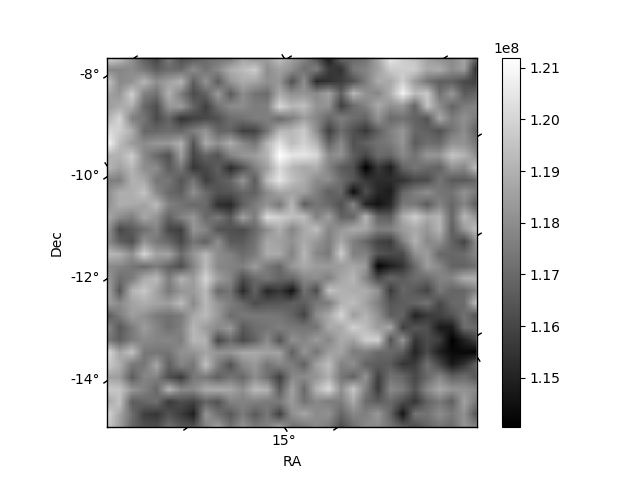
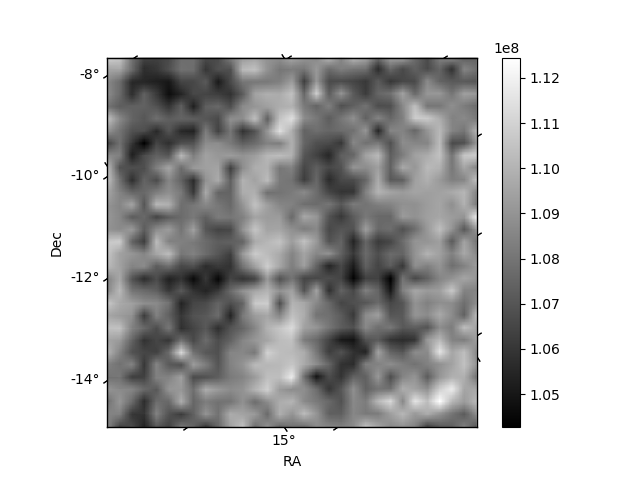
Histogram calculated using DETX and DETY for each event in the final _common_clean file
| Quadrant A | 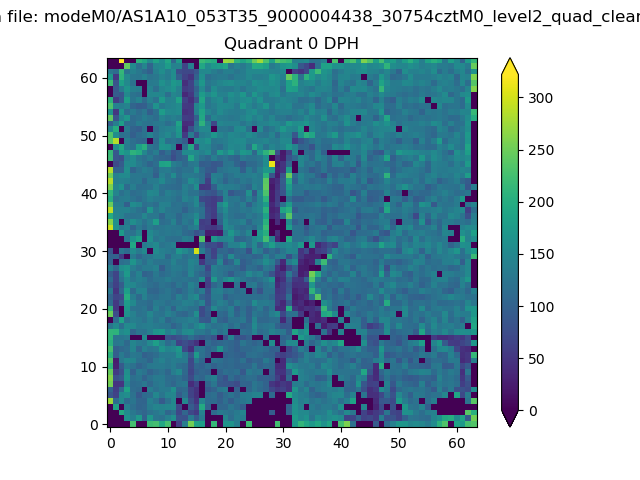 |
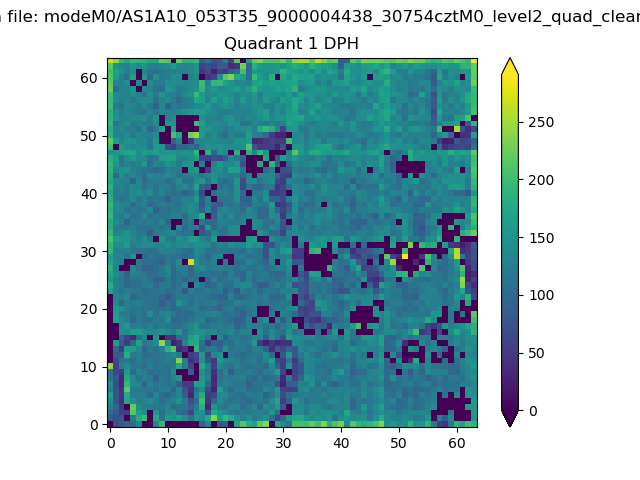 |
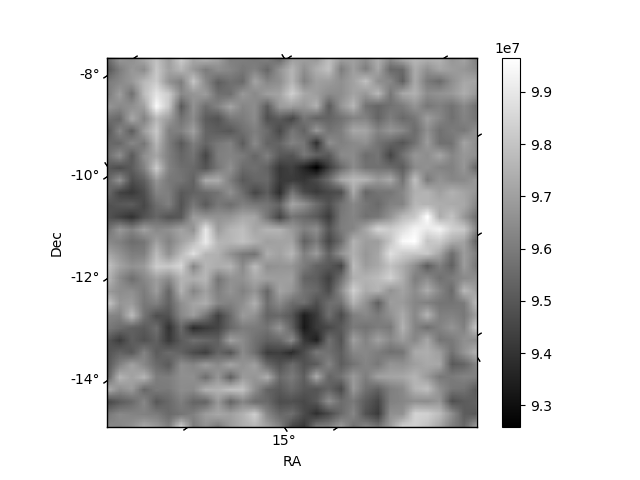
Quadrant B |
|---|---|---|---|
| Quadrant D | 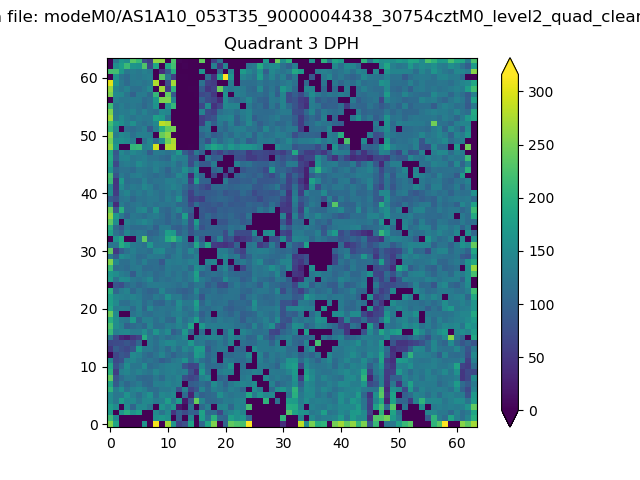 |
 |
Quadrant C |
| Plot type | Count rate plots | Images |
|---|---|---|
| Comparison with Poisson distribution Blue bars denote a histogram of data divided into 1 sec bins. Red curve is a Poisson curve with rate = median count rate of data. |
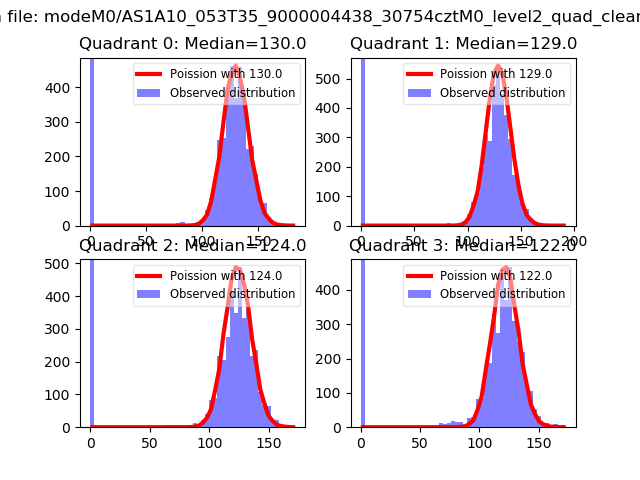 |
 |
| Quadrant-wise count rates Data is divided into 100 sec bins |
 |
|
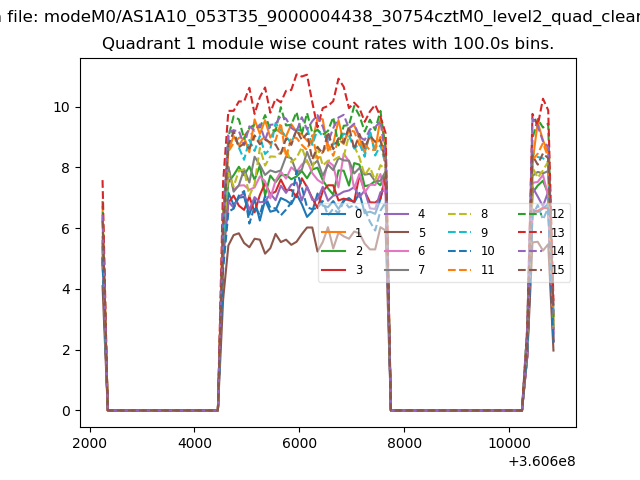
| Module-wise count rates for Quadrant A Data is divided into 100 sec bins |
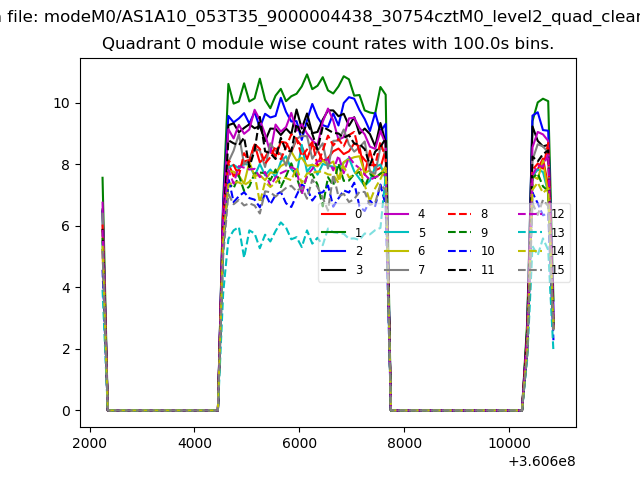 |
 |
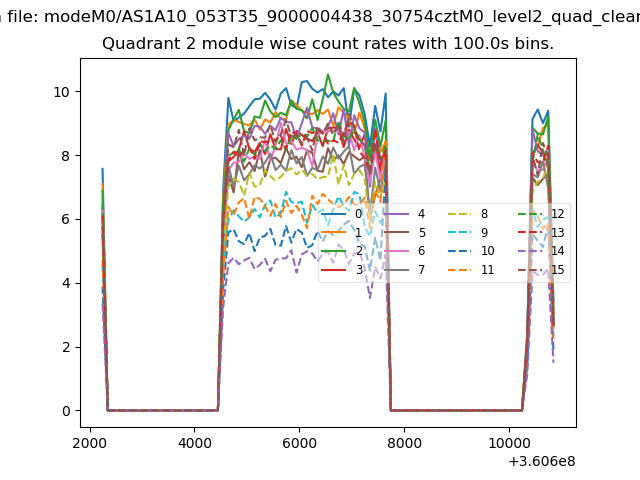
| Module-wise count rates for Quadrant B Data is divided into 100 sec bins |
 |
 |
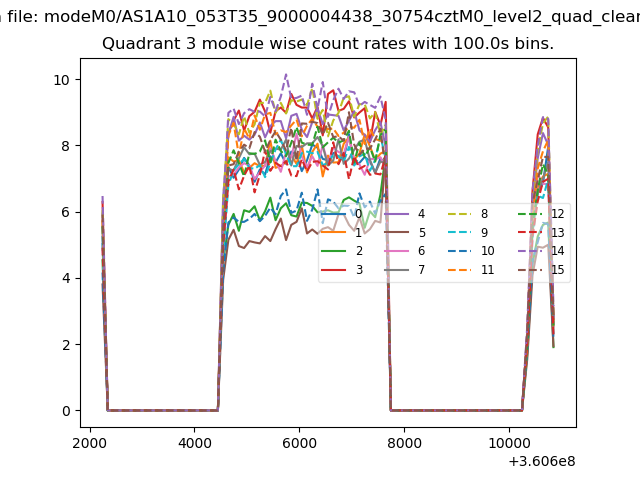
| Module-wise count rates for Quadrant C Data is divided into 100 sec bins |
 |
 |
| Module-wise count rates for Quadrant D Data is divided into 100 sec bins |
 |
 |
| Parameter | Plot |
|---|---|
| CZT HV Monitor | 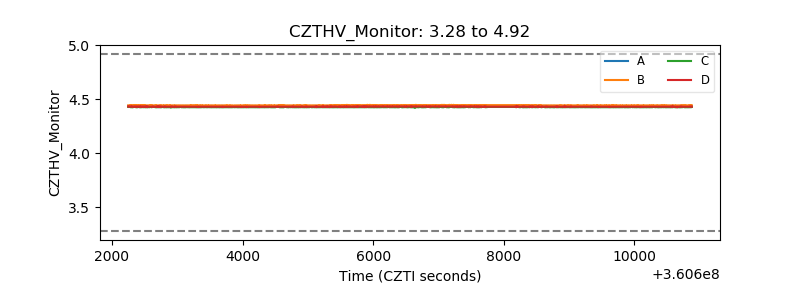 |
| D_VDD | 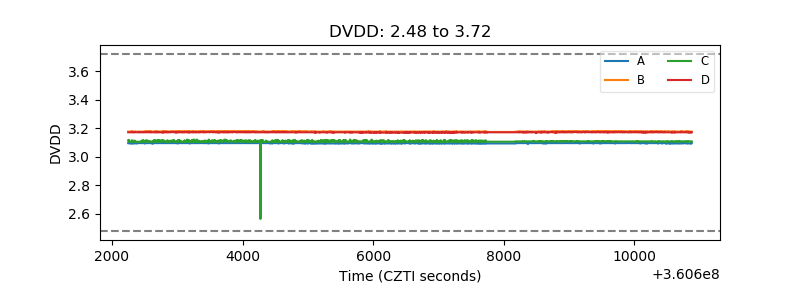 |
| Temperature 1 | 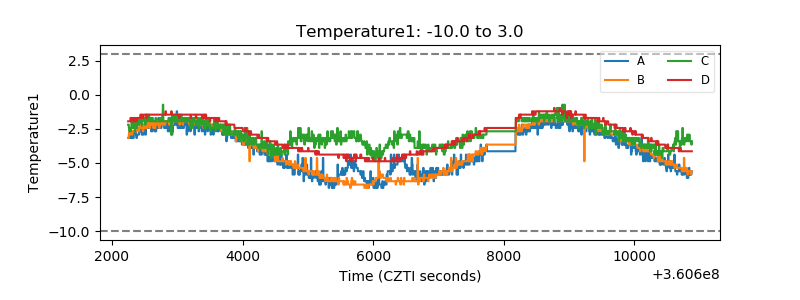 |
| Veto HV Monitor | 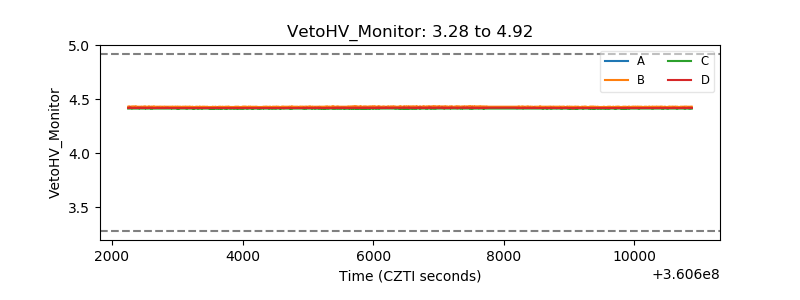 |
| Veto LLD | 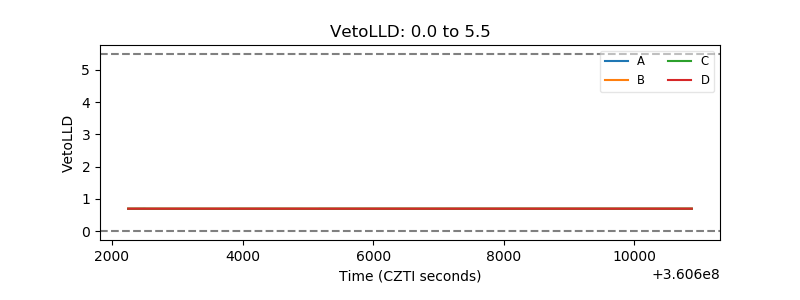 |
| Alpha Counter | 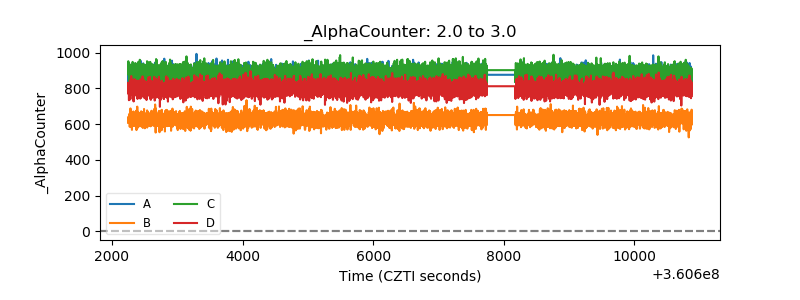 |
| _CPM_Rate | 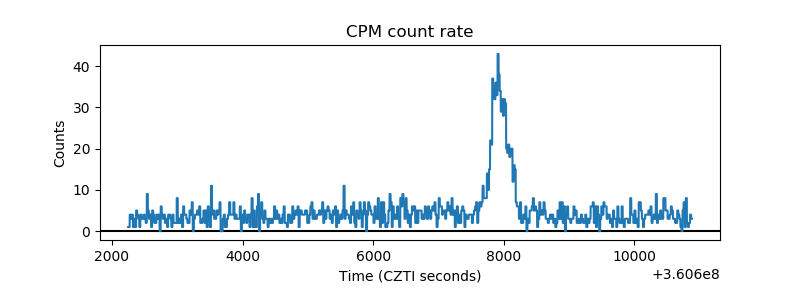 |
| CZT Counter | 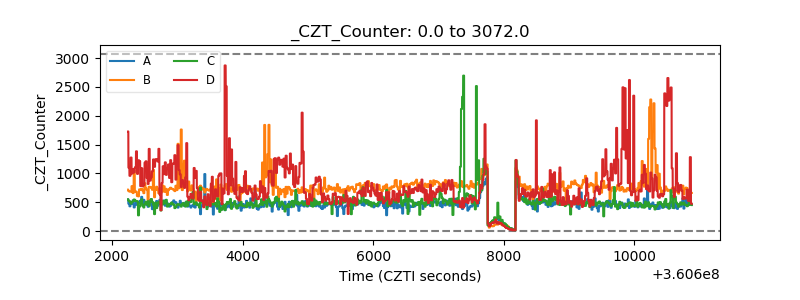 |
| +2.5 Volts monitor |  |
| +5 Volts monitor | 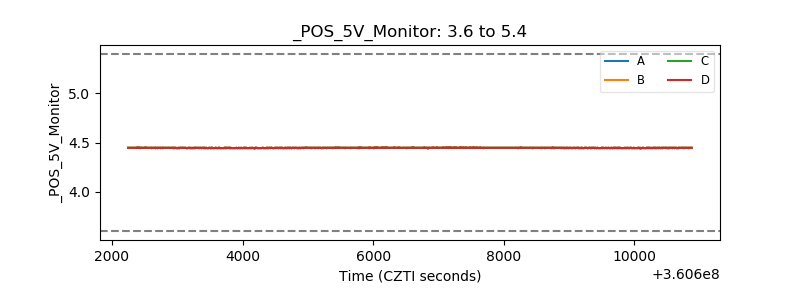 |
| _ROLL_ROT | 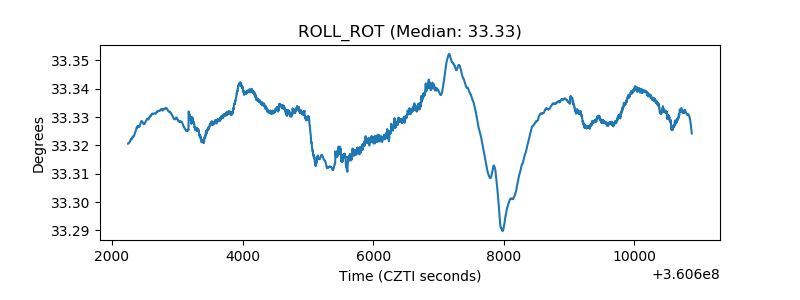 |
| _Roll_DEC | 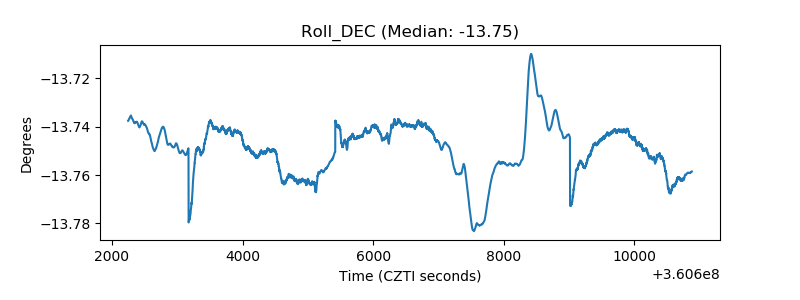 |
| _Roll_RA | 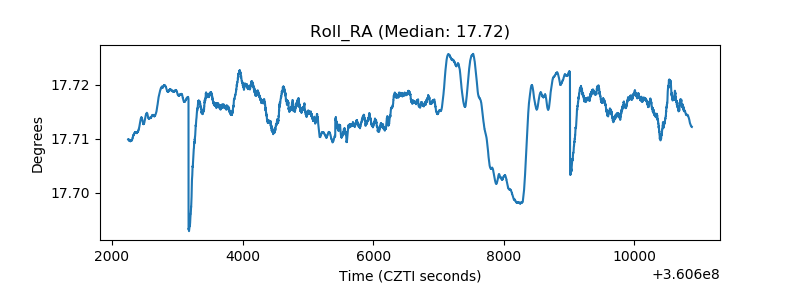 |
| Veto Counter | 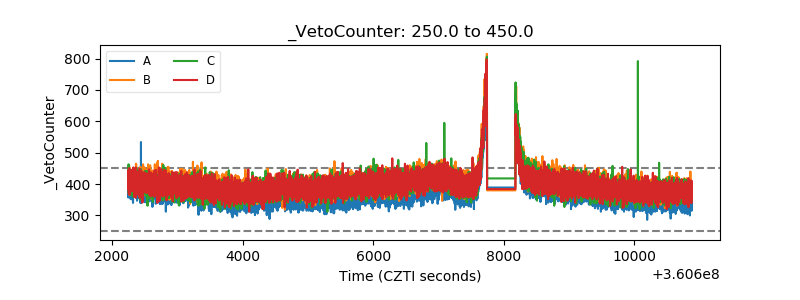 |