| Param | Original file | Final file |
|---|---|---|
| Filename | modeM0/AS1A10_053T25_9000004440cztM0_level2.fits | modeM0/AS1A10_053T25_9000004440cztM0_level2_quad_clean.evt |
| Size (bytes) | 82,946,880 | 70,992,000 |
| Size | 79.1 MB | 67.7 MB |
| Events in quadrant A | 510,636 | 414,737 |
| Events in quadrant B | 478,576 | 400,896 |
| Events in quadrant C | 495,716 | 389,599 |
| Events in quadrant D | 428,496 | 345,286 |
| Mode M0 | |||
|---|---|---|---|
| Quadrant | BADHDUFLAG | Total packets | Discarded packets |
| A | 0 | 19545 | 0 |
| B | 0 | 27830 | 0 |
| C | 0 | 19100 | 0 |
| D | 0 | 28623 | 0 |
| Mode M9 | |||
|---|---|---|---|
| Quadrant | BADHDUFLAG | Total packets | Discarded packets |
| A | 0 | 14 | 0 |
| B | 0 | 14 | 0 |
| C | 0 | 14 | 0 |
| D | 0 | 14 | 0 |
| Mode SS | |||
|---|---|---|---|
| Quadrant | BADHDUFLAG | Total packets | Discarded packets |
| A | 0 | 174 | 0 |
| B | 0 | 174 | 0 |
| C | 0 | 174 | 0 |
| D | 0 | 174 | 0 |
| Quadrant | Total seconds | Saturated seconds | Saturation percentage |
|---|---|---|---|
| A | 8629 | 159 | 1.842624% |
| B | 8629 | 296 | 3.430293% |
| C | 8629 | 205 | 2.375710% |
| D | 8629 | 353 | 4.090856% |
Noise dominated data is calculated using 1-second bins in cleaned event files. If a bin has >2000 counts, and if more than 50% of those come from <1% of pixels, then it is considered to be noise-dominated and hence unusable.
| Quadrant | # 1 sec bins | Bins with >0 counts | Bins with >2000 counts | High rate bins dominated by noise | Noise dominated (total time) | Noise dominated (detector-on time) | Marked lightcurve |
|---|---|---|---|---|---|---|---|
| A | 9938 | 8626 | 0 | 0 | 0.00% | 0.00% | 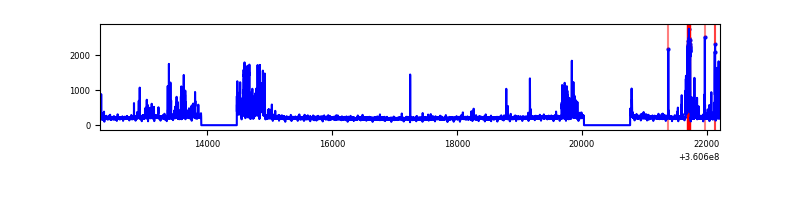 |
| B | 9939 | 8625 | 0 | 0 | 0.00% | 0.00% |  |
| C | 9939 | 8627 | 0 | 0 | 0.00% | 0.00% |  |
| D | 9939 | 8627 | 0 | 0 | 0.00% | 0.00% |  |
Top three noisy pixels from each quadrant. If the there are fewer than three noisy pixels in the level2.evt file, extra rows are filled as -1
| Pixel properties | Quadrant properties | ||||||
|---|---|---|---|---|---|---|---|
| Quadrant | DetID | PixID | Counts | Sigma | Mean | Median | Sigma |
| A | 7 | 110 | 425 | 8.52 | 133 | 125 | 35.2 |
| A | 0 | 29 | 422 | 8.43 | 133 | 125 | 35.2 |
| A | 14 | 95 | 402 | 7.86 | 133 | 125 | 35.2 |
| B | 2 | 9 | 395 | 9.92 | 126 | 121 | 27.6 |
| B | 5 | 128 | 343 | 8.04 | 126 | 121 | 27.6 |
| B | 5 | 225 | 327 | 7.46 | 126 | 121 | 27.6 |
| C | 1 | 81 | 377 | 7.24 | 131 | 122 | 35.2 |
| C | 12 | 241 | 373 | 7.13 | 131 | 122 | 35.2 |
| C | 1 | 80 | 364 | 6.87 | 131 | 122 | 35.2 |
| D | 15 | 46 | 348 | 6.9 | 122 | 111 | 34.3 |
| D | 3 | 14 | 336 | 6.55 | 122 | 111 | 34.3 |
| D | 3 | 31 | 321 | 6.12 | 122 | 111 | 34.3 |
Histogram calculated using DETX and DETY for each event in the final _common_clean file
| Quadrant A | 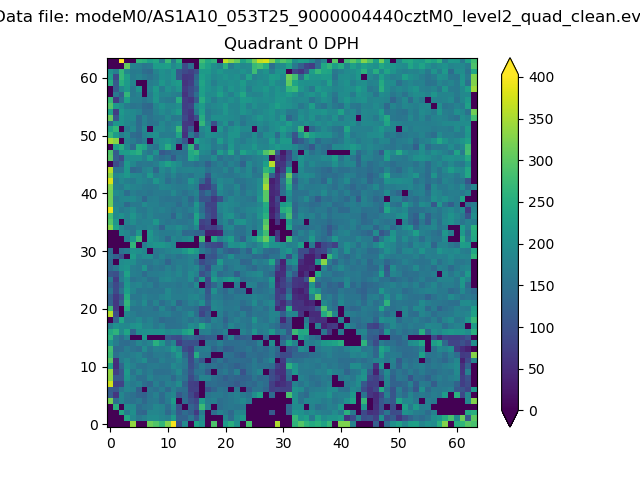 |
 |
Quadrant B |
|---|---|---|---|
| Quadrant D | 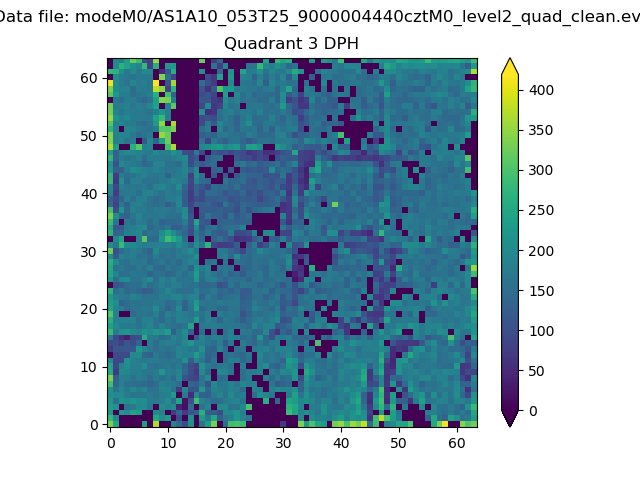 |
 |
Quadrant C |
| Plot type | Count rate plots | Images |
|---|---|---|
| Comparison with Poisson distribution Blue bars denote a histogram of data divided into 1 sec bins. Red curve is a Poisson curve with rate = median count rate of data. |
 |
 |
| Quadrant-wise count rates Data is divided into 100 sec bins |
 |
|
| Module-wise count rates for Quadrant A Data is divided into 100 sec bins |
 |
 |
| Module-wise count rates for Quadrant B Data is divided into 100 sec bins |
 |
 |
| Module-wise count rates for Quadrant C Data is divided into 100 sec bins |
 |
 |
| Module-wise count rates for Quadrant D Data is divided into 100 sec bins |
 |
 |
| Parameter | Plot |
|---|---|
| CZT HV Monitor |  |
| D_VDD |  |
| Temperature 1 | 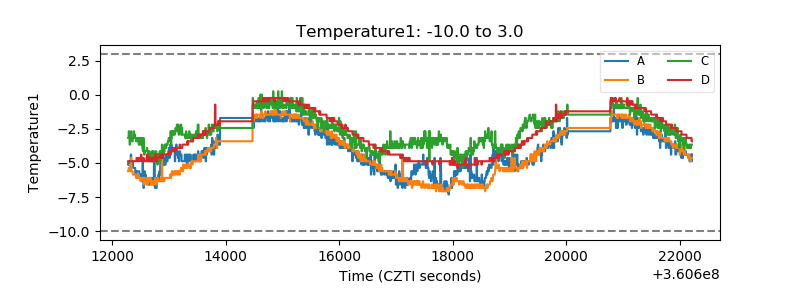 |
| Veto HV Monitor |  |
| Veto LLD |  |
| Alpha Counter |  |
| _CPM_Rate |  |
| CZT Counter |  |
| +2.5 Volts monitor |  |
| +5 Volts monitor |  |
| _ROLL_ROT |  |
| _Roll_DEC |  |
| _Roll_RA |  |
| Veto Counter |  |