| Param | Original file | Final file |
|---|---|---|
| Filename | modeM0/AS1A10_053T25_9000004440_30754cztM0_level2.evt | modeM0/AS1A10_053T25_9000004440_30754cztM0_level2_quad_clean.evt |
| Size (bytes) | 820,310,400 | 101,963,520 |
| Size | 782.3 MB | 97.2 MB |
| Events in quadrant A | 4,716,041 | 646,907 |
| Events in quadrant B | 7,385,316 | 634,880 |
| Events in quadrant C | 4,594,271 | 616,410 |
| Events in quadrant D | 7,566,277 | 590,667 |
| Mode M0 | |||
|---|---|---|---|
| Quadrant | BADHDUFLAG | Total packets | Discarded packets |
| A | 0 | 19547 | 2 |
| B | 0 | 27832 | 2 |
| C | 0 | 19102 | 2 |
| D | 0 | 28625 | 2 |
| Mode M9 | |||
|---|---|---|---|
| Quadrant | BADHDUFLAG | Total packets | Discarded packets |
| A | 0 | 14 | 0 |
| B | 0 | 14 | 0 |
| C | 0 | 14 | 0 |
| D | 0 | 14 | 0 |
| Mode SS | |||
|---|---|---|---|
| Quadrant | BADHDUFLAG | Total packets | Discarded packets |
| A | 0 | 174 | 0 |
| B | 0 | 174 | 0 |
| C | 0 | 174 | 0 |
| D | 0 | 174 | 0 |
| Quadrant | Total seconds | Saturated seconds | Saturation percentage |
|---|---|---|---|
| A | 8629 | 159 | 1.842624% |
| B | 8629 | 296 | 3.430293% |
| C | 8629 | 205 | 2.375710% |
| D | 8629 | 353 | 4.090856% |
Noise dominated data is calculated using 1-second bins in cleaned event files. If a bin has >2000 counts, and if more than 50% of those come from <1% of pixels, then it is considered to be noise-dominated and hence unusable.
| Quadrant | # 1 sec bins | Bins with >0 counts | Bins with >2000 counts | High rate bins dominated by noise | Noise dominated (total time) | Noise dominated (detector-on time) | Marked lightcurve |
|---|---|---|---|---|---|---|---|
| A | 9939 | 8629 | 69 | 69 | 0.69% | 0.80% | 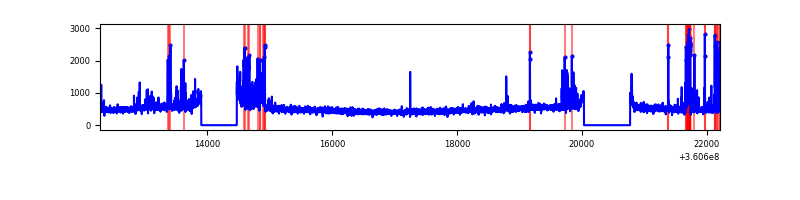 |
| B | 9939 | 8629 | 93 | 93 | 0.94% | 1.08% | 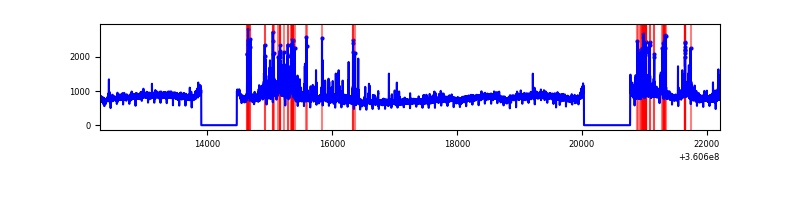 |
| C | 9939 | 8629 | 6 | 6 | 0.06% | 0.07% | 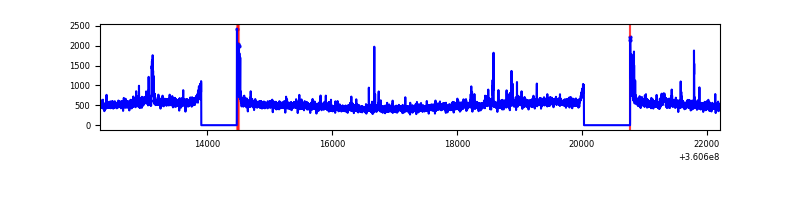 |
| D | 9939 | 8629 | 279 | 279 | 2.81% | 3.23% | 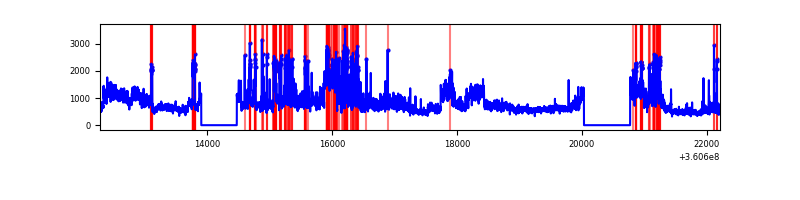 |
Top three noisy pixels from each quadrant. If the there are fewer than three noisy pixels in the level2.evt file, extra rows are filled as -1
| Pixel properties | Quadrant properties | ||||||
|---|---|---|---|---|---|---|---|
| Quadrant | DetID | PixID | Counts | Sigma | Mean | Median | Sigma |
| A | 0 | 13 | 522162 | 2386.4 | 1085 | 1058 | 218.4 |
| A | 13 | 254 | 16679 | 71.54 | 1085 | 1058 | 218.4 |
| A | 3 | 137 | 11111 | 46.04 | 1085 | 1058 | 218.4 |
| B | 6 | 159 | 2502488 | 12159.86 | 1065 | 1038 | 205.7 |
| B | 5 | 255 | 447148 | 2168.6 | 1065 | 1038 | 205.7 |
| B | 0 | 190 | 113522 | 546.8 | 1065 | 1038 | 205.7 |
| C | 3 | 233 | 288473 | 1178.97 | 1031 | 1037 | 243.8 |
| C | 14 | 238 | 168801 | 688.11 | 1031 | 1037 | 243.8 |
| C | 0 | 10 | 65693 | 265.2 | 1031 | 1037 | 243.8 |
| D | 8 | 195 | 2754451 | 10878.09 | 1038 | 1008 | 253.1 |
| D | 13 | 249 | 494483 | 1949.58 | 1038 | 1008 | 253.1 |
| D | 12 | 218 | 174514 | 685.47 | 1038 | 1008 | 253.1 |
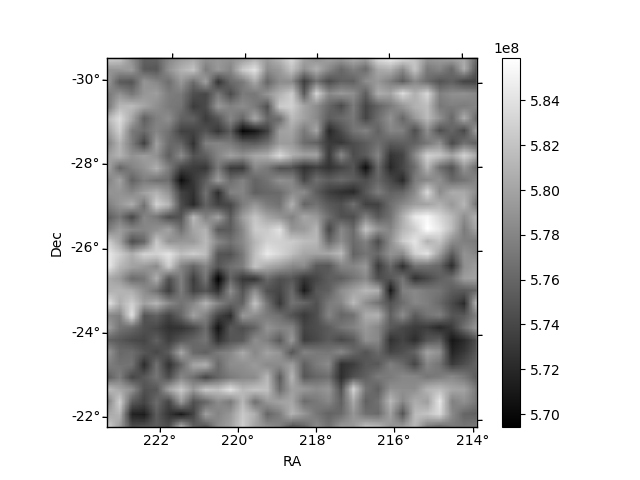
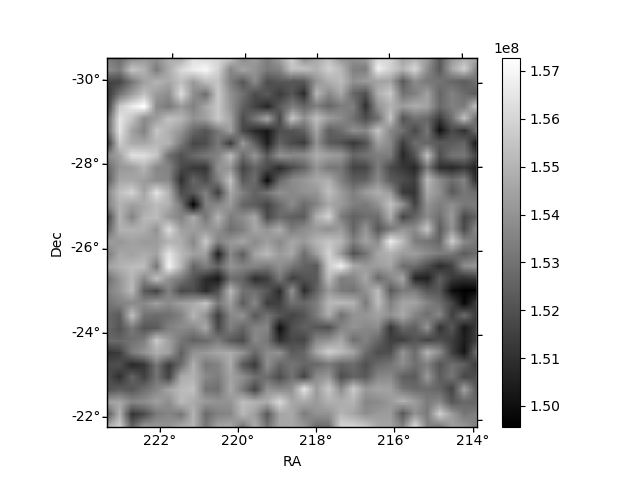
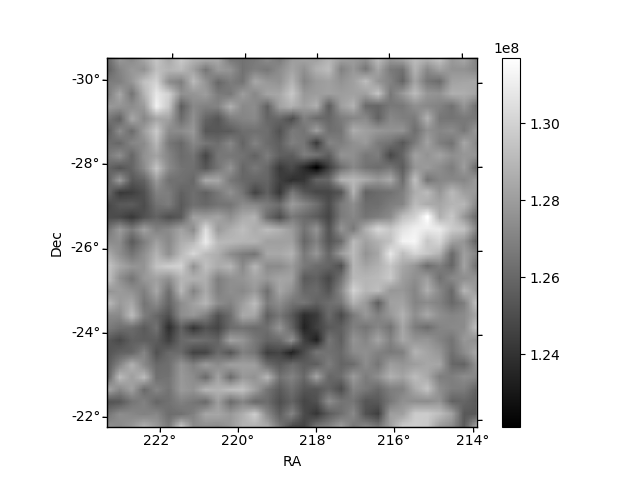
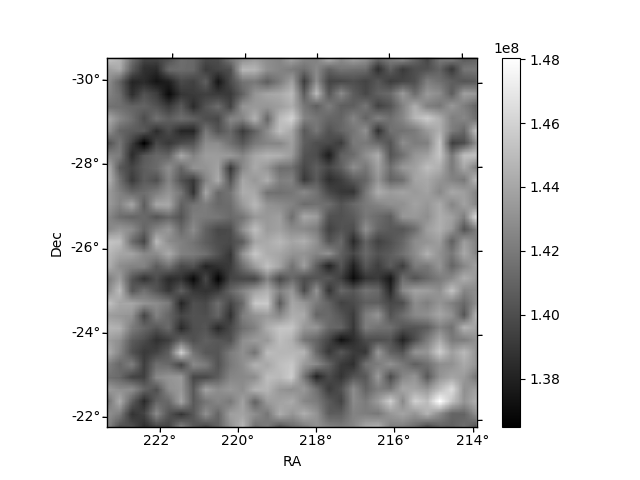
Histogram calculated using DETX and DETY for each event in the final _common_clean file
| Quadrant A | 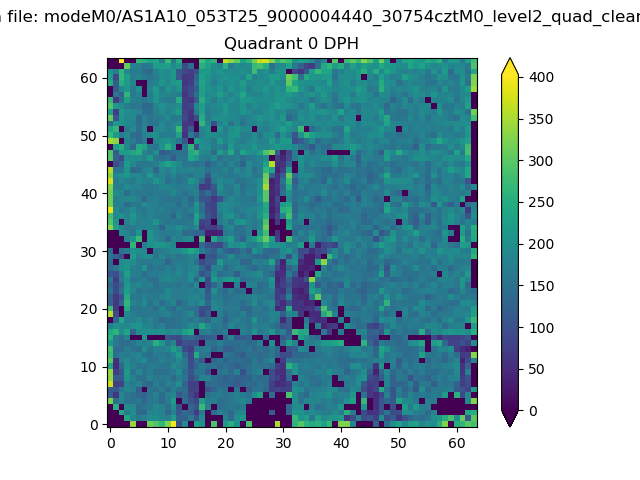 |
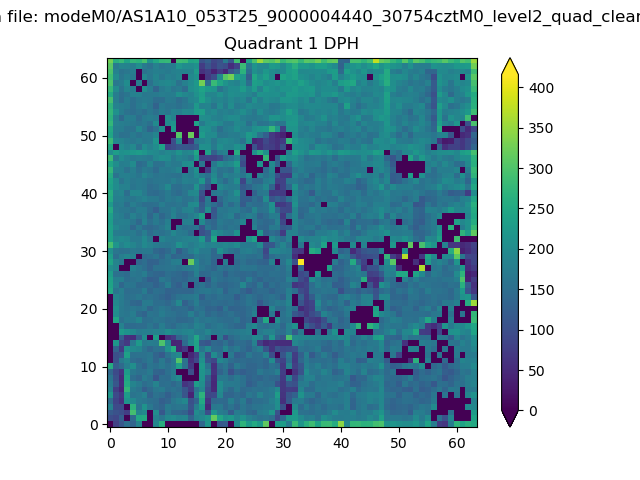 |
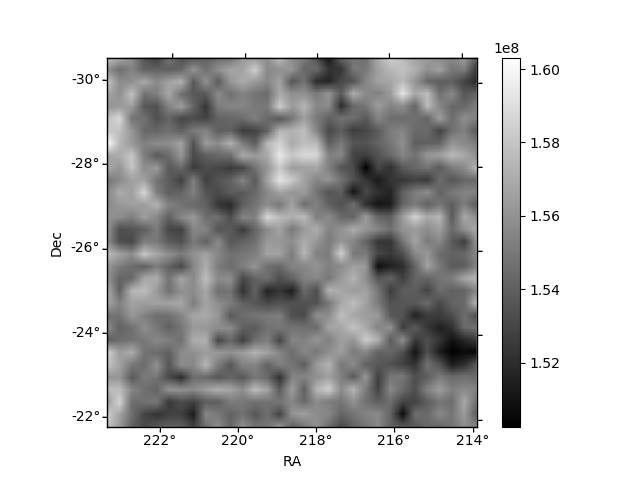
Quadrant B |
|---|---|---|---|
| Quadrant D | 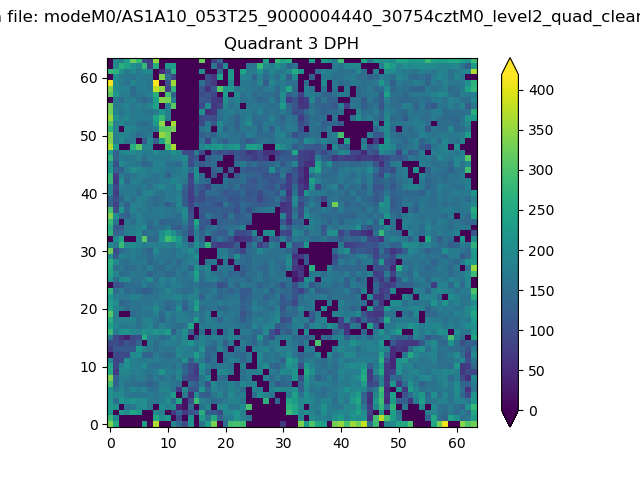 |
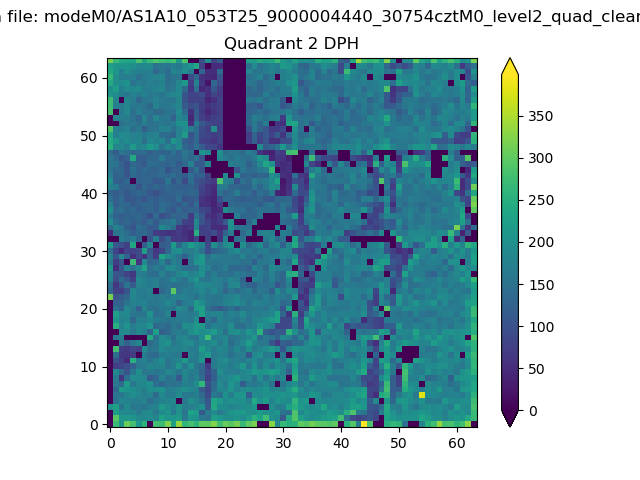 |
Quadrant C |
| Plot type | Count rate plots | Images |
|---|---|---|
| Comparison with Poisson distribution Blue bars denote a histogram of data divided into 1 sec bins. Red curve is a Poisson curve with rate = median count rate of data. |
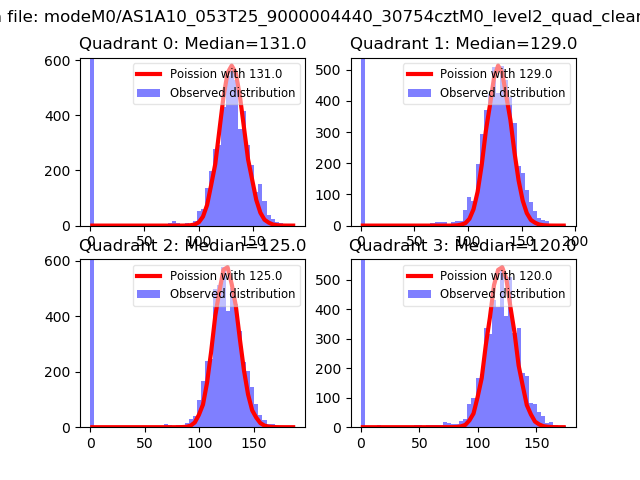 |
 |
| Quadrant-wise count rates Data is divided into 100 sec bins |
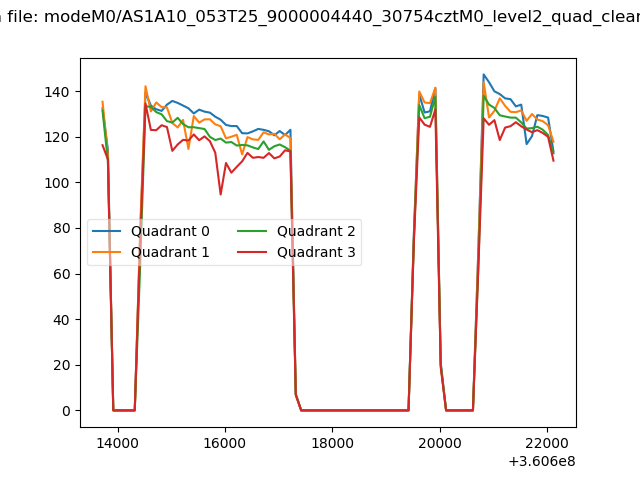 |
|
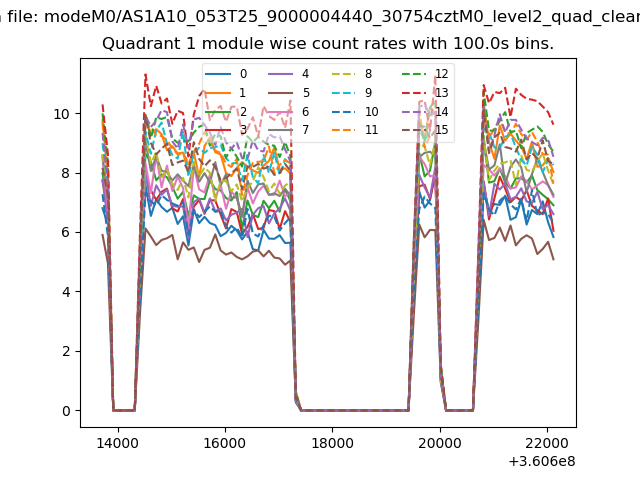
| Module-wise count rates for Quadrant A Data is divided into 100 sec bins |
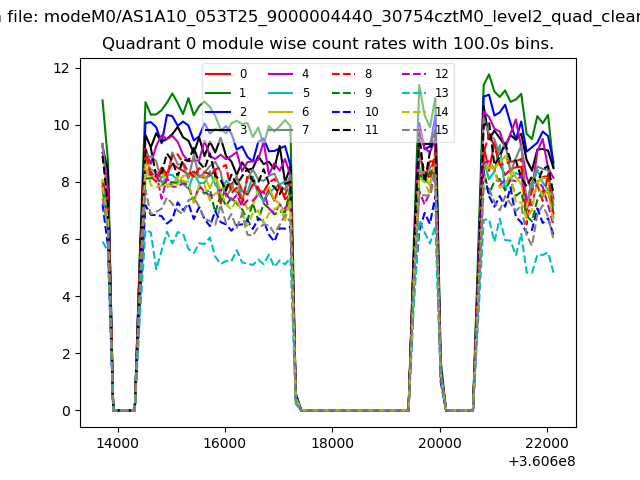 |
 |
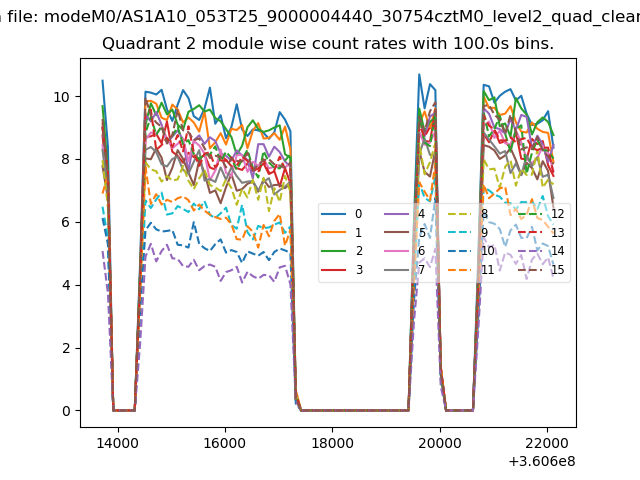
| Module-wise count rates for Quadrant B Data is divided into 100 sec bins |
 |
 |
| Module-wise count rates for Quadrant C Data is divided into 100 sec bins |
 |
 |
| Module-wise count rates for Quadrant D Data is divided into 100 sec bins |
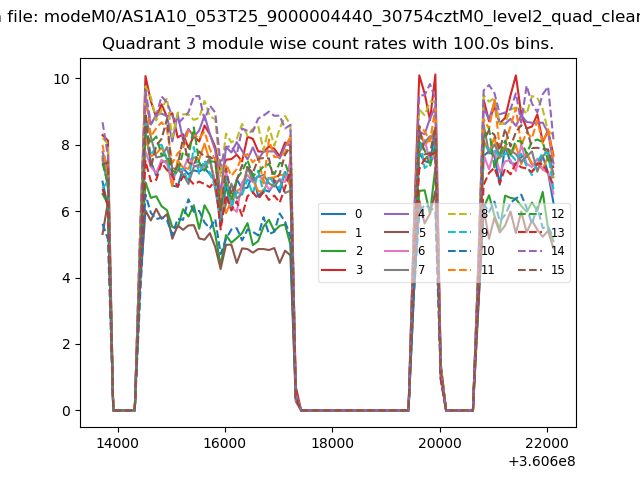 |
 |
| Parameter | Plot |
|---|---|
| CZT HV Monitor | 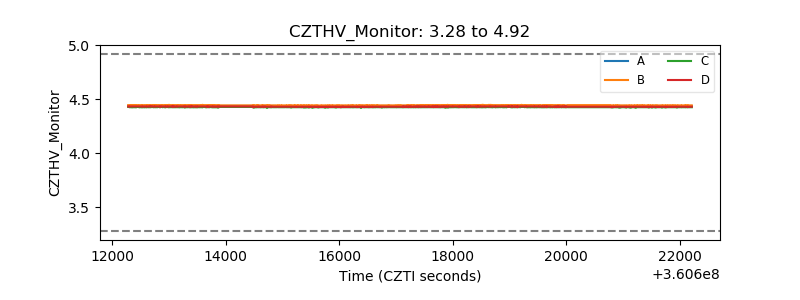 |
| D_VDD | 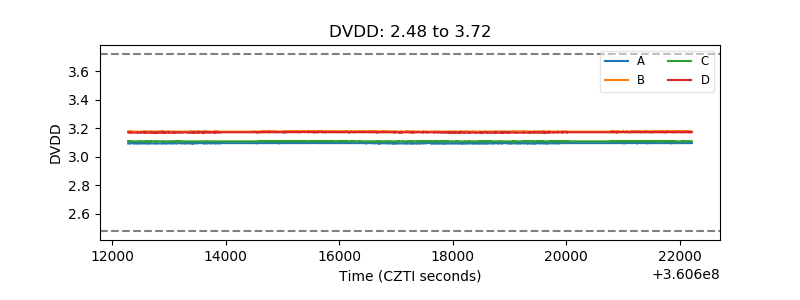 |
| Temperature 1 | 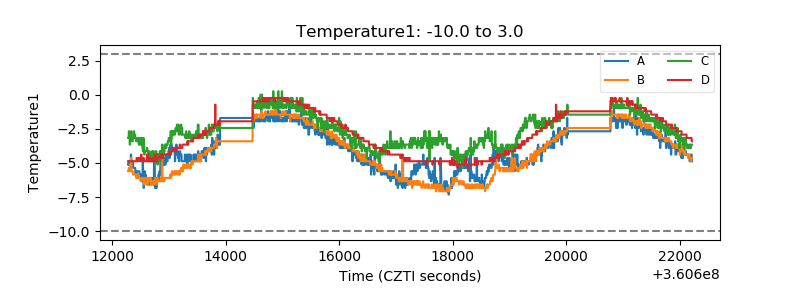 |
| Veto HV Monitor | 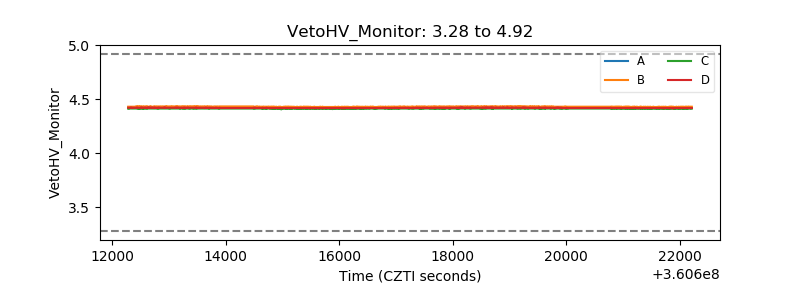 |
| Veto LLD | 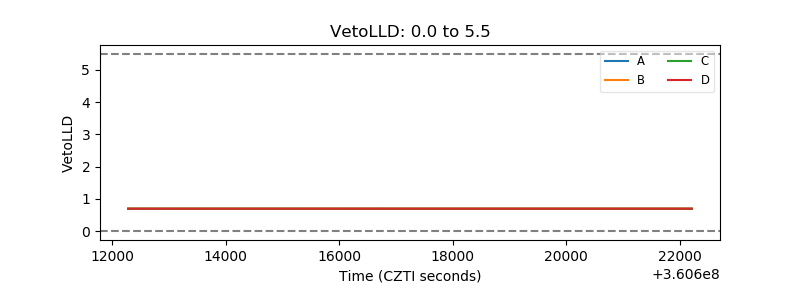 |
| Alpha Counter |  |
| _CPM_Rate |  |
| CZT Counter | 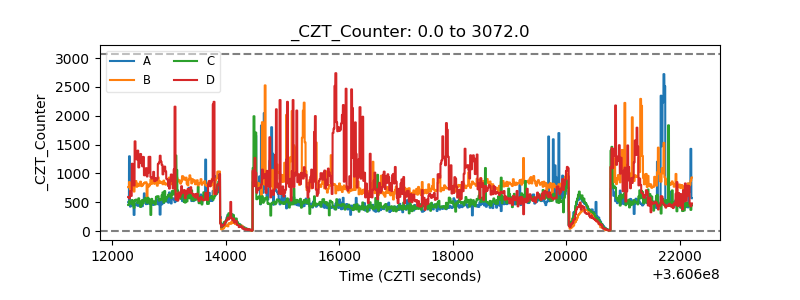 |
| +2.5 Volts monitor |  |
| +5 Volts monitor |  |
| _ROLL_ROT | 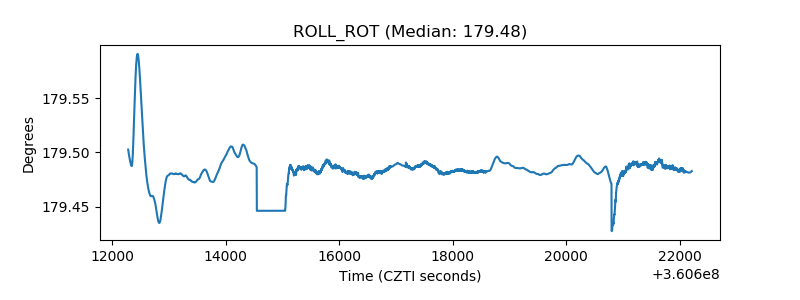 |
| _Roll_DEC | 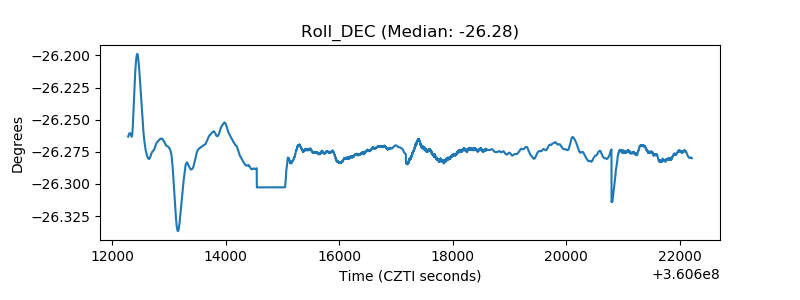 |
| _Roll_RA | 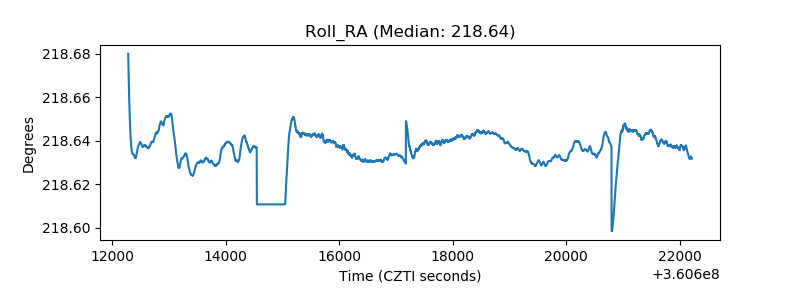 |
| Veto Counter | 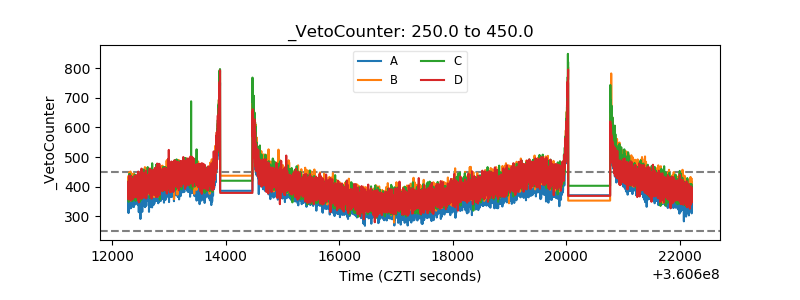 |