| Param | Original file | Final file |
|---|---|---|
| Filename | modeM0/AS1A10_053T36_9000004442cztM0_level2.fits | modeM0/AS1A10_053T36_9000004442cztM0_level2_quad_clean.evt |
| Size (bytes) | 136,448,640 | 124,344,000 |
| Size | 130.1 MB | 118.6 MB |
| Events in quadrant A | 853,120 | 739,732 |
| Events in quadrant B | 793,286 | 725,280 |
| Events in quadrant C | 808,830 | 707,243 |
| Events in quadrant D | 739,896 | 655,661 |
| Mode SS | |||
|---|---|---|---|
| Quadrant | BADHDUFLAG | Total packets | Discarded packets |
| A | 0 | 278 | 0 |
| B | 0 | 278 | 0 |
| C | 0 | 278 | 0 |
| D | 0 | 278 | 0 |
| Mode M0 | |||
|---|---|---|---|
| Quadrant | BADHDUFLAG | Total packets | Discarded packets |
| A | 0 | 29072 | 0 |
| B | 0 | 43184 | 0 |
| C | 0 | 29756 | 0 |
| D | 0 | 34430 | 0 |
| Mode M9 | |||
|---|---|---|---|
| Quadrant | BADHDUFLAG | Total packets | Discarded packets |
| A | 0 | 32 | 0 |
| B | 0 | 32 | 0 |
| C | 0 | 32 | 0 |
| D | 0 | 32 | 0 |
| Quadrant | Total seconds | Saturated seconds | Saturation percentage |
|---|---|---|---|
| A | 13567 | 110 | 0.810791% |
| B | 13567 | 450 | 3.316872% |
| C | 13567 | 667 | 4.916341% |
| D | 13567 | 191 | 1.407828% |
Noise dominated data is calculated using 1-second bins in cleaned event files. If a bin has >2000 counts, and if more than 50% of those come from <1% of pixels, then it is considered to be noise-dominated and hence unusable.
| Quadrant | # 1 sec bins | Bins with >0 counts | Bins with >2000 counts | High rate bins dominated by noise | Noise dominated (total time) | Noise dominated (detector-on time) | Marked lightcurve |
|---|---|---|---|---|---|---|---|
| A | 16747 | 13564 | 0 | 0 | 0.00% | 0.00% | 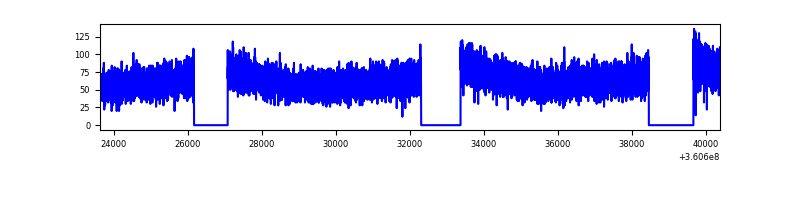 |
| B | 16747 | 13564 | 0 | 0 | 0.00% | 0.00% | 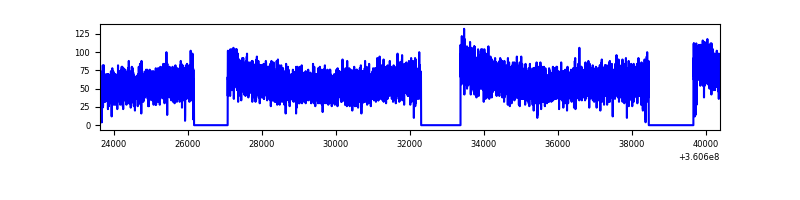 |
| C | 16747 | 13510 | 0 | 0 | 0.00% | 0.00% | 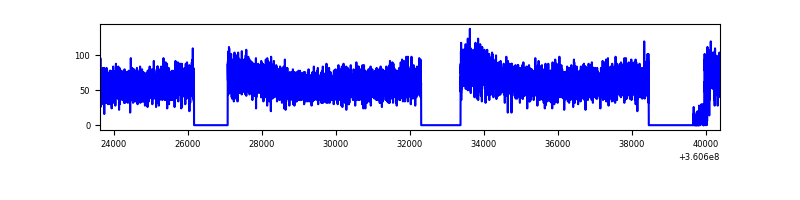 |
| D | 16747 | 13563 | 0 | 0 | 0.00% | 0.00% | 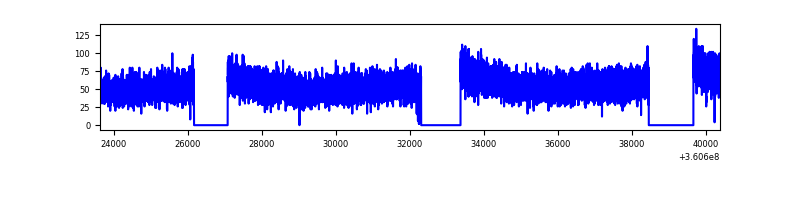 |
Top three noisy pixels from each quadrant. If the there are fewer than three noisy pixels in the level2.evt file, extra rows are filled as -1
| Pixel properties | Quadrant properties | ||||||
|---|---|---|---|---|---|---|---|
| Quadrant | DetID | PixID | Counts | Sigma | Mean | Median | Sigma |
| A | 0 | 29 | 718 | 9.04 | 222 | 209 | 56.3 |
| A | 0 | 30 | 636 | 7.58 | 222 | 209 | 56.3 |
| A | 14 | 95 | 633 | 7.53 | 222 | 209 | 56.3 |
| B | 2 | 9 | 603 | 9.16 | 210 | 200 | 44.0 |
| B | 3 | 17 | 547 | 7.89 | 210 | 200 | 44.0 |
| B | 2 | 8 | 531 | 7.52 | 210 | 200 | 44.0 |
| C | 3 | 202 | 644 | 7.91 | 213 | 201 | 56.0 |
| C | 3 | 203 | 597 | 7.07 | 213 | 201 | 56.0 |
| C | 2 | 191 | 572 | 6.62 | 213 | 201 | 56.0 |
| D | 15 | 46 | 574 | 6.58 | 211 | 192 | 58.1 |
| D | 10 | 189 | 539 | 5.98 | 211 | 192 | 58.1 |
| D | 6 | 231 | 539 | 5.98 | 211 | 192 | 58.1 |
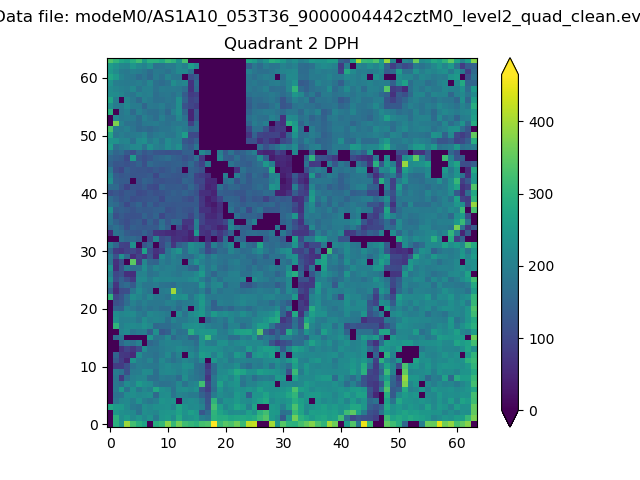
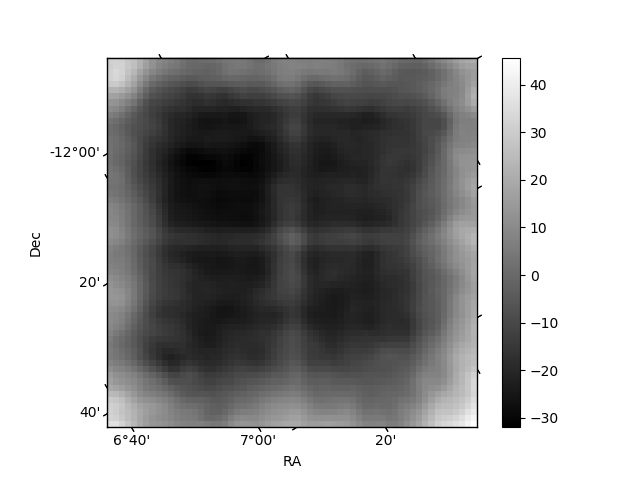
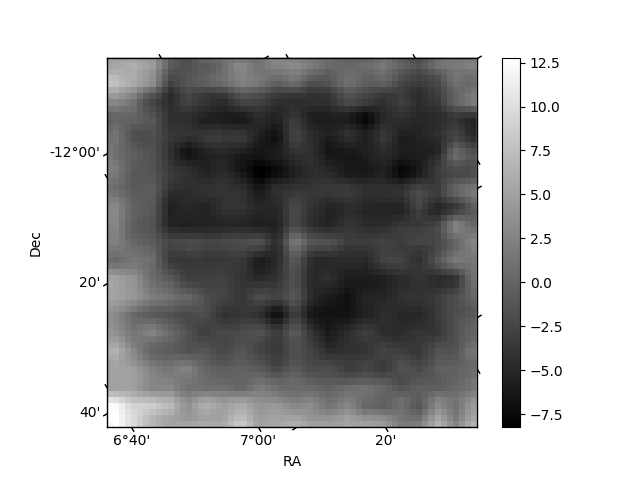
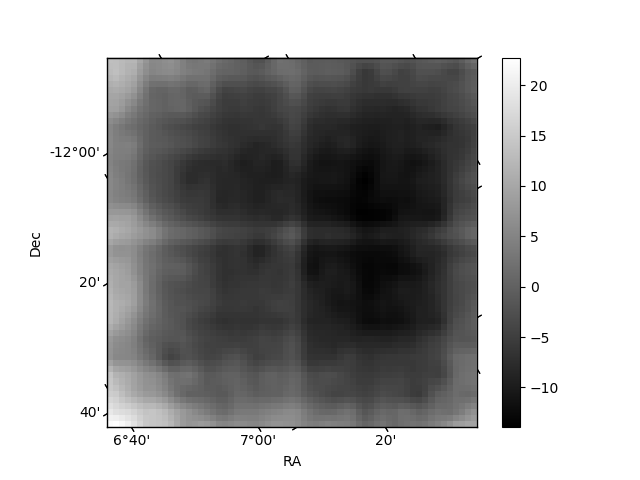
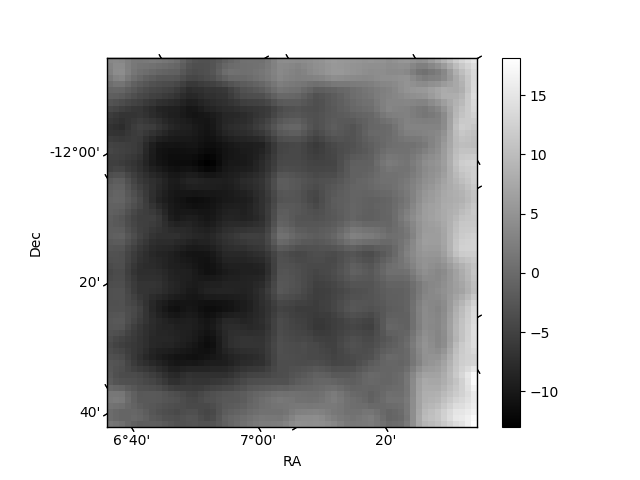
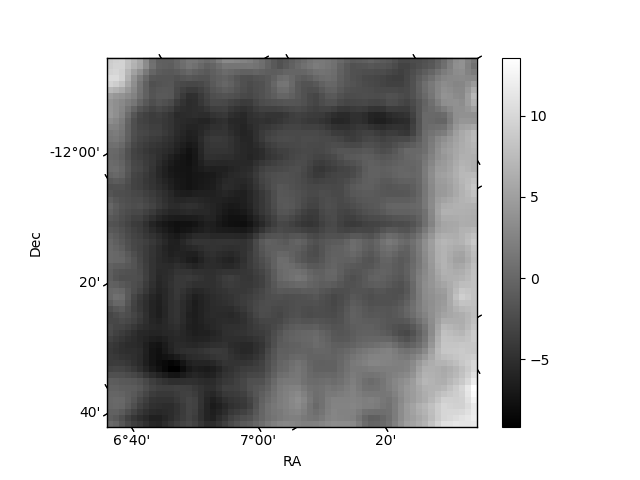
Histogram calculated using DETX and DETY for each event in the final _common_clean file
| Quadrant A | 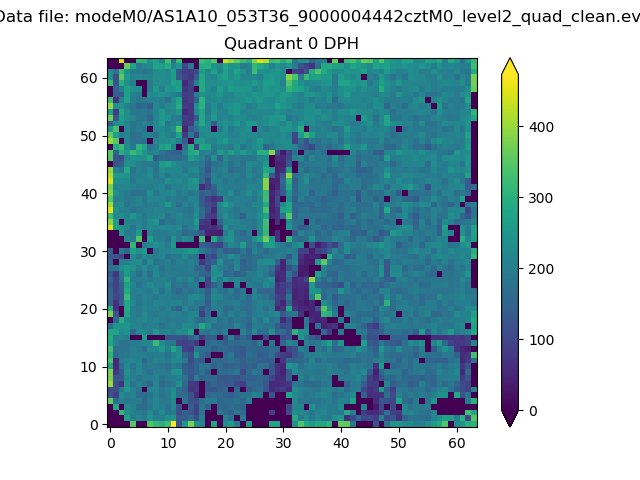 |
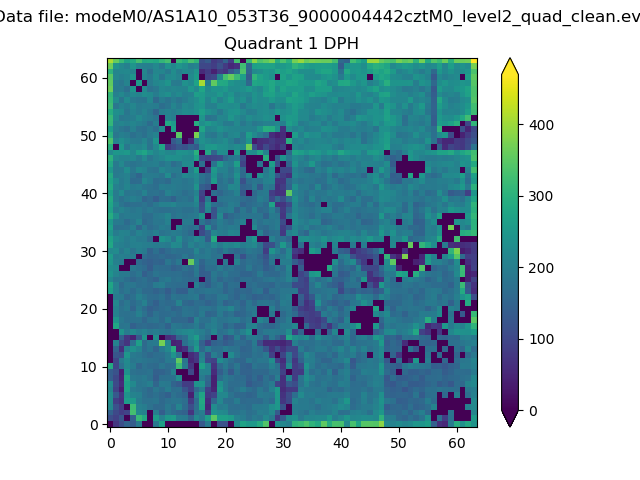 |
Quadrant B |
|---|---|---|---|
| Quadrant D | 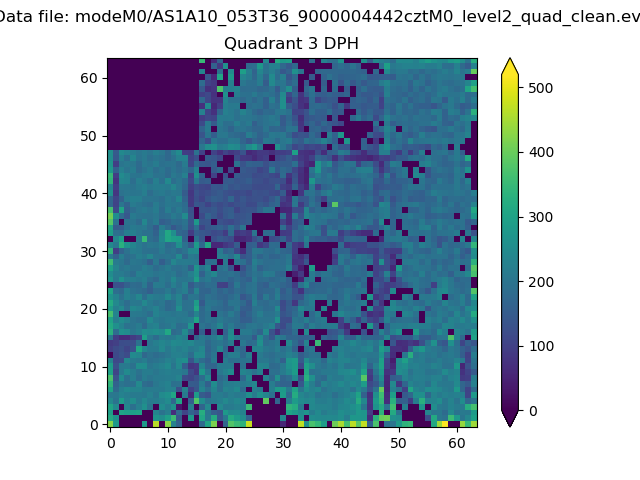 |
 |
Quadrant C |
| Plot type | Count rate plots | Images |
|---|---|---|
| Comparison with Poisson distribution Blue bars denote a histogram of data divided into 1 sec bins. Red curve is a Poisson curve with rate = median count rate of data. |
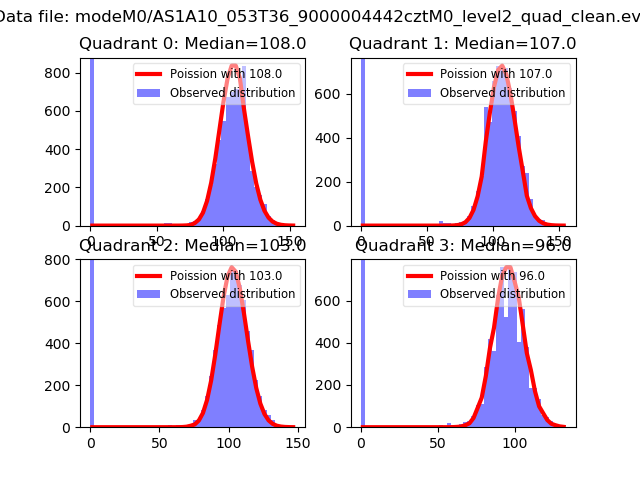 |
 |
| Quadrant-wise count rates Data is divided into 100 sec bins |
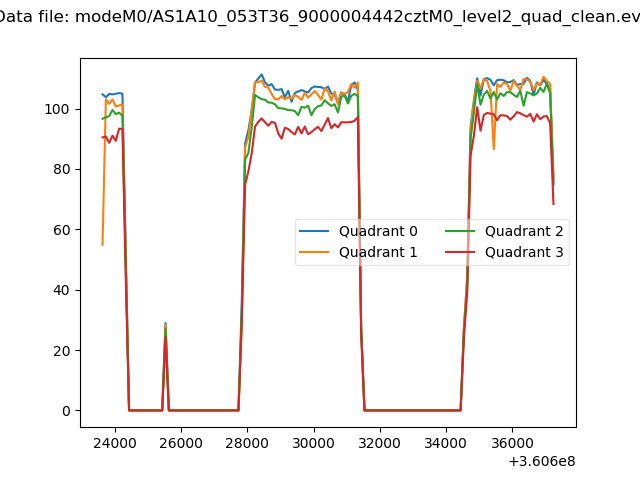 |
|
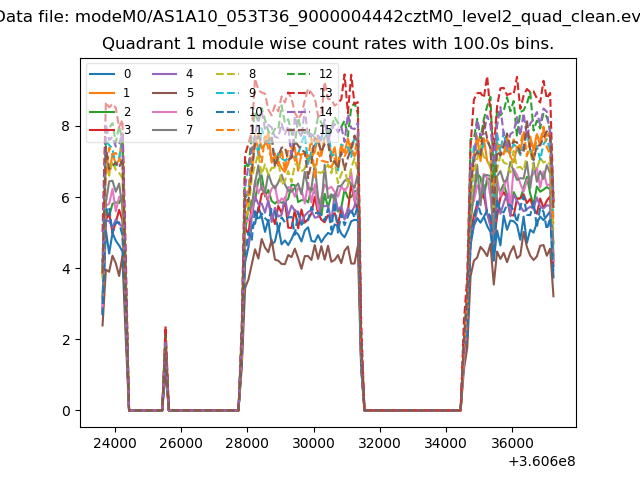
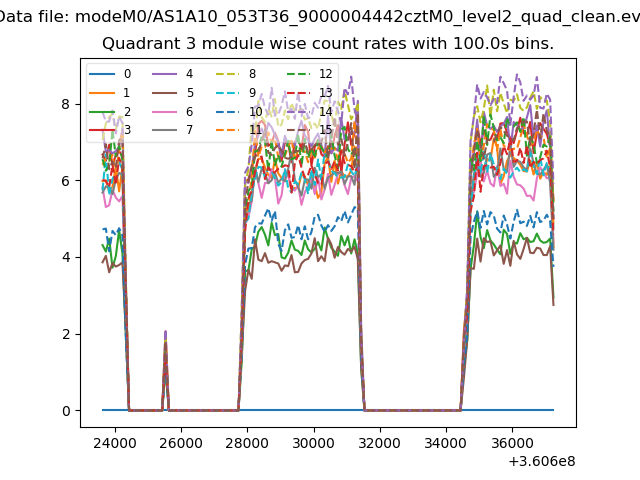
| Module-wise count rates for Quadrant A Data is divided into 100 sec bins |
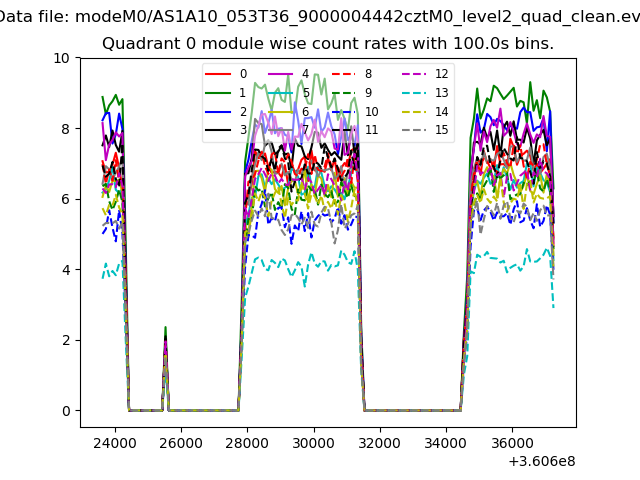 |
 |
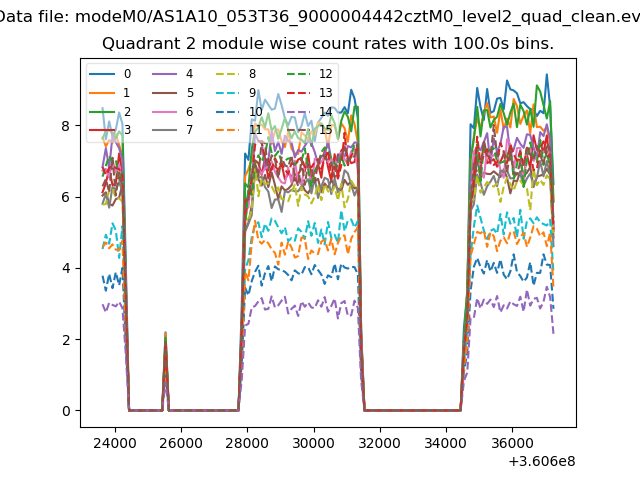
| Module-wise count rates for Quadrant B Data is divided into 100 sec bins |
 |
 |
| Module-wise count rates for Quadrant C Data is divided into 100 sec bins |
 |
 |
| Module-wise count rates for Quadrant D Data is divided into 100 sec bins |
 |
 |
| Parameter | Plot |
|---|---|
| CZT HV Monitor | 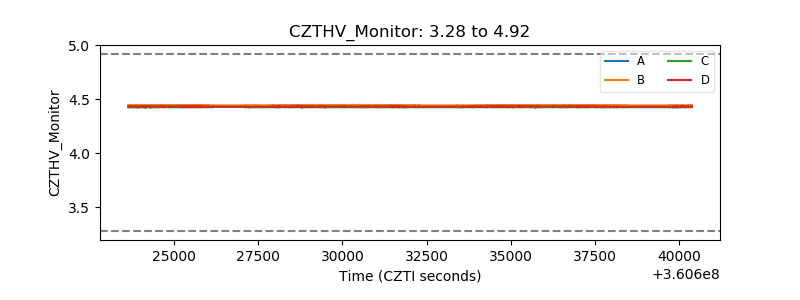 |
| D_VDD | 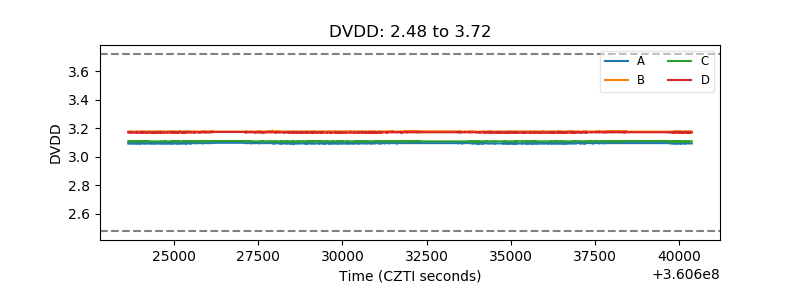 |
| Temperature 1 | 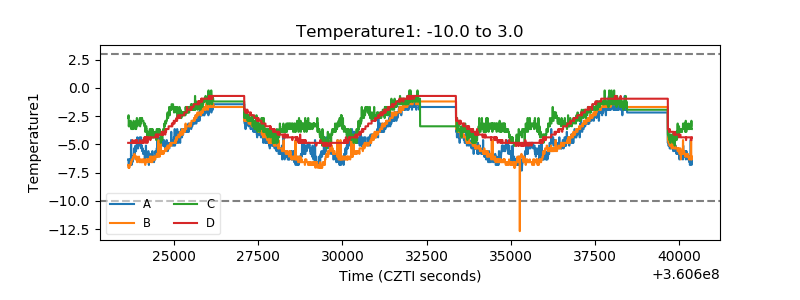 |
| Veto HV Monitor | 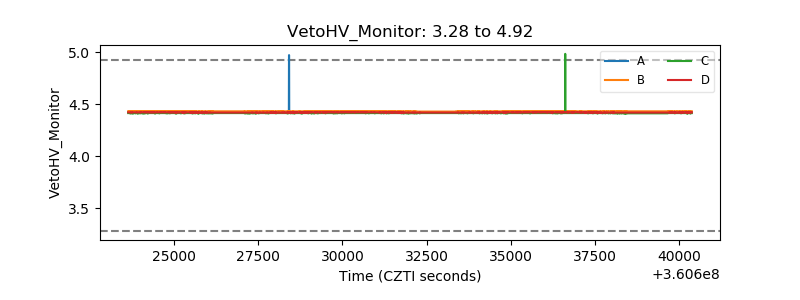 |
| Veto LLD | 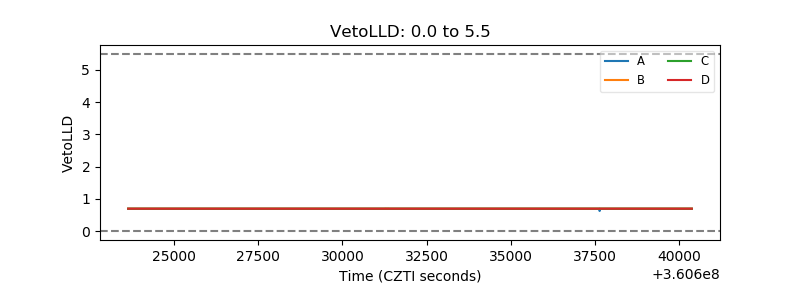 |
| Alpha Counter | 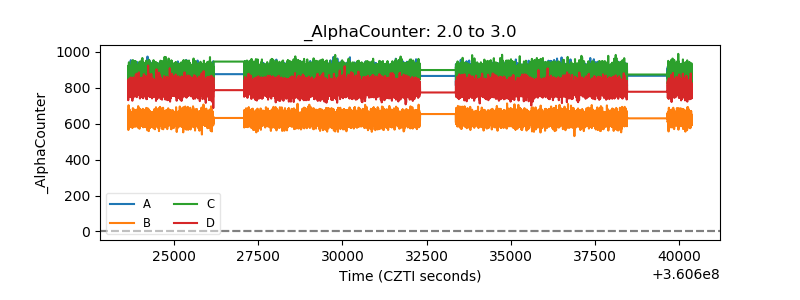 |
| _CPM_Rate | 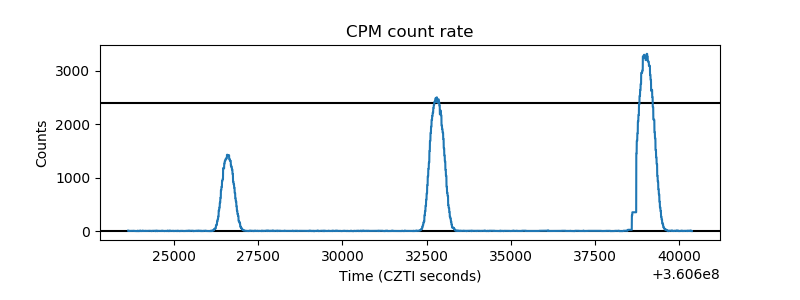 |
| CZT Counter | 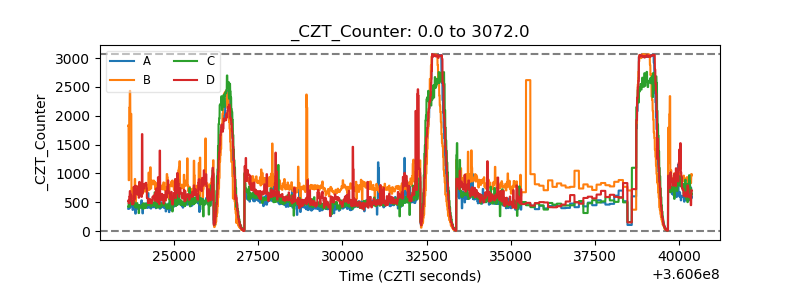 |
| +2.5 Volts monitor | 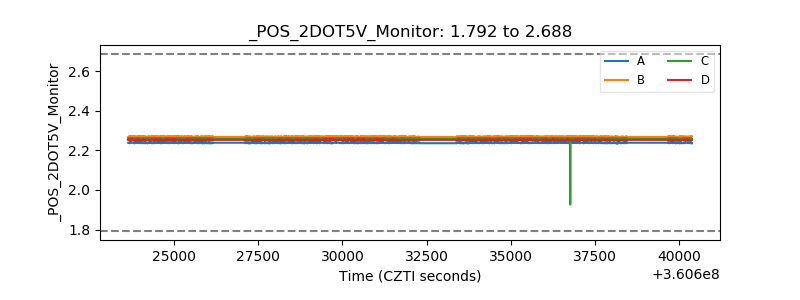 |
| +5 Volts monitor | 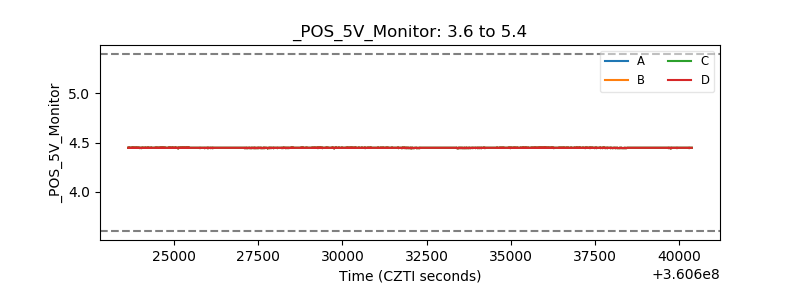 |
| _ROLL_ROT | 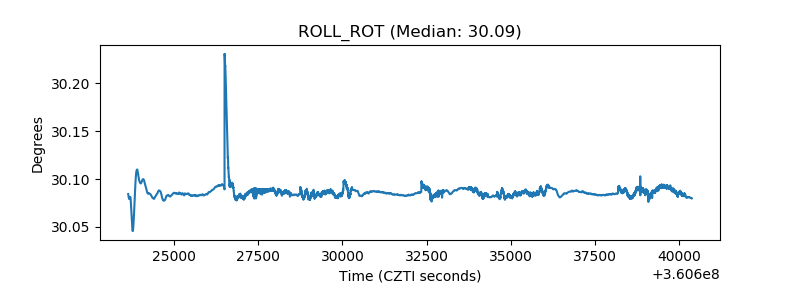 |
| _Roll_DEC |  |
| _Roll_RA | 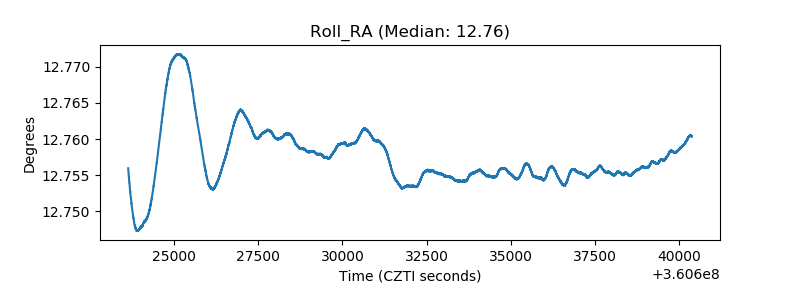 |
| Veto Counter | 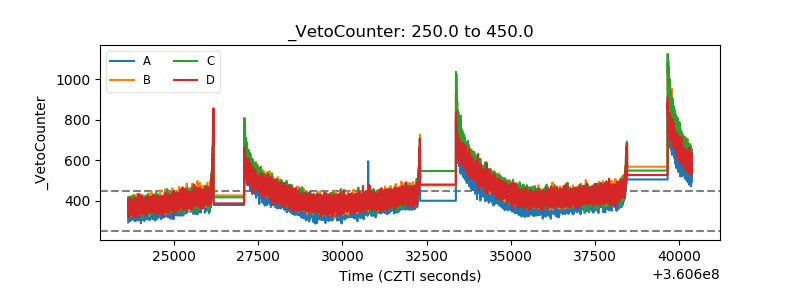 |