| Param | Original file | Final file |
|---|---|---|
| Filename | modeM0/AS1A10_053T37_9000004444cztM0_level2.fits | modeM0/AS1A10_053T37_9000004444cztM0_level2_quad_clean.evt |
| Size (bytes) | 354,170,880 | 181,074,240 |
| Size | 337.8 MB | 172.7 MB |
| Events in quadrant A | 2,229,758 | 827,289 |
| Events in quadrant B | 2,088,624 | 824,561 |
| Events in quadrant C | 2,167,778 | 795,140 |
| Events in quadrant D | 1,906,448 | 700,261 |
| Mode SS | |||
|---|---|---|---|
| Quadrant | BADHDUFLAG | Total packets | Discarded packets |
| A | 0 | 690 | 0 |
| B | 0 | 692 | 0 |
| C | 0 | 692 | 0 |
| D | 0 | 692 | 0 |
| Mode M0 | |||
|---|---|---|---|
| Quadrant | BADHDUFLAG | Total packets | Discarded packets |
| A | 0 | 71316 | 0 |
| B | 0 | 104240 | 0 |
| C | 0 | 74719 | 0 |
| D | 0 | 105425 | 0 |
| Mode M9 | |||
|---|---|---|---|
| Quadrant | BADHDUFLAG | Total packets | Discarded packets |
| A | 0 | 65 | 0 |
| B | 0 | 65 | 0 |
| C | 0 | 65 | 0 |
| D | 0 | 65 | 0 |
| Quadrant | Total seconds | Saturated seconds | Saturation percentage |
|---|---|---|---|
| A | 33979 | 336 | 0.988846% |
| B | 33951 | 729 | 2.147212% |
| C | 33969 | 789 | 2.322706% |
| D | 33946 | 1384 | 4.077064% |
Noise dominated data is calculated using 1-second bins in cleaned event files. If a bin has >2000 counts, and if more than 50% of those come from <1% of pixels, then it is considered to be noise-dominated and hence unusable.
| Quadrant | # 1 sec bins | Bins with >0 counts | Bins with >2000 counts | High rate bins dominated by noise | Noise dominated (total time) | Noise dominated (detector-on time) | Marked lightcurve |
|---|---|---|---|---|---|---|---|
| A | 40550 | 34000 | 0 | 0 | 0.00% | 0.00% |  |
| B | 40551 | 33967 | 0 | 0 | 0.00% | 0.00% |  |
| C | 40551 | 33989 | 0 | 0 | 0.00% | 0.00% |  |
| D | 40551 | 33956 | 0 | 0 | 0.00% | 0.00% |  |
Top three noisy pixels from each quadrant. If the there are fewer than three noisy pixels in the level2.evt file, extra rows are filled as -1
| Pixel properties | Quadrant properties | ||||||
|---|---|---|---|---|---|---|---|
| Quadrant | DetID | PixID | Counts | Sigma | Mean | Median | Sigma |
| A | 0 | 29 | 1835 | 9.18 | 581 | 549 | 140.0 |
| A | 7 | 110 | 1772 | 8.73 | 581 | 549 | 140.0 |
| A | 9 | 19 | 1662 | 7.95 | 581 | 549 | 140.0 |
| B | 2 | 9 | 1686 | 10.48 | 552 | 529 | 110.4 |
| B | 5 | 128 | 1445 | 8.3 | 552 | 529 | 110.4 |
| B | 3 | 17 | 1423 | 8.1 | 552 | 529 | 110.4 |
| C | 1 | 81 | 1707 | 8.0 | 573 | 540 | 145.9 |
| C | 1 | 80 | 1665 | 7.71 | 573 | 540 | 145.9 |
| C | 3 | 187 | 1506 | 6.62 | 573 | 540 | 145.9 |
| D | 15 | 46 | 1378 | 6.04 | 545 | 498 | 145.8 |
| D | 10 | 189 | 1334 | 5.73 | 545 | 498 | 145.8 |
| D | 3 | 14 | 1327 | 5.69 | 545 | 498 | 145.8 |
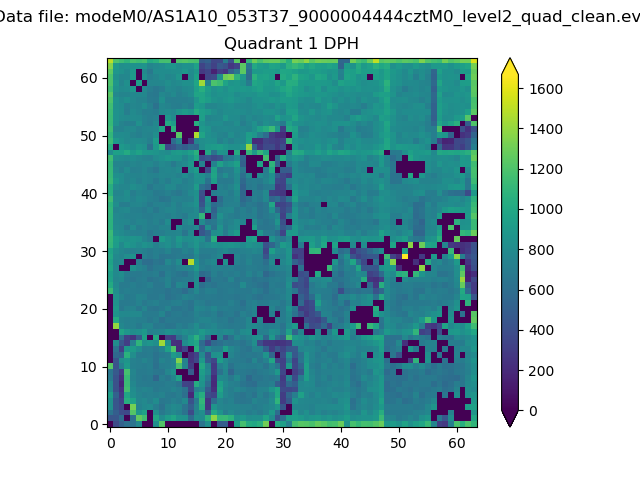
Histogram calculated using DETX and DETY for each event in the final _common_clean file
| Quadrant A |  |
 |
Quadrant B |
|---|---|---|---|
| Quadrant D |  |
 |
Quadrant C |
| Plot type | Count rate plots | Images |
|---|---|---|
| Comparison with Poisson distribution Blue bars denote a histogram of data divided into 1 sec bins. Red curve is a Poisson curve with rate = median count rate of data. |
 |
 |
| Quadrant-wise count rates Data is divided into 100 sec bins |
 |
|
| Module-wise count rates for Quadrant A Data is divided into 100 sec bins |
 |
 |
| Module-wise count rates for Quadrant B Data is divided into 100 sec bins |
 |
 |
| Module-wise count rates for Quadrant C Data is divided into 100 sec bins |
 |
 |
| Module-wise count rates for Quadrant D Data is divided into 100 sec bins |
 |
 |
| Parameter | Plot |
|---|---|
| CZT HV Monitor |  |
| D_VDD | 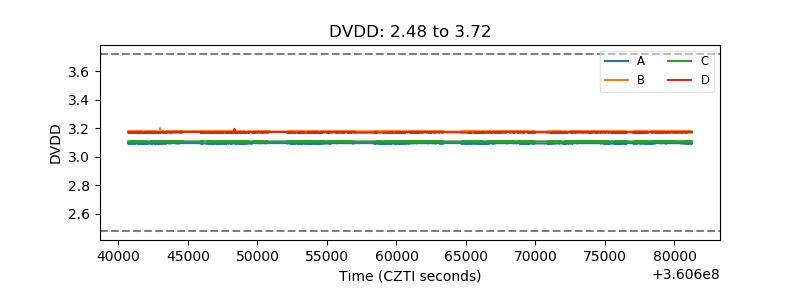 |
| Temperature 1 |  |
| Veto HV Monitor | 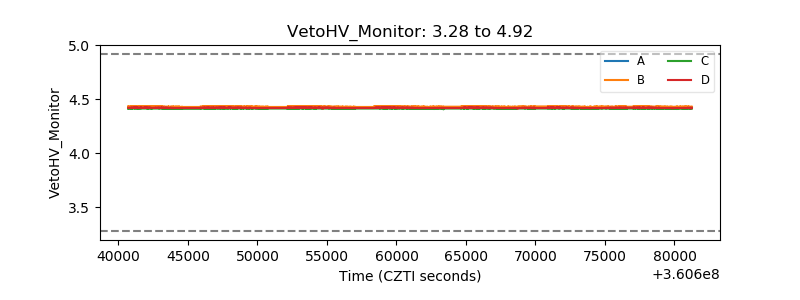 |
| Veto LLD |  |
| Alpha Counter |  |
| _CPM_Rate |  |
| CZT Counter |  |
| +2.5 Volts monitor |  |
| +5 Volts monitor |  |
| _ROLL_ROT |  |
| _Roll_DEC |  |
| _Roll_RA |  |
| Veto Counter |  |