| Param | Original file | Final file |
|---|---|---|
| Filename | modeM0/AS1A10_053T37_9000004444_30758cztM0_level2.evt | modeM0/AS1A10_053T37_9000004444_30758cztM0_level2_quad_clean.evt |
| Size (bytes) | 446,425,920 | 87,252,480 |
| Size | 425.7 MB | 83.2 MB |
| Events in quadrant A | 2,760,733 | 571,159 |
| Events in quadrant B | 4,254,299 | 581,658 |
| Events in quadrant C | 2,827,315 | 570,708 |
| Events in quadrant D | 3,322,666 | 552,244 |
| Mode SS | |||
|---|---|---|---|
| Quadrant | BADHDUFLAG | Total packets | Discarded packets |
| A | 0 | 106 | 0 |
| B | 0 | 106 | 0 |
| C | 0 | 106 | 0 |
| D | 0 | 106 | 0 |
| Mode M0 | |||
|---|---|---|---|
| Quadrant | BADHDUFLAG | Total packets | Discarded packets |
| A | 0 | 11393 | 1 |
| B | 0 | 16129 | 1 |
| C | 0 | 11606 | 1 |
| D | 0 | 13485 | 1 |
| Mode M9 | |||
|---|---|---|---|
| Quadrant | BADHDUFLAG | Total packets | Discarded packets |
| A | 0 | 13 | 0 |
| B | 0 | 13 | 0 |
| C | 0 | 13 | 0 |
| D | 0 | 13 | 0 |
| Quadrant | Total seconds | Saturated seconds | Saturation percentage |
|---|---|---|---|
| A | 5237 | 42 | 0.801986% |
| B | 5237 | 73 | 1.393928% |
| C | 5237 | 86 | 1.642162% |
| D | 5237 | 101 | 1.928585% |
Noise dominated data is calculated using 1-second bins in cleaned event files. If a bin has >2000 counts, and if more than 50% of those come from <1% of pixels, then it is considered to be noise-dominated and hence unusable.
| Quadrant | # 1 sec bins | Bins with >0 counts | Bins with >2000 counts | High rate bins dominated by noise | Noise dominated (total time) | Noise dominated (detector-on time) | Marked lightcurve |
|---|---|---|---|---|---|---|---|
| A | 6497 | 5238 | 16 | 16 | 0.25% | 0.31% | 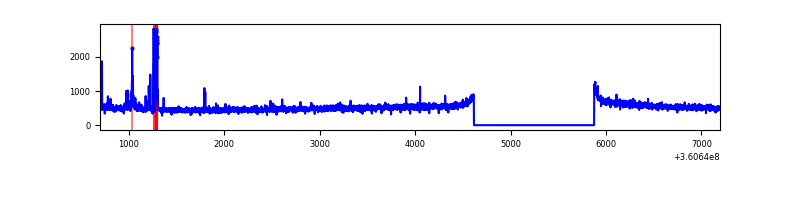 |
| B | 6497 | 5237 | 6 | 6 | 0.09% | 0.11% | 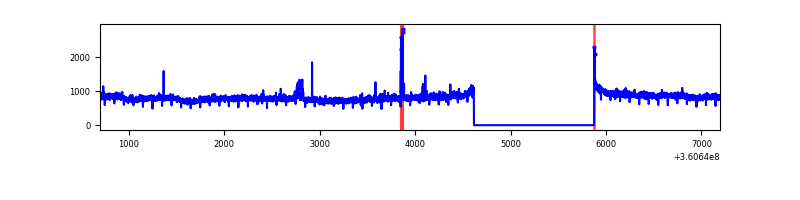 |
| C | 6497 | 5237 | 2 | 2 | 0.03% | 0.04% | 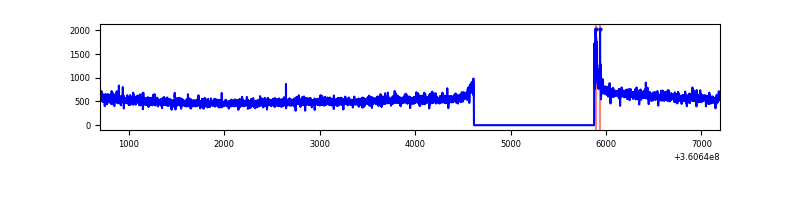 |
| D | 6497 | 5237 | 60 | 60 | 0.92% | 1.15% | 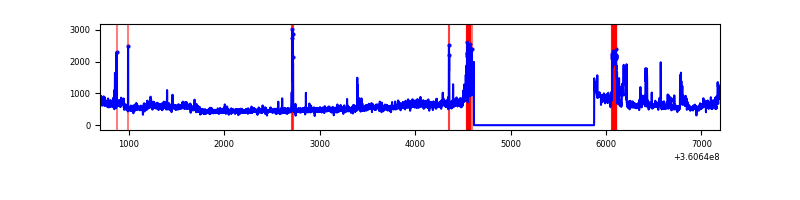 |
Top three noisy pixels from each quadrant. If the there are fewer than three noisy pixels in the level2.evt file, extra rows are filled as -1
| Pixel properties | Quadrant properties | ||||||
|---|---|---|---|---|---|---|---|
| Quadrant | DetID | PixID | Counts | Sigma | Mean | Median | Sigma |
| A | 0 | 13 | 92362 | 657.57 | 690 | 677 | 139.4 |
| A | 13 | 254 | 9699 | 64.7 | 690 | 677 | 139.4 |
| A | 15 | 192 | 7184 | 46.67 | 690 | 677 | 139.4 |
| B | 6 | 159 | 1492257 | 11517.81 | 686 | 670 | 129.5 |
| B | 0 | 190 | 22384 | 167.67 | 686 | 670 | 129.5 |
| B | 5 | 172 | 19308 | 143.92 | 686 | 670 | 129.5 |
| C | 14 | 238 | 108714 | 684.83 | 676 | 682 | 157.8 |
| C | 3 | 233 | 36976 | 230.07 | 676 | 682 | 157.8 |
| C | 0 | 10 | 28673 | 177.44 | 676 | 682 | 157.8 |
| D | 8 | 195 | 395568 | 2459.94 | 677 | 661 | 160.5 |
| D | 10 | 253 | 226180 | 1404.79 | 677 | 661 | 160.5 |
| D | 13 | 249 | 88593 | 547.74 | 677 | 661 | 160.5 |
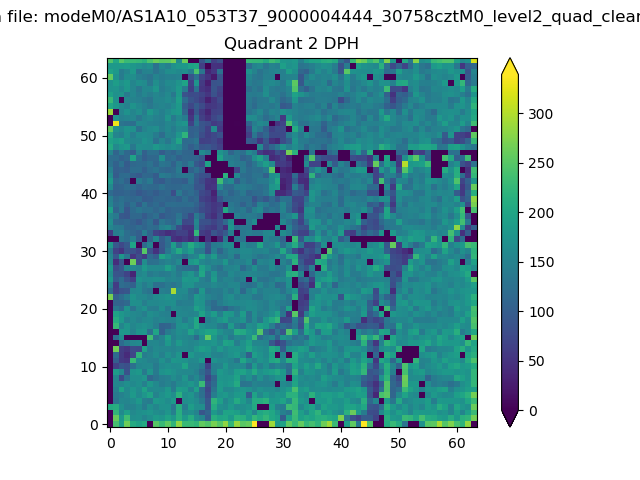
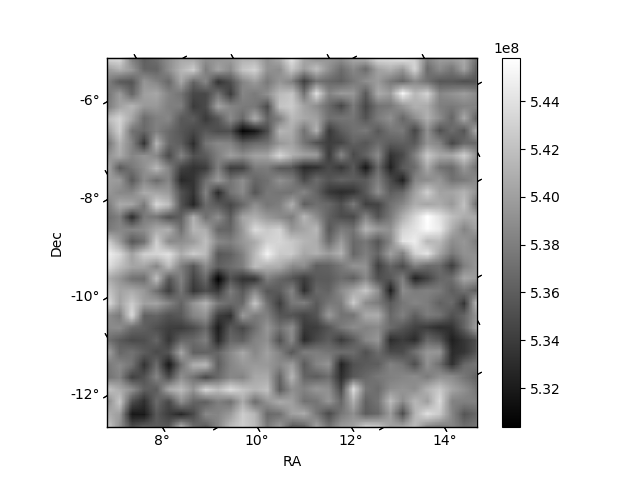
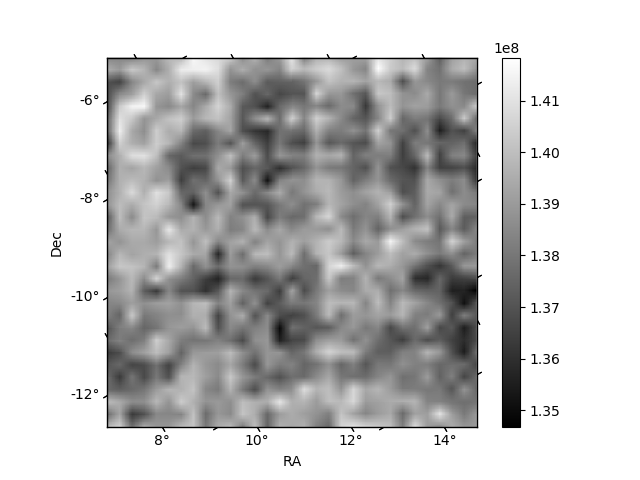
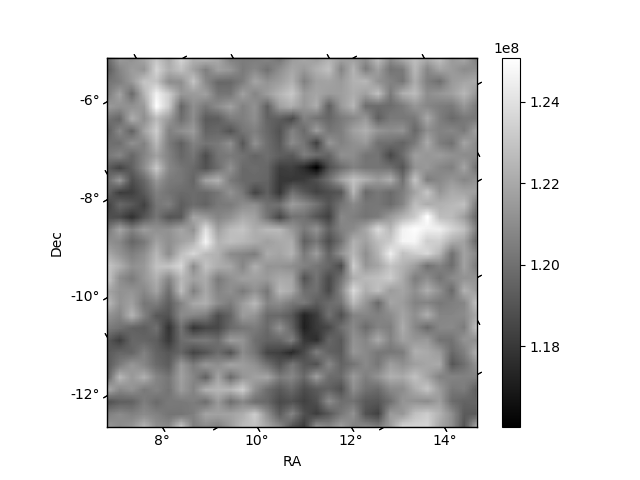
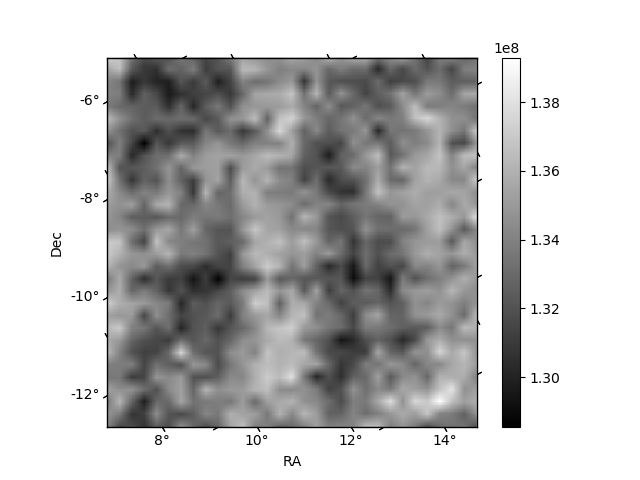
Histogram calculated using DETX and DETY for each event in the final _common_clean file
| Quadrant A | 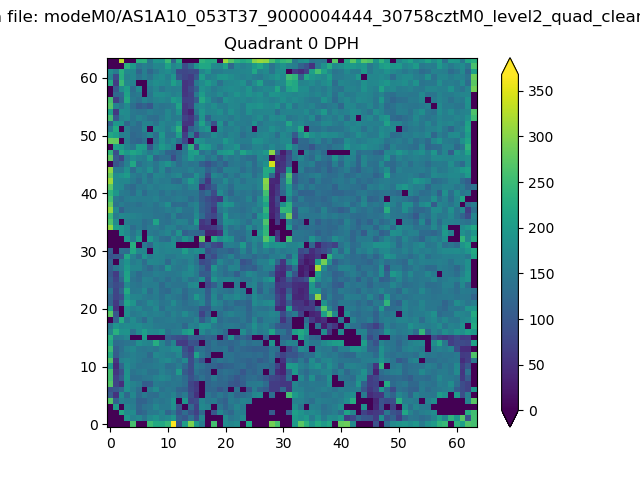 |
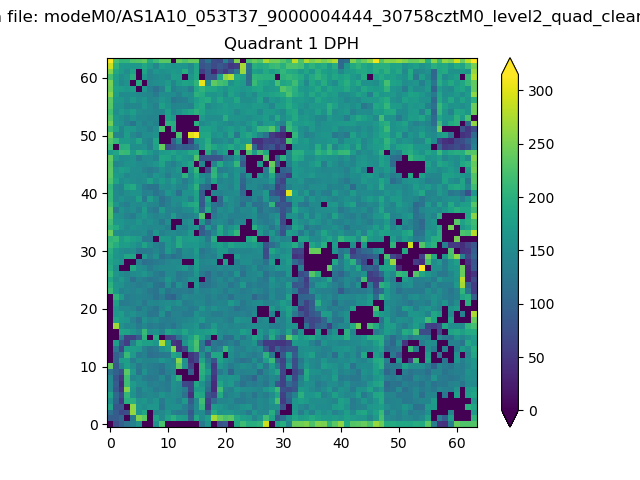 |
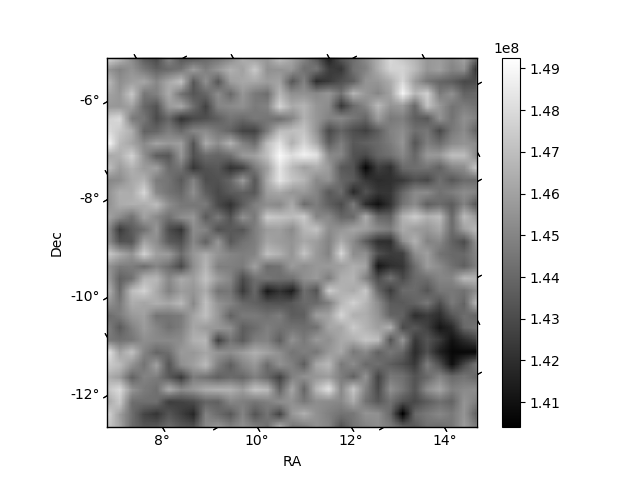
Quadrant B |
|---|---|---|---|
| Quadrant D | 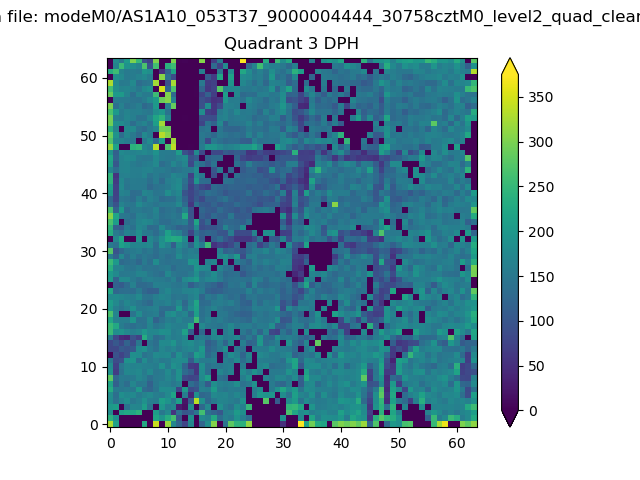 |
 |
Quadrant C |
| Plot type | Count rate plots | Images |
|---|---|---|
| Comparison with Poisson distribution Blue bars denote a histogram of data divided into 1 sec bins. Red curve is a Poisson curve with rate = median count rate of data. |
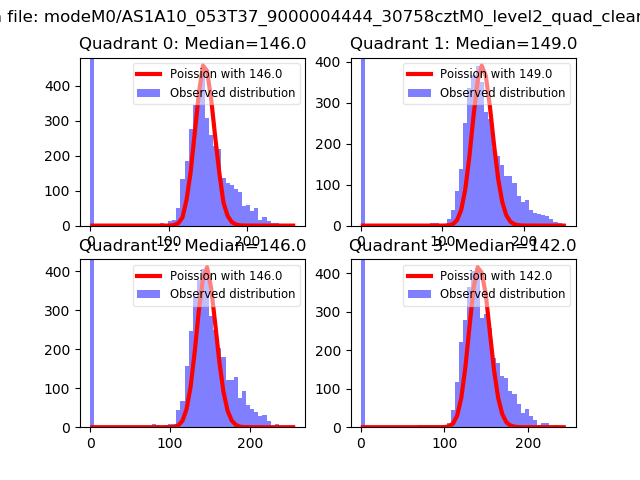 |
 |
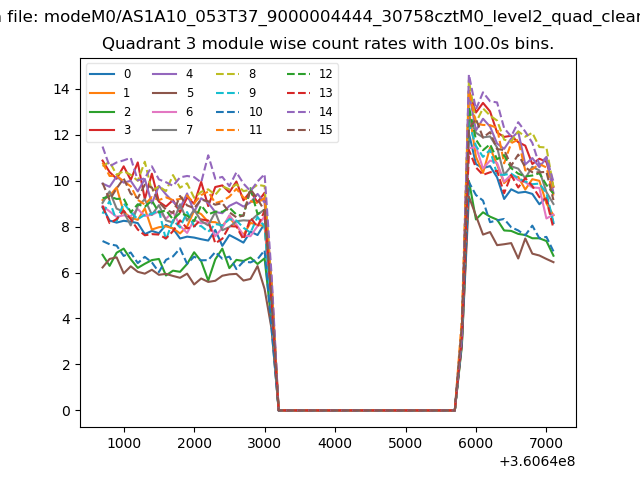
| Quadrant-wise count rates Data is divided into 100 sec bins |
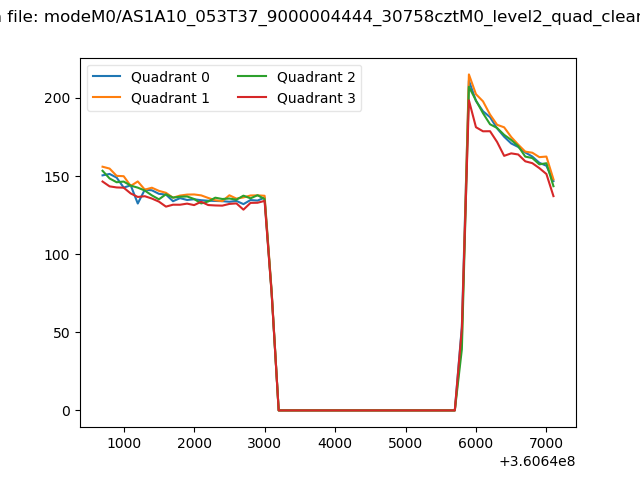 |
|
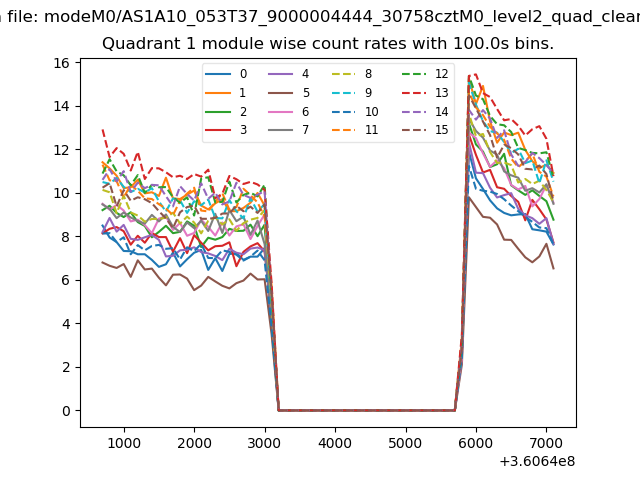
| Module-wise count rates for Quadrant A Data is divided into 100 sec bins |
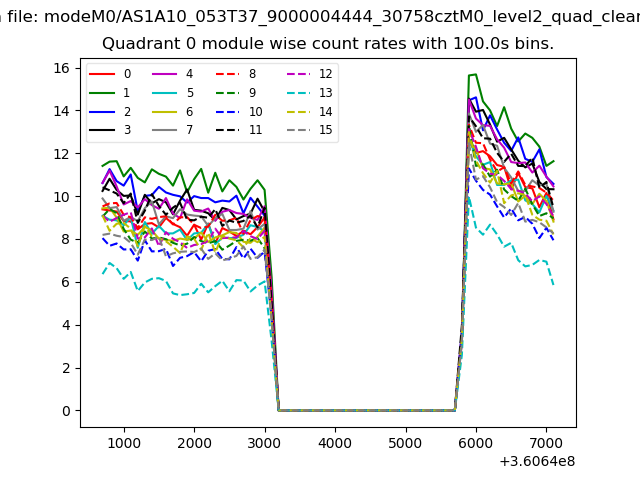 |
 |
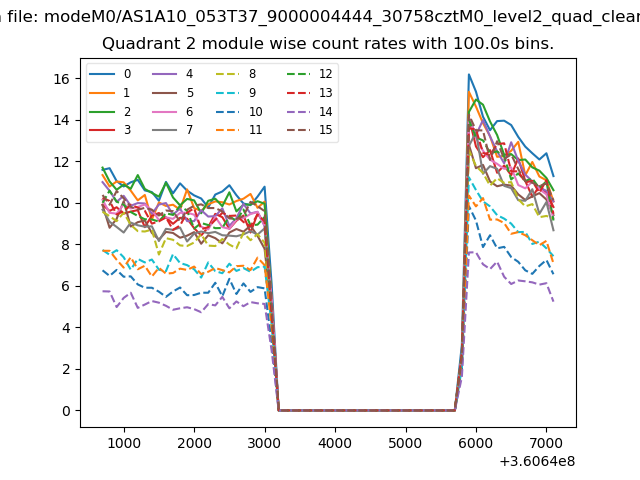
| Module-wise count rates for Quadrant B Data is divided into 100 sec bins |
 |
 |
| Module-wise count rates for Quadrant C Data is divided into 100 sec bins |
 |
 |
| Module-wise count rates for Quadrant D Data is divided into 100 sec bins |
 |
 |
| Parameter | Plot |
|---|---|
| CZT HV Monitor | 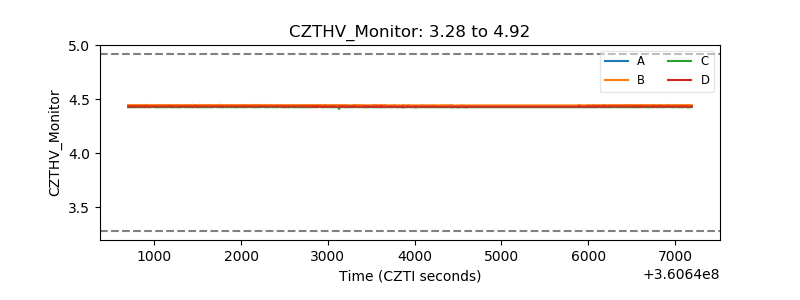 |
| D_VDD | 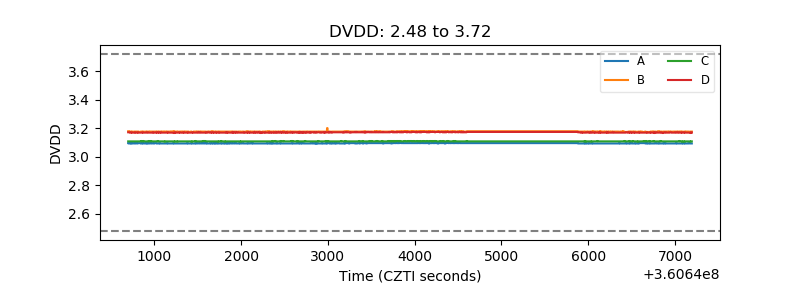 |
| Temperature 1 | 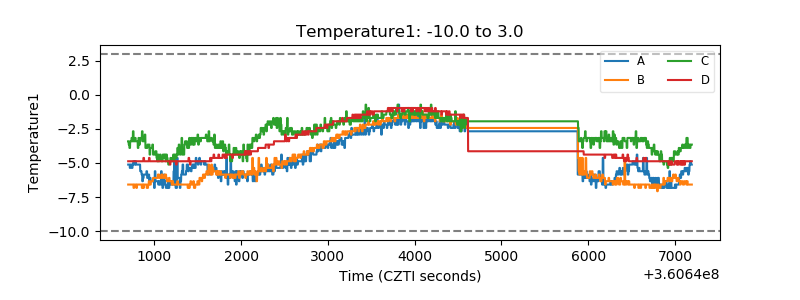 |
| Veto HV Monitor | 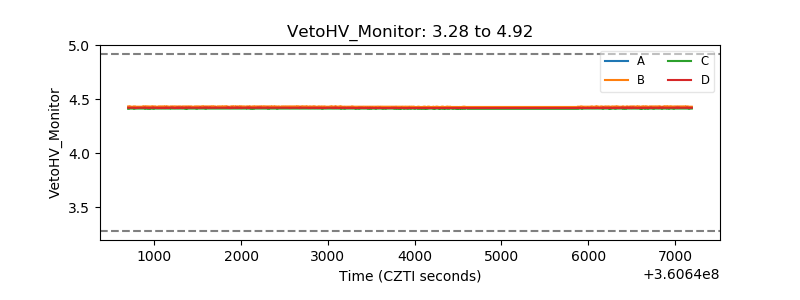 |
| Veto LLD | 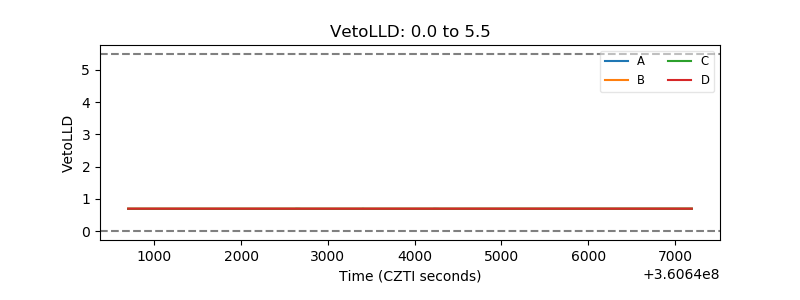 |
| Alpha Counter | 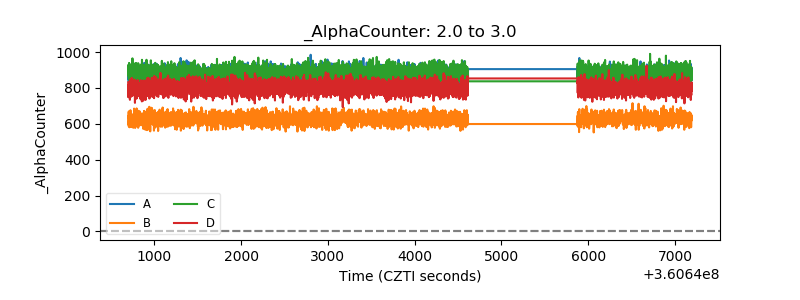 |
| _CPM_Rate | 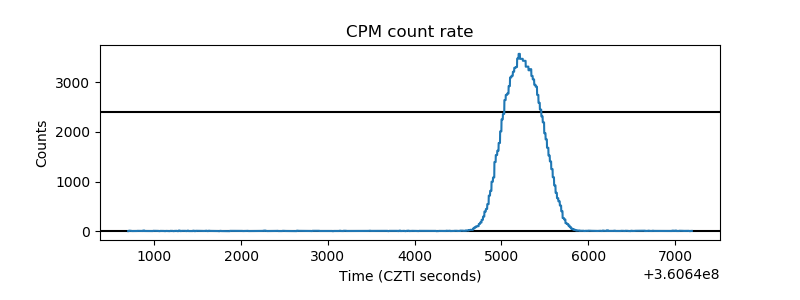 |
| CZT Counter | 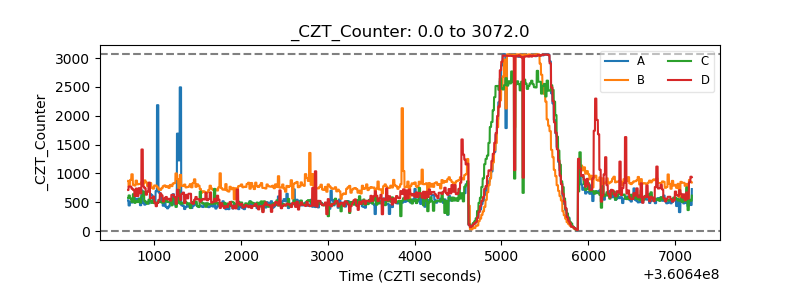 |
| +2.5 Volts monitor |  |
| +5 Volts monitor |  |
| _ROLL_ROT | 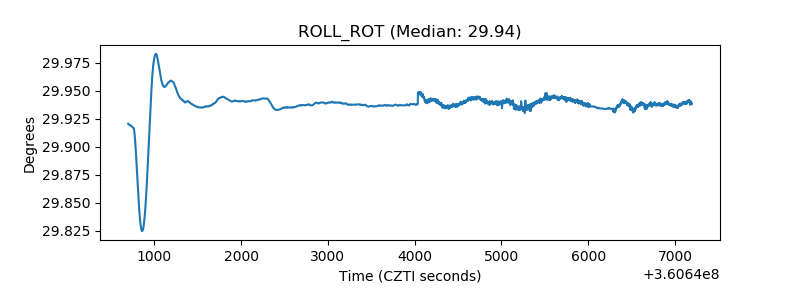 |
| _Roll_DEC | 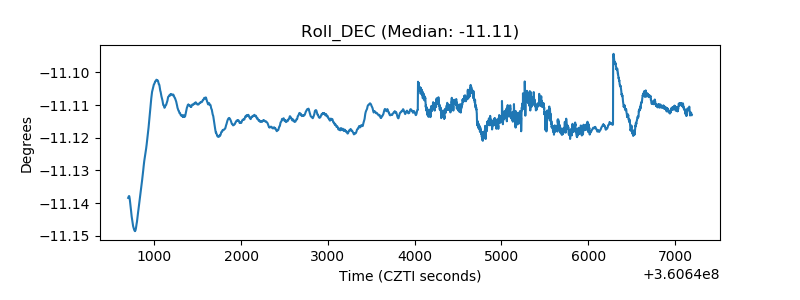 |
| _Roll_RA | 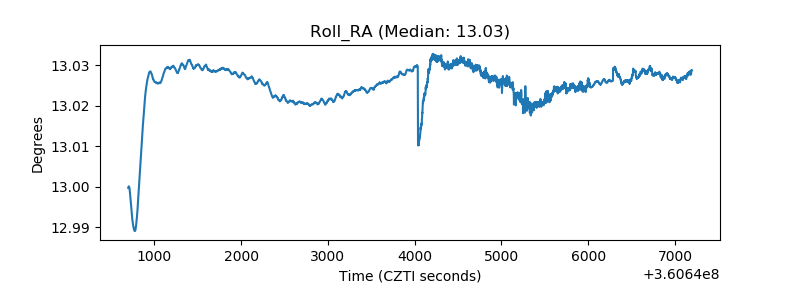 |
| Veto Counter | 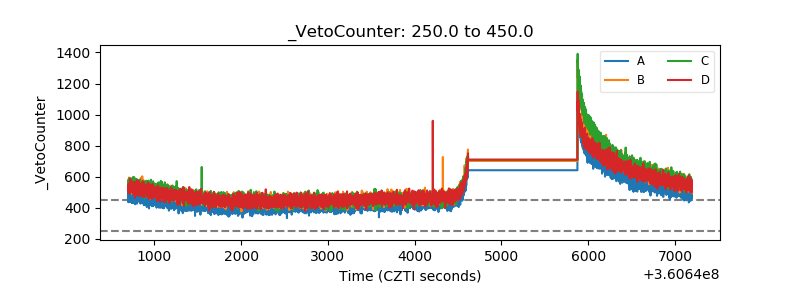 |