| Param | Original file | Final file |
|---|---|---|
| Filename | modeM0/AS1A10_053T37_9000004444_30759cztM0_level2.evt | modeM0/AS1A10_053T37_9000004444_30759cztM0_level2_quad_clean.evt |
| Size (bytes) | 520,623,360 | 99,544,320 |
| Size | 496.5 MB | 94.9 MB |
| Events in quadrant A | 3,114,913 | 653,273 |
| Events in quadrant B | 4,946,851 | 665,324 |
| Events in quadrant C | 3,340,254 | 647,398 |
| Events in quadrant D | 3,962,195 | 632,953 |
| Mode SS | |||
|---|---|---|---|
| Quadrant | BADHDUFLAG | Total packets | Discarded packets |
| A | 0 | 122 | 0 |
| B | 0 | 122 | 0 |
| C | 0 | 122 | 0 |
| D | 0 | 122 | 0 |
| Mode M0 | |||
|---|---|---|---|
| Quadrant | BADHDUFLAG | Total packets | Discarded packets |
| A | 0 | 12721 | 1 |
| B | 0 | 18365 | 1 |
| C | 0 | 13542 | 1 |
| D | 0 | 15743 | 1 |
| Mode M9 | |||
|---|---|---|---|
| Quadrant | BADHDUFLAG | Total packets | Discarded packets |
| A | 0 | 13 | 0 |
| B | 0 | 13 | 0 |
| C | 0 | 13 | 0 |
| D | 0 | 13 | 0 |
| Quadrant | Total seconds | Saturated seconds | Saturation percentage |
|---|---|---|---|
| A | 5948 | 45 | 0.756557% |
| B | 5949 | 106 | 1.781812% |
| C | 5949 | 139 | 2.336527% |
| D | 5949 | 58 | 0.974954% |
Noise dominated data is calculated using 1-second bins in cleaned event files. If a bin has >2000 counts, and if more than 50% of those come from <1% of pixels, then it is considered to be noise-dominated and hence unusable.
| Quadrant | # 1 sec bins | Bins with >0 counts | Bins with >2000 counts | High rate bins dominated by noise | Noise dominated (total time) | Noise dominated (detector-on time) | Marked lightcurve |
|---|---|---|---|---|---|---|---|
| A | 7258 | 5948 | 3 | 3 | 0.04% | 0.05% | 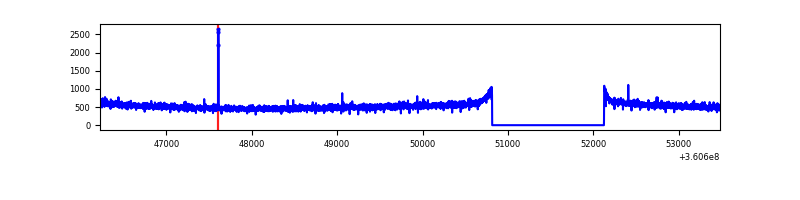 |
| B | 7259 | 5949 | 0 | 0 | 0.00% | 0.00% | 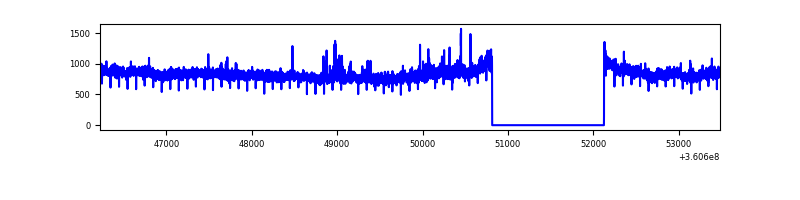 |
| C | 7259 | 5949 | 6 | 6 | 0.08% | 0.10% | 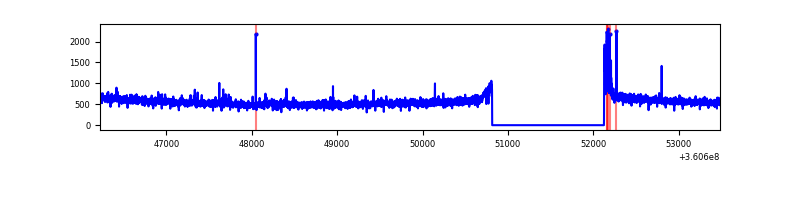 |
| D | 7259 | 5949 | 21 | 21 | 0.29% | 0.35% | 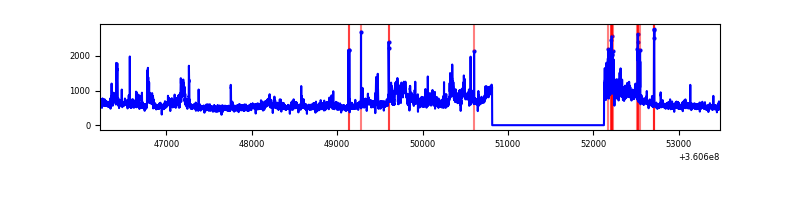 |
Top three noisy pixels from each quadrant. If the there are fewer than three noisy pixels in the level2.evt file, extra rows are filled as -1
| Pixel properties | Quadrant properties | ||||||
|---|---|---|---|---|---|---|---|
| Quadrant | DetID | PixID | Counts | Sigma | Mean | Median | Sigma |
| A | 8 | 255 | 11312 | 65.46 | 805 | 792 | 160.7 |
| A | 13 | 254 | 11005 | 63.55 | 805 | 792 | 160.7 |
| A | 3 | 137 | 7392 | 41.07 | 805 | 792 | 160.7 |
| B | 6 | 159 | 1715516 | 11465.92 | 798 | 778 | 149.6 |
| B | 0 | 190 | 46268 | 304.18 | 798 | 778 | 149.6 |
| B | 6 | 36 | 23001 | 148.6 | 798 | 778 | 149.6 |
| C | 14 | 238 | 127779 | 696.41 | 785 | 793 | 182.3 |
| C | 3 | 233 | 63523 | 344.02 | 785 | 793 | 182.3 |
| C | 0 | 10 | 42824 | 230.5 | 785 | 793 | 182.3 |
| D | 8 | 195 | 430291 | 2275.74 | 793 | 775 | 188.7 |
| D | 10 | 253 | 234086 | 1236.17 | 793 | 775 | 188.7 |
| D | 12 | 227 | 159769 | 842.41 | 793 | 775 | 188.7 |
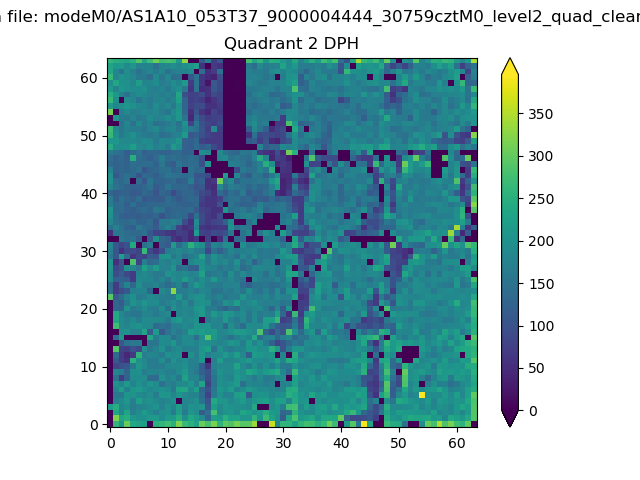
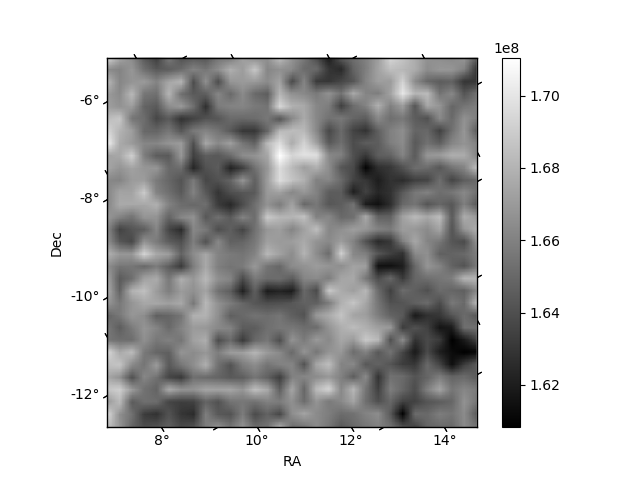
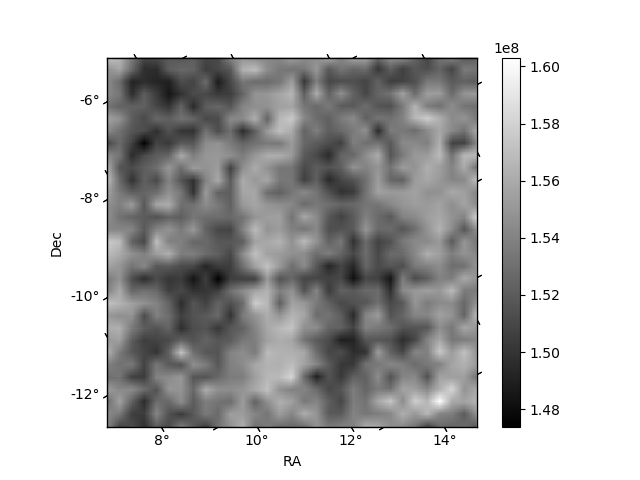
Histogram calculated using DETX and DETY for each event in the final _common_clean file
| Quadrant A | 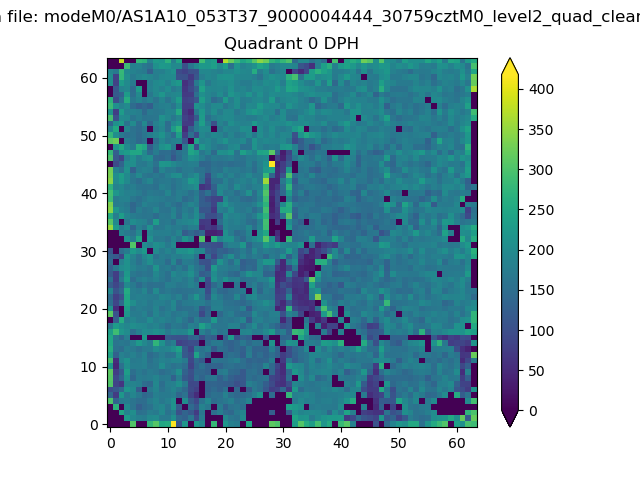 |
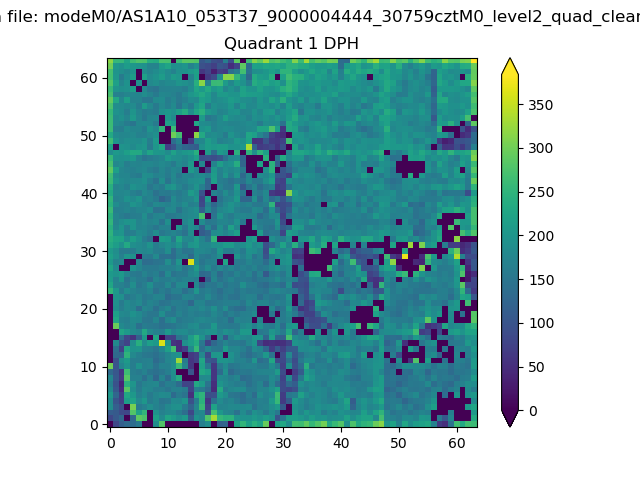 |
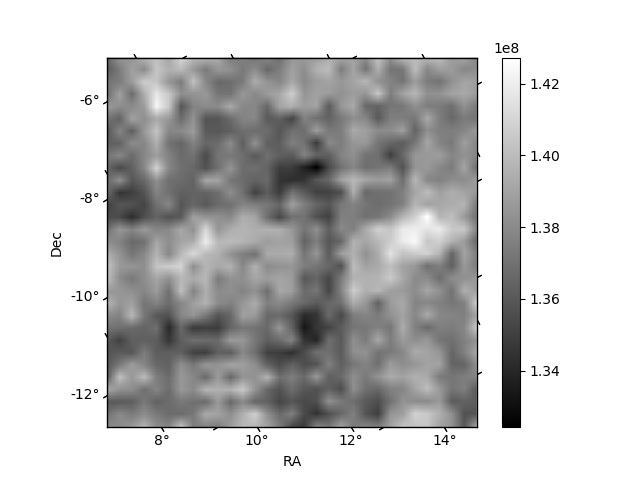
Quadrant B |
|---|---|---|---|
| Quadrant D | 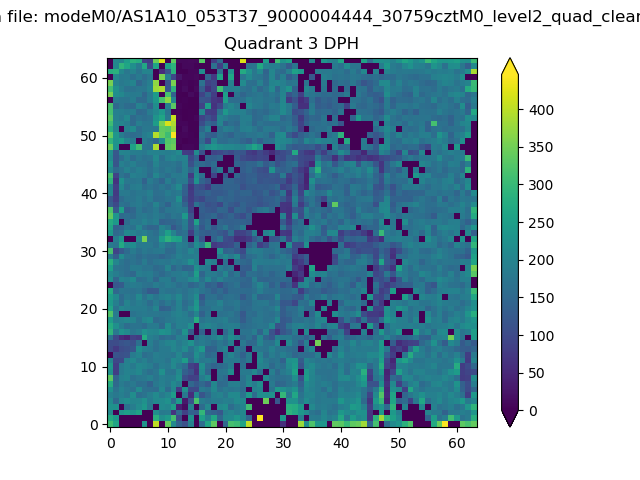 |
 |
Quadrant C |
| Plot type | Count rate plots | Images |
|---|---|---|
| Comparison with Poisson distribution Blue bars denote a histogram of data divided into 1 sec bins. Red curve is a Poisson curve with rate = median count rate of data. |
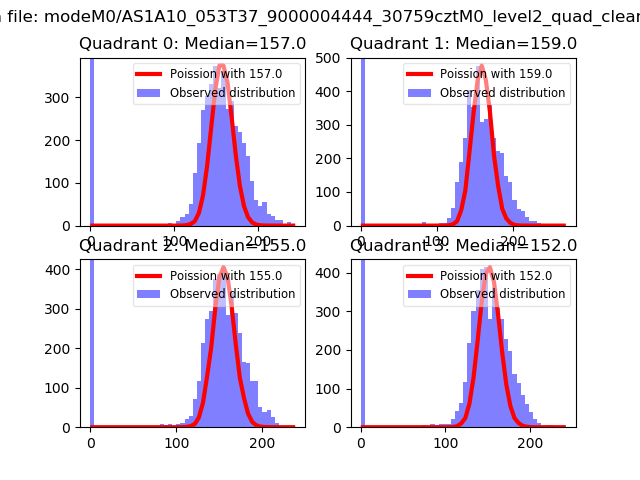 |
 |
| Quadrant-wise count rates Data is divided into 100 sec bins |
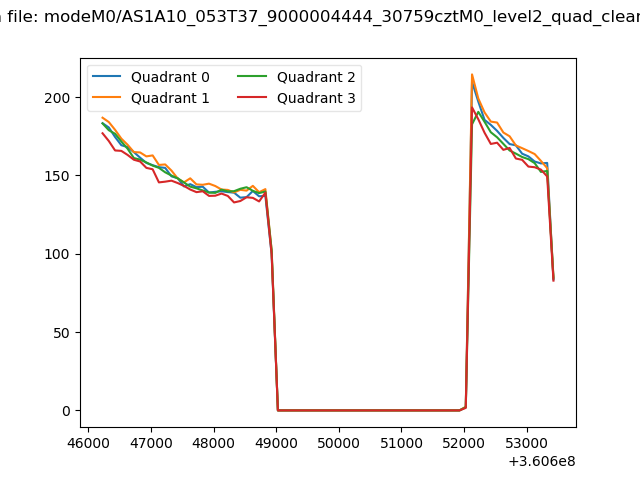 |
|
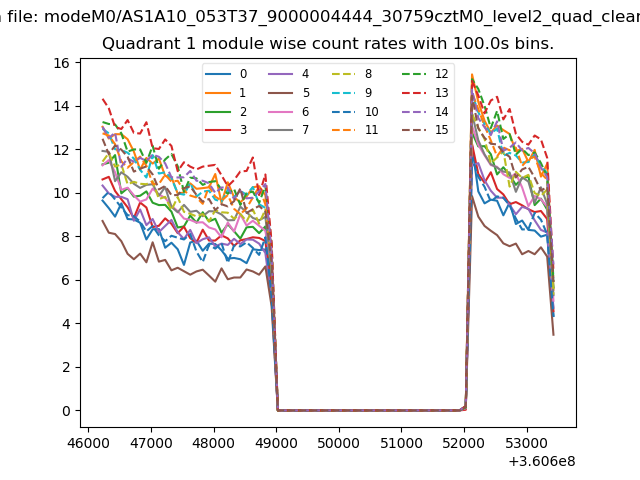
| Module-wise count rates for Quadrant A Data is divided into 100 sec bins |
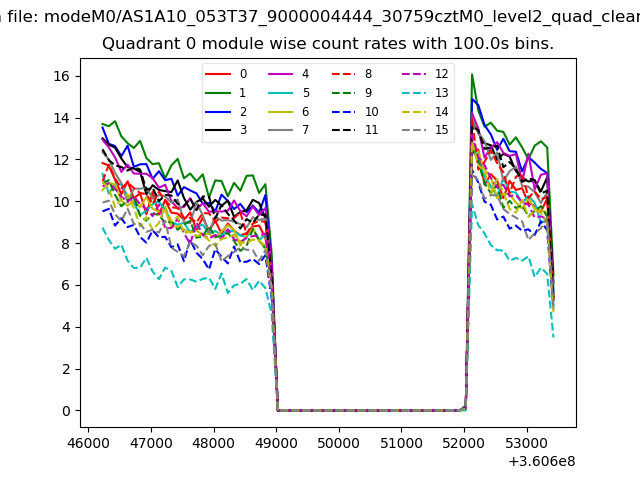 |
 |
| Module-wise count rates for Quadrant B Data is divided into 100 sec bins |
 |
 |
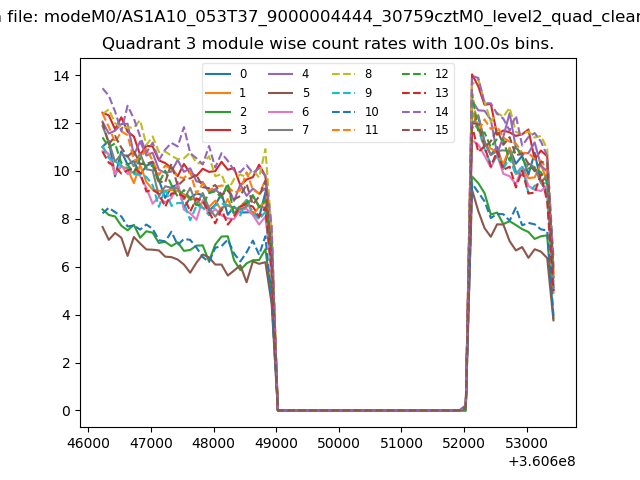
| Module-wise count rates for Quadrant C Data is divided into 100 sec bins |
 |
 |
| Module-wise count rates for Quadrant D Data is divided into 100 sec bins |
 |
 |
| Parameter | Plot |
|---|---|
| CZT HV Monitor | 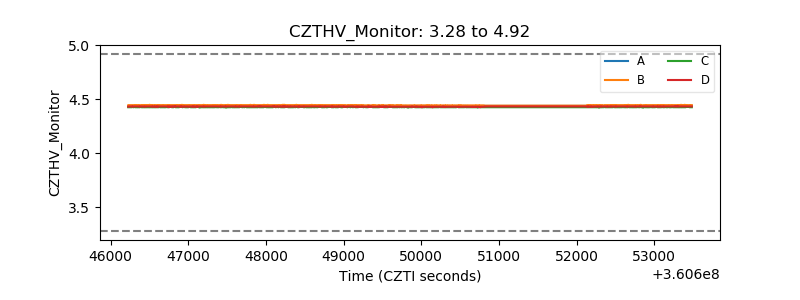 |
| D_VDD | 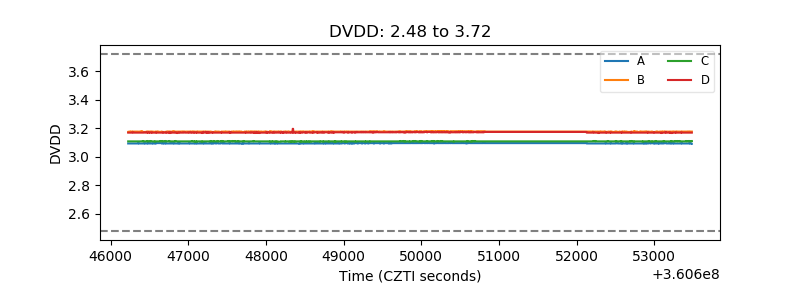 |
| Temperature 1 | 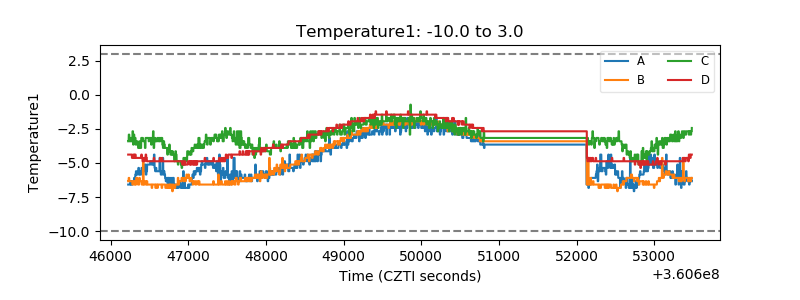 |
| Veto HV Monitor |  |
| Veto LLD | 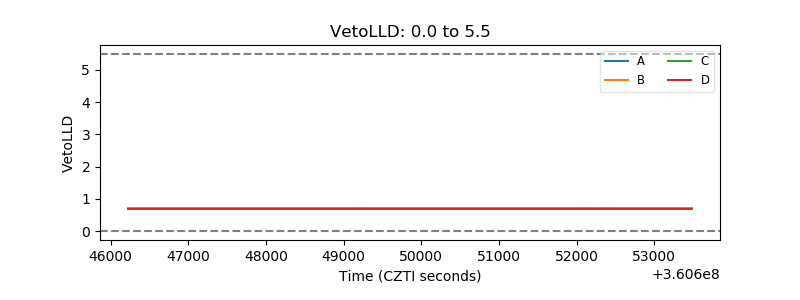 |
| Alpha Counter | 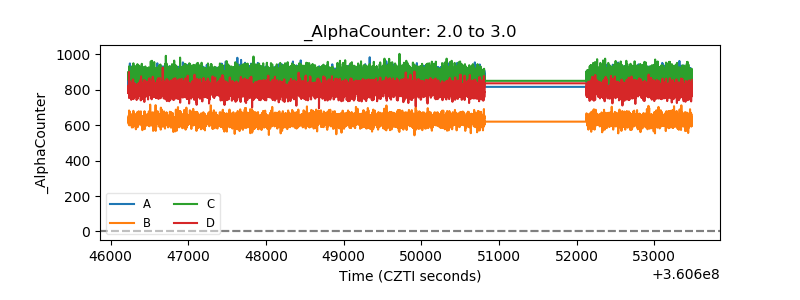 |
| _CPM_Rate |  |
| CZT Counter | 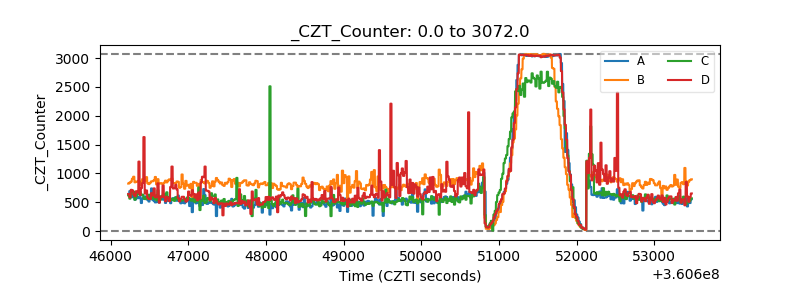 |
| +2.5 Volts monitor |  |
| +5 Volts monitor | 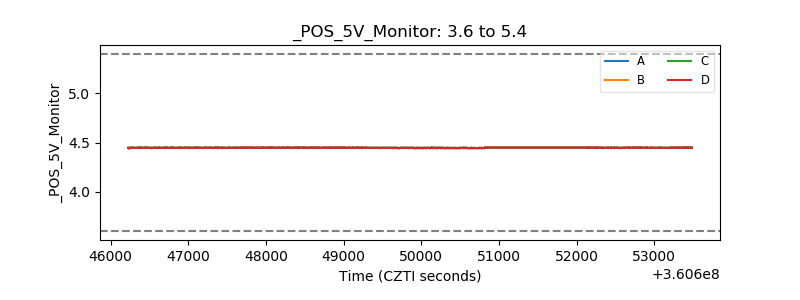 |
| _ROLL_ROT | 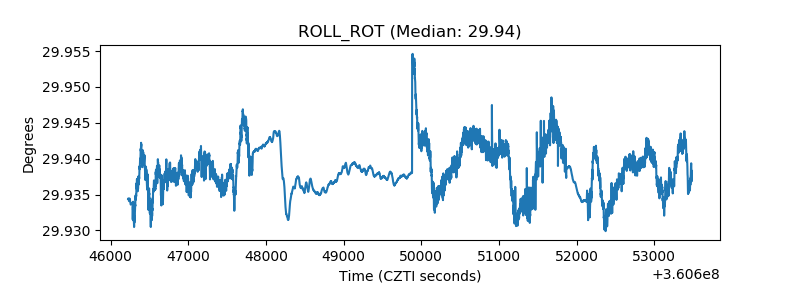 |
| _Roll_DEC | 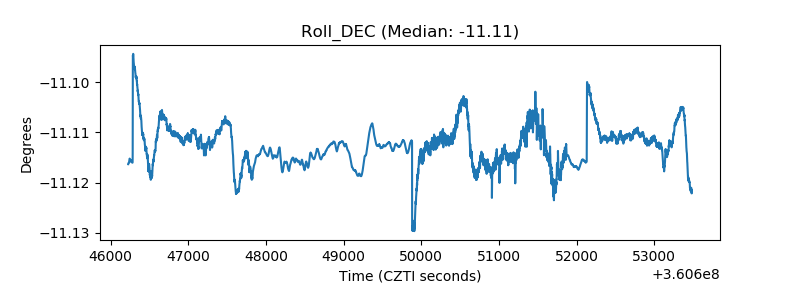 |
| _Roll_RA | 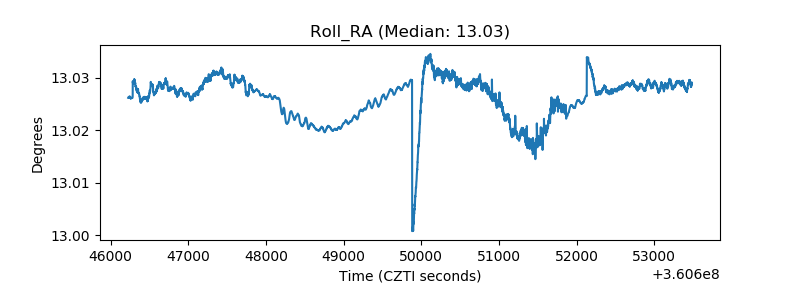 |
| Veto Counter | 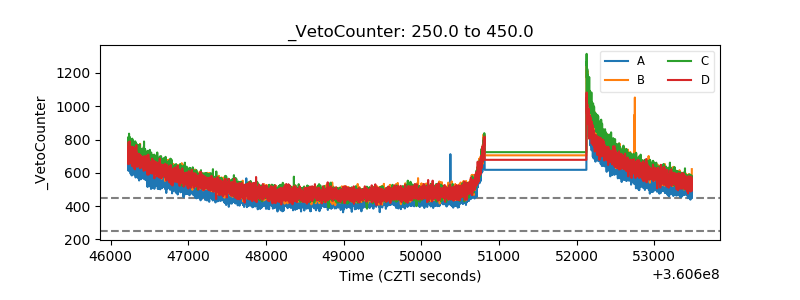 |