| Param | Original file | Final file |
|---|---|---|
| Filename | modeM0/AS1A10_053T37_9000004444_30760cztM0_level2.evt | modeM0/AS1A10_053T37_9000004444_30760cztM0_level2_quad_clean.evt |
| Size (bytes) | 515,306,880 | 89,691,840 |
| Size | 491.4 MB | 85.5 MB |
| Events in quadrant A | 3,064,377 | 583,421 |
| Events in quadrant B | 4,908,072 | 587,074 |
| Events in quadrant C | 3,259,443 | 568,517 |
| Events in quadrant D | 3,969,565 | 559,680 |
| Mode SS | |||
|---|---|---|---|
| Quadrant | BADHDUFLAG | Total packets | Discarded packets |
| A | 0 | 122 | 0 |
| B | 0 | 122 | 0 |
| C | 0 | 122 | 0 |
| D | 0 | 122 | 0 |
| Mode M0 | |||
|---|---|---|---|
| Quadrant | BADHDUFLAG | Total packets | Discarded packets |
| A | 0 | 12520 | 1 |
| B | 0 | 18484 | 16 |
| C | 0 | 13111 | 3 |
| D | 0 | 15704 | 10 |
| Mode M9 | |||
|---|---|---|---|
| Quadrant | BADHDUFLAG | Total packets | Discarded packets |
| A | 0 | 14 | 0 |
| B | 0 | 14 | 0 |
| C | 0 | 14 | 0 |
| D | 0 | 14 | 0 |
| Quadrant | Total seconds | Saturated seconds | Saturation percentage |
|---|---|---|---|
| A | 5978 | 25 | 0.418200% |
| B | 5973 | 115 | 1.925331% |
| C | 5978 | 77 | 1.288056% |
| D | 5976 | 29 | 0.485274% |
Noise dominated data is calculated using 1-second bins in cleaned event files. If a bin has >2000 counts, and if more than 50% of those come from <1% of pixels, then it is considered to be noise-dominated and hence unusable.
| Quadrant | # 1 sec bins | Bins with >0 counts | Bins with >2000 counts | High rate bins dominated by noise | Noise dominated (total time) | Noise dominated (detector-on time) | Marked lightcurve |
|---|---|---|---|---|---|---|---|
| A | 7318 | 5978 | 0 | 0 | 0.00% | 0.00% | 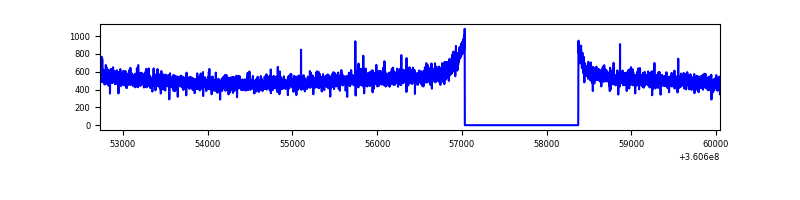 |
| B | 7318 | 5979 | 1 | 1 | 0.01% | 0.02% | 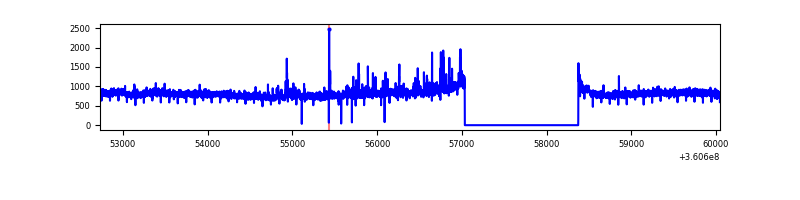 |
| C | 7319 | 5980 | 1 | 1 | 0.01% | 0.02% | 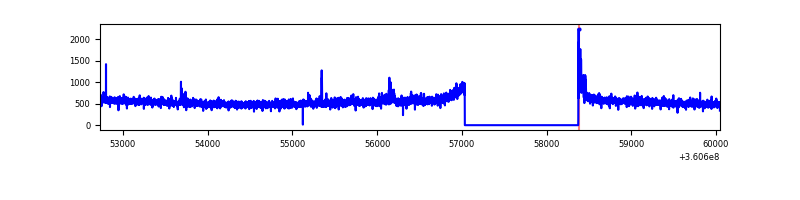 |
| D | 7319 | 5980 | 5 | 5 | 0.07% | 0.08% | 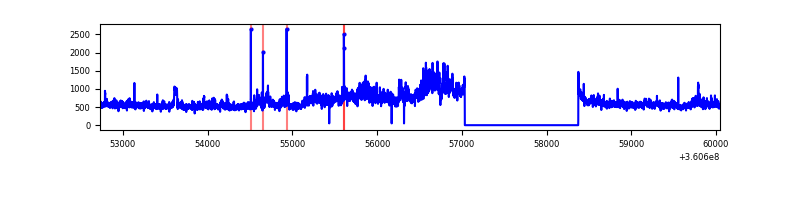 |
Top three noisy pixels from each quadrant. If the there are fewer than three noisy pixels in the level2.evt file, extra rows are filled as -1
| Pixel properties | Quadrant properties | ||||||
|---|---|---|---|---|---|---|---|
| Quadrant | DetID | PixID | Counts | Sigma | Mean | Median | Sigma |
| A | 13 | 254 | 10166 | 59.48 | 794 | 779 | 157.8 |
| A | 3 | 137 | 7368 | 41.75 | 794 | 779 | 157.8 |
| A | 0 | 226 | 6836 | 38.38 | 794 | 779 | 157.8 |
| B | 6 | 159 | 1690644 | 11346.47 | 782 | 763 | 148.9 |
| B | 0 | 190 | 36418 | 239.4 | 782 | 763 | 148.9 |
| B | 5 | 255 | 31502 | 206.39 | 782 | 763 | 148.9 |
| C | 14 | 238 | 124785 | 696.18 | 764 | 774 | 178.1 |
| C | 3 | 233 | 72014 | 399.93 | 764 | 774 | 178.1 |
| C | 1 | 16 | 38597 | 212.33 | 764 | 774 | 178.1 |
| D | 8 | 195 | 782763 | 4284.89 | 776 | 760 | 182.5 |
| D | 12 | 227 | 197297 | 1076.9 | 776 | 760 | 182.5 |
| D | 2 | 250 | 33374 | 178.7 | 776 | 760 | 182.5 |
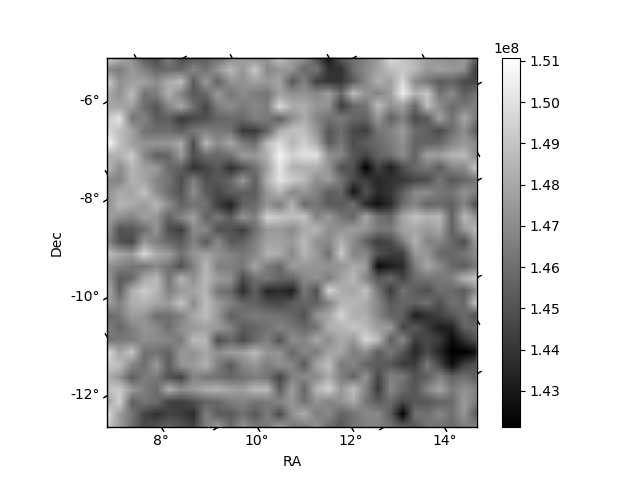
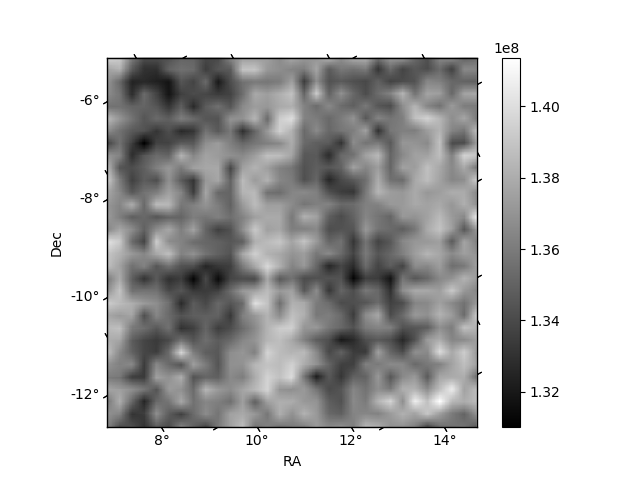
Histogram calculated using DETX and DETY for each event in the final _common_clean file
| Quadrant A | 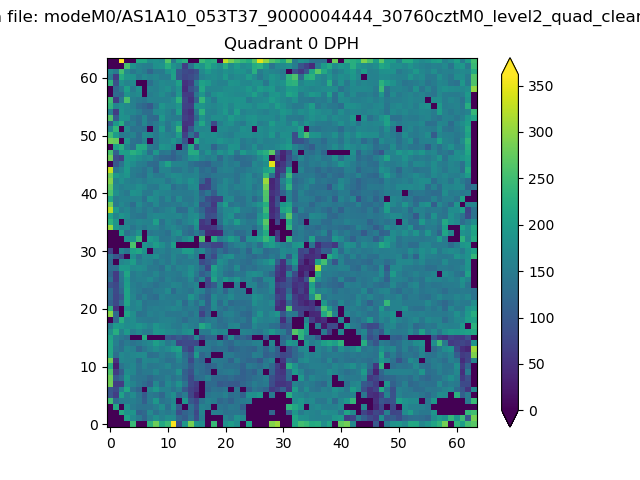 |
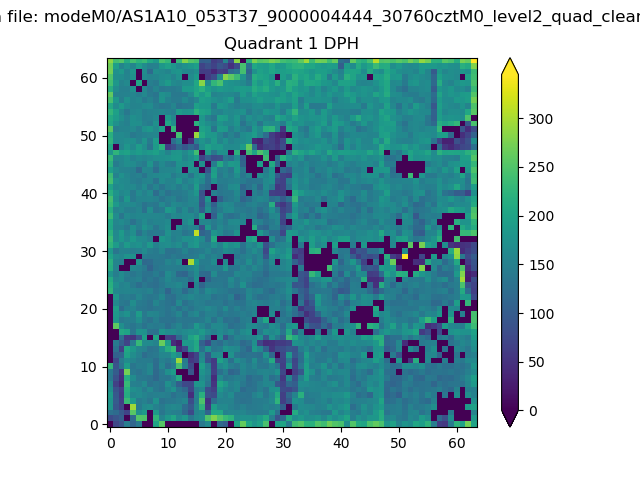 |
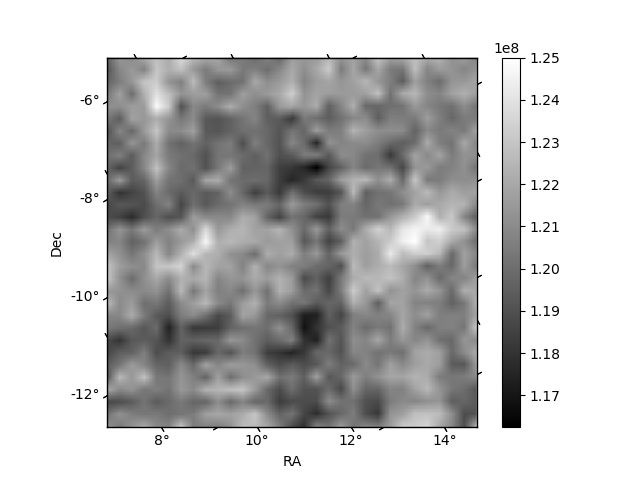
Quadrant B |
|---|---|---|---|
| Quadrant D | 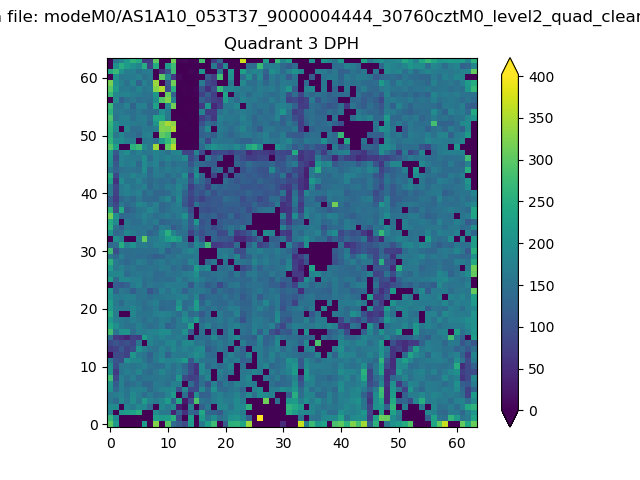 |
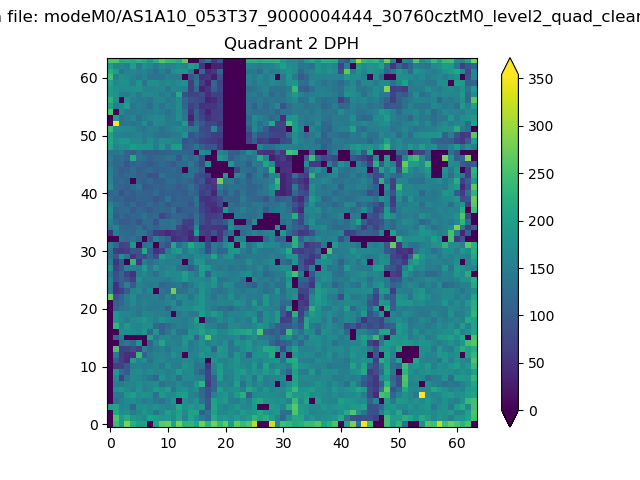 |
Quadrant C |
| Plot type | Count rate plots | Images |
|---|---|---|
| Comparison with Poisson distribution Blue bars denote a histogram of data divided into 1 sec bins. Red curve is a Poisson curve with rate = median count rate of data. |
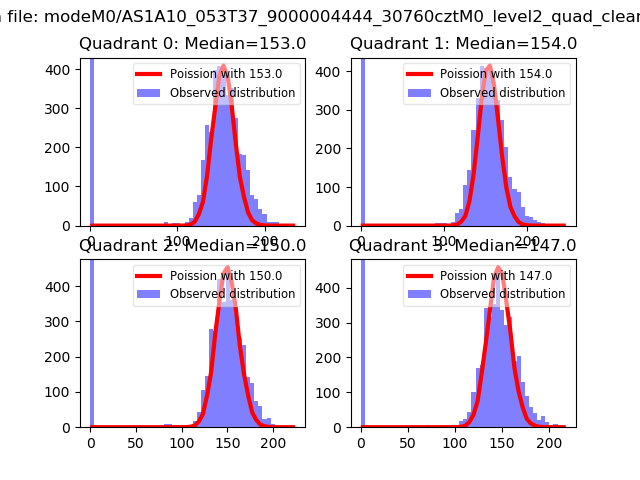 |
 |
| Quadrant-wise count rates Data is divided into 100 sec bins |
 |
|
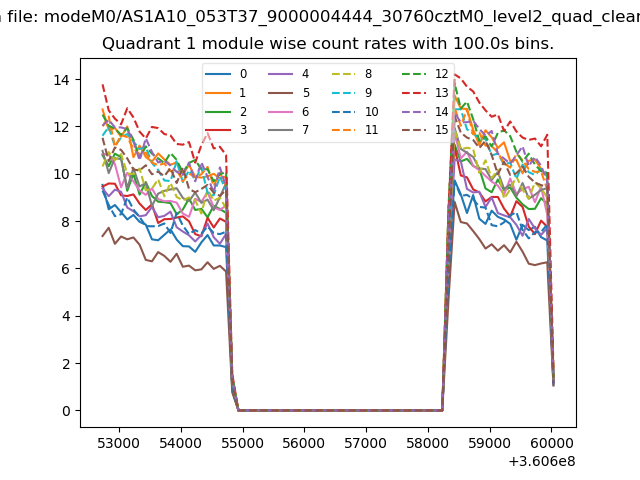
| Module-wise count rates for Quadrant A Data is divided into 100 sec bins |
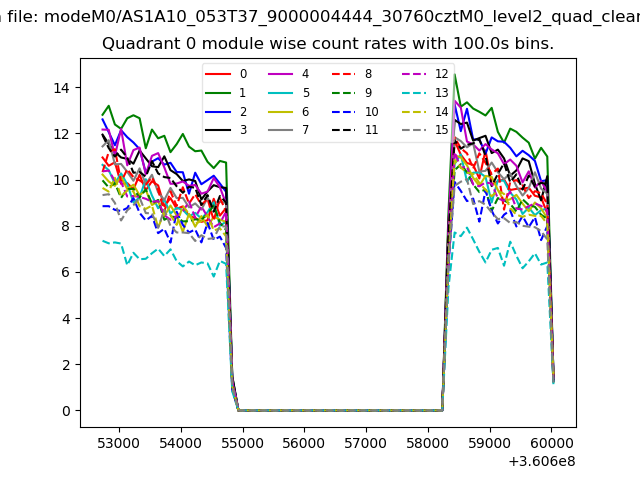 |
 |
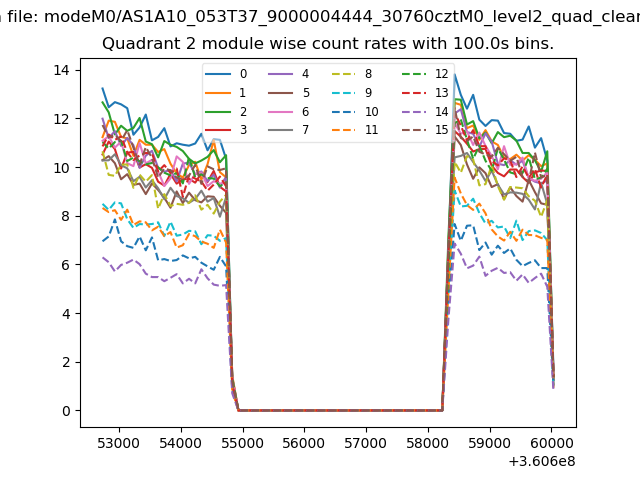
| Module-wise count rates for Quadrant B Data is divided into 100 sec bins |
 |
 |
| Module-wise count rates for Quadrant C Data is divided into 100 sec bins |
 |
 |
| Module-wise count rates for Quadrant D Data is divided into 100 sec bins |
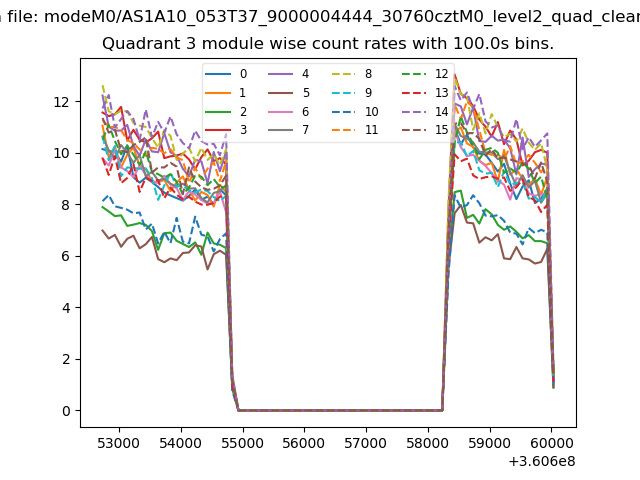 |
 |
| Parameter | Plot |
|---|---|
| CZT HV Monitor |  |
| D_VDD | 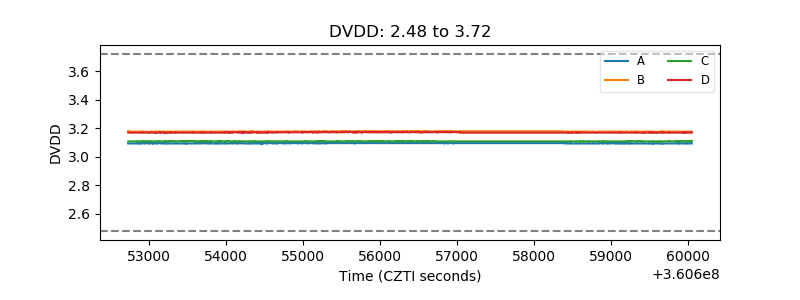 |
| Temperature 1 | 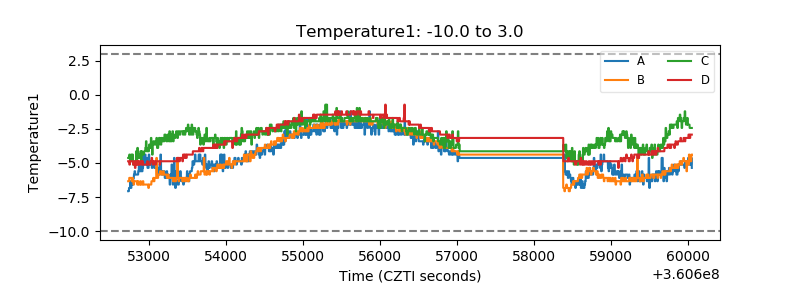 |
| Veto HV Monitor | 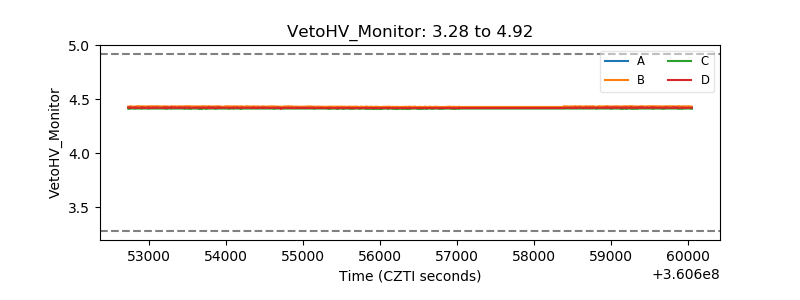 |
| Veto LLD | 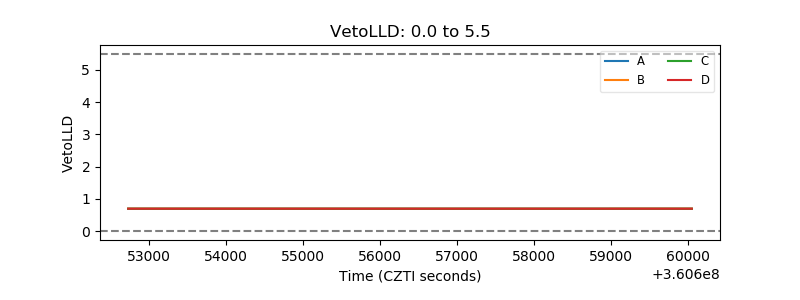 |
| Alpha Counter | 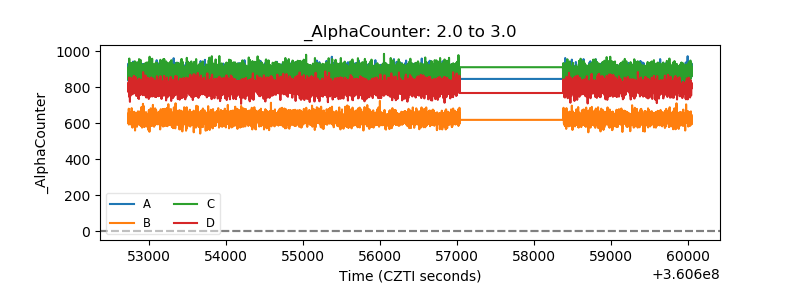 |
| _CPM_Rate | 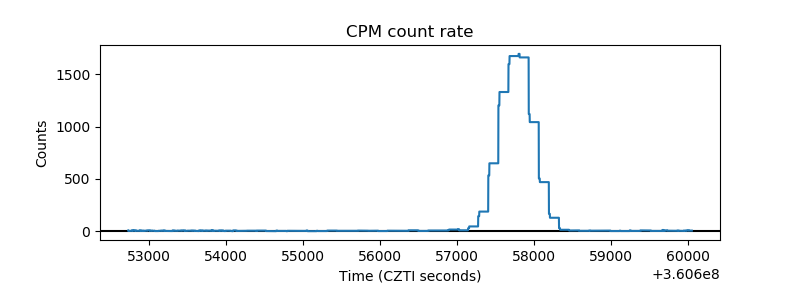 |
| CZT Counter | 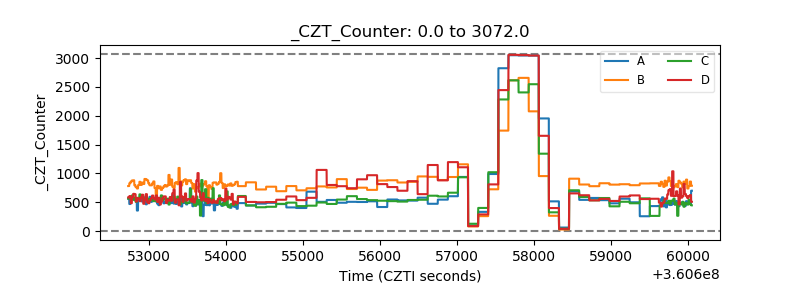 |
| +2.5 Volts monitor |  |
| +5 Volts monitor |  |
| _ROLL_ROT | 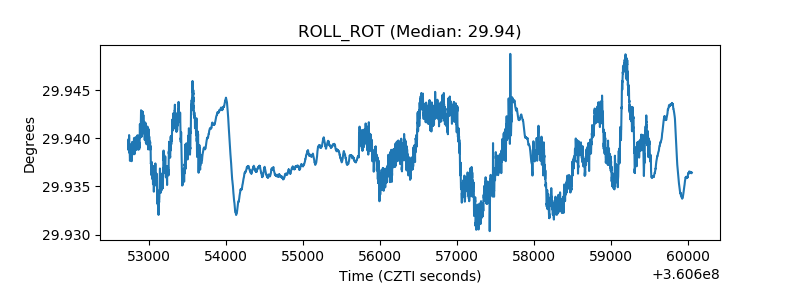 |
| _Roll_DEC | 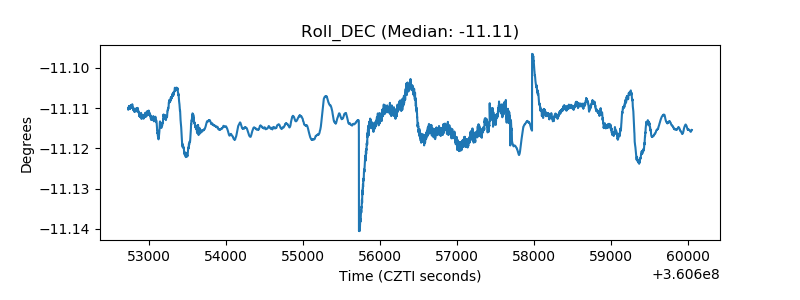 |
| _Roll_RA | 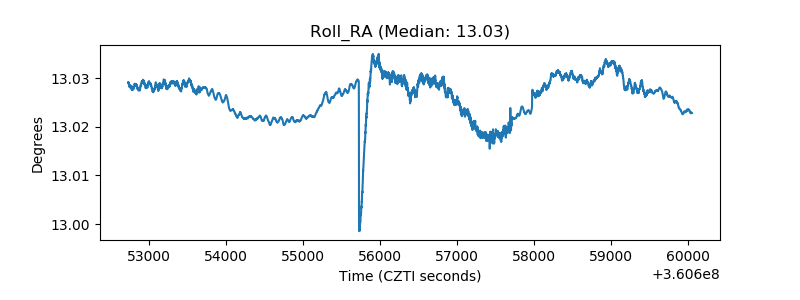 |
| Veto Counter | 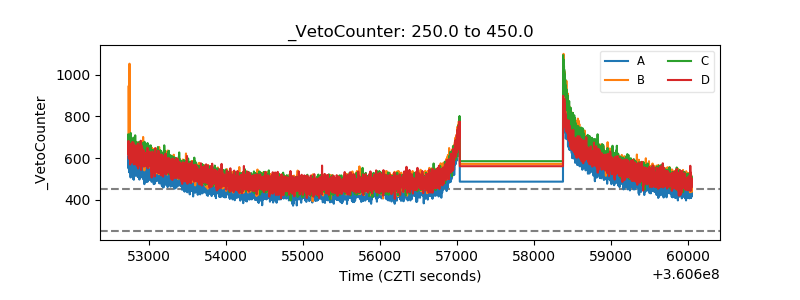 |