| Param | Original file | Final file |
|---|---|---|
| Filename | modeM0/AS1A10_053T37_9000004444_30761cztM0_level2.evt | modeM0/AS1A10_053T37_9000004444_30761cztM0_level2_quad_clean.evt |
| Size (bytes) | 497,206,080 | 82,143,360 |
| Size | 474.2 MB | 78.3 MB |
| Events in quadrant A | 2,970,405 | 527,407 |
| Events in quadrant B | 4,669,425 | 530,800 |
| Events in quadrant C | 3,152,028 | 510,935 |
| Events in quadrant D | 3,865,014 | 504,538 |
| Mode SS | |||
|---|---|---|---|
| Quadrant | BADHDUFLAG | Total packets | Discarded packets |
| A | 0 | 120 | 0 |
| B | 0 | 120 | 0 |
| C | 0 | 120 | 0 |
| D | 0 | 120 | 0 |
| Mode M0 | |||
|---|---|---|---|
| Quadrant | BADHDUFLAG | Total packets | Discarded packets |
| A | 0 | 12349 | 1 |
| B | 0 | 18030 | 3 |
| C | 0 | 12817 | 1 |
| D | 0 | 15397 | 1 |
| Mode M9 | |||
|---|---|---|---|
| Quadrant | BADHDUFLAG | Total packets | Discarded packets |
| A | 0 | 12 | 0 |
| B | 0 | 12 | 0 |
| C | 0 | 12 | 0 |
| D | 0 | 12 | 0 |
| Quadrant | Total seconds | Saturated seconds | Saturation percentage |
|---|---|---|---|
| A | 5923 | 28 | 0.472733% |
| B | 5923 | 97 | 1.637684% |
| C | 5923 | 90 | 1.519500% |
| D | 5923 | 45 | 0.759750% |
Noise dominated data is calculated using 1-second bins in cleaned event files. If a bin has >2000 counts, and if more than 50% of those come from <1% of pixels, then it is considered to be noise-dominated and hence unusable.
| Quadrant | # 1 sec bins | Bins with >0 counts | Bins with >2000 counts | High rate bins dominated by noise | Noise dominated (total time) | Noise dominated (detector-on time) | Marked lightcurve |
|---|---|---|---|---|---|---|---|
| A | 7153 | 5924 | 0 | 0 | 0.00% | 0.00% | 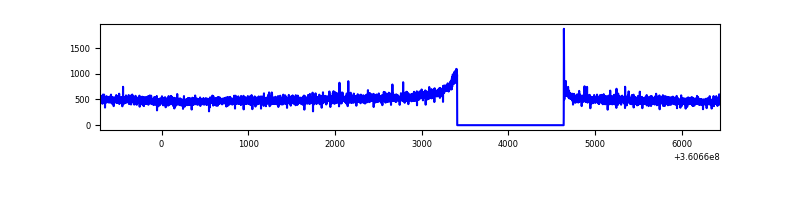 |
| B | 7153 | 5923 | 2 | 2 | 0.03% | 0.03% | 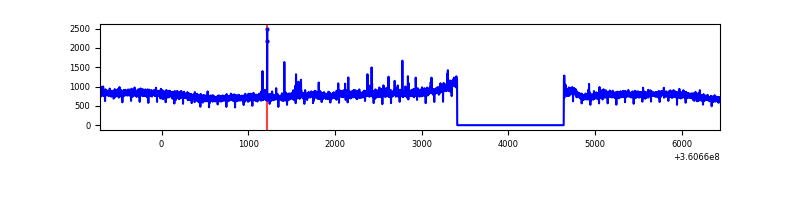 |
| C | 7153 | 5923 | 6 | 6 | 0.08% | 0.10% | 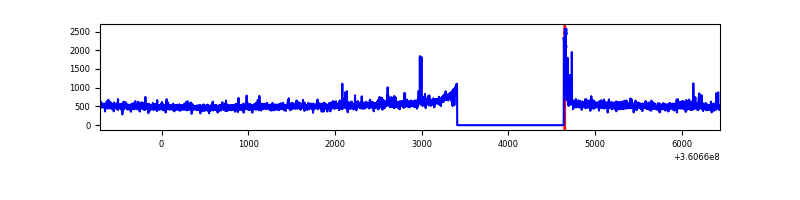 |
| D | 7153 | 5924 | 23 | 23 | 0.32% | 0.39% | 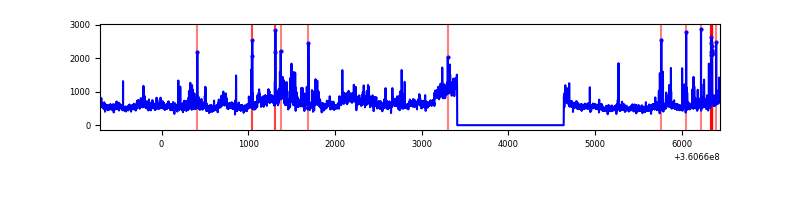 |
Top three noisy pixels from each quadrant. If the there are fewer than three noisy pixels in the level2.evt file, extra rows are filled as -1
| Pixel properties | Quadrant properties | ||||||
|---|---|---|---|---|---|---|---|
| Quadrant | DetID | PixID | Counts | Sigma | Mean | Median | Sigma |
| A | 13 | 254 | 10550 | 63.5 | 769 | 756 | 154.2 |
| A | 3 | 137 | 7148 | 41.44 | 769 | 756 | 154.2 |
| A | 0 | 226 | 6570 | 37.69 | 769 | 756 | 154.2 |
| B | 6 | 159 | 1656294 | 11480.73 | 754 | 736 | 144.2 |
| B | 12 | 111 | 17401 | 115.57 | 754 | 736 | 144.2 |
| B | 11 | 111 | 15704 | 103.8 | 754 | 736 | 144.2 |
| C | 14 | 238 | 118130 | 688.97 | 730 | 738 | 170.4 |
| C | 3 | 233 | 100121 | 583.27 | 730 | 738 | 170.4 |
| C | 0 | 10 | 33951 | 194.93 | 730 | 738 | 170.4 |
| D | 8 | 195 | 725151 | 4111.42 | 746 | 729 | 176.2 |
| D | 12 | 227 | 113049 | 637.47 | 746 | 729 | 176.2 |
| D | 13 | 174 | 47203 | 263.76 | 746 | 729 | 176.2 |
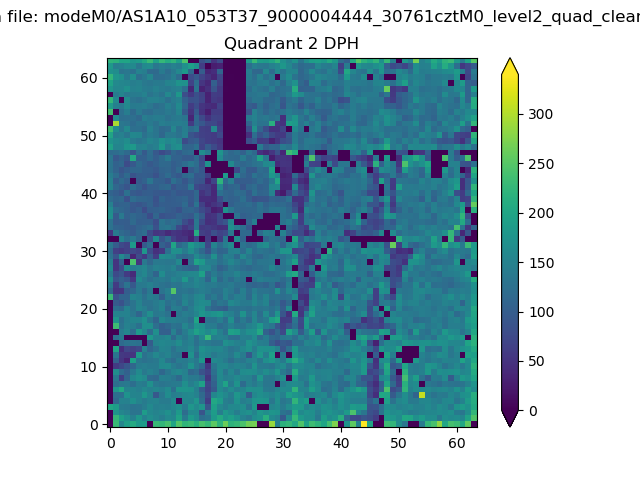
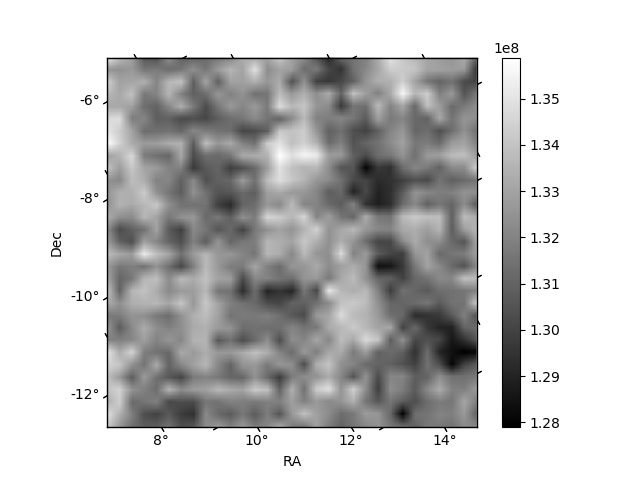
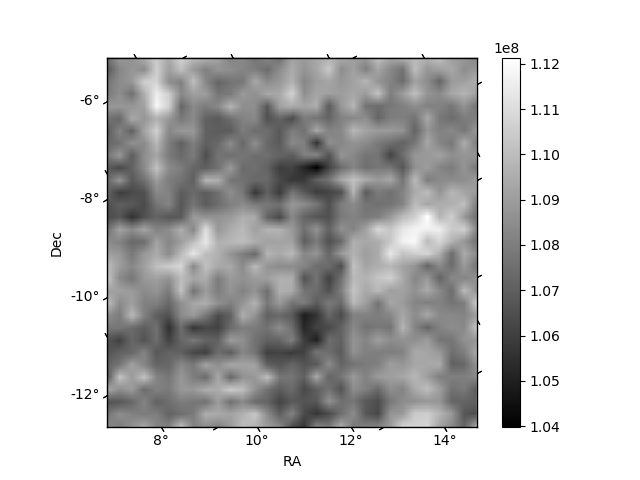
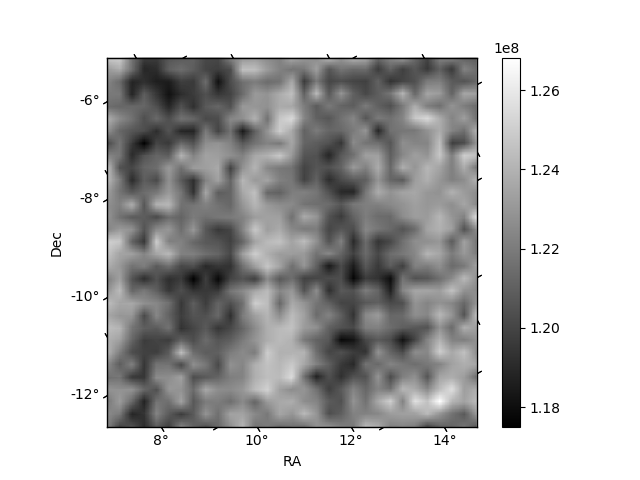
Histogram calculated using DETX and DETY for each event in the final _common_clean file
| Quadrant A | 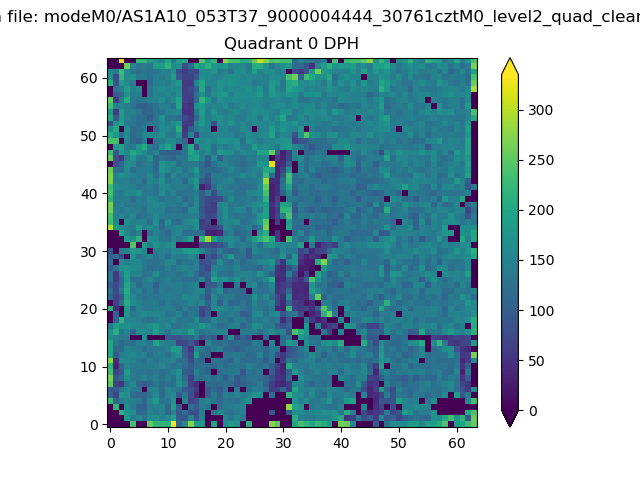 |
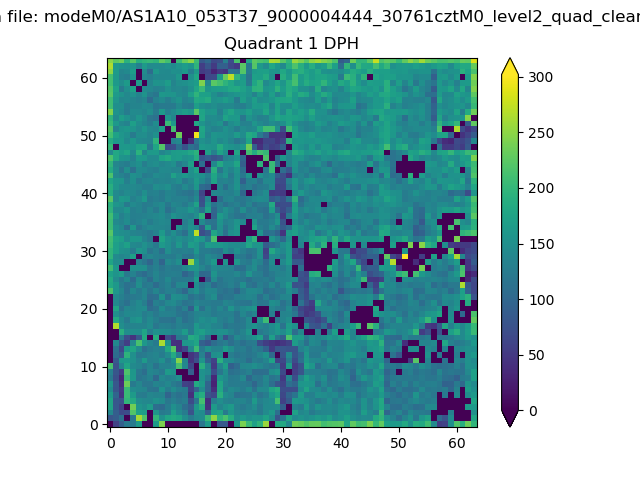 |
Quadrant B |
|---|---|---|---|
| Quadrant D | 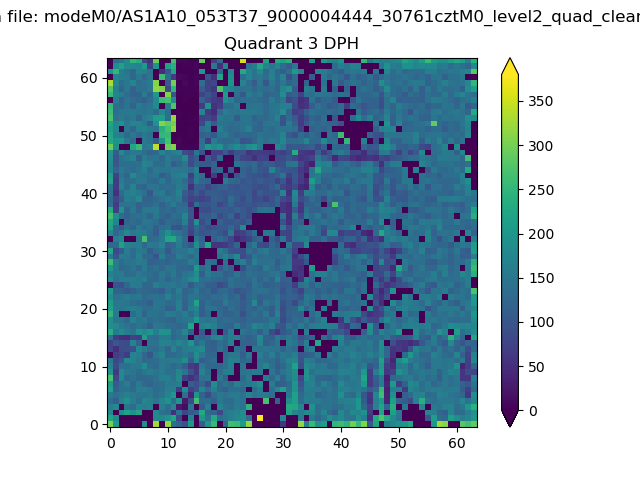 |
 |
Quadrant C |
| Plot type | Count rate plots | Images |
|---|---|---|
| Comparison with Poisson distribution Blue bars denote a histogram of data divided into 1 sec bins. Red curve is a Poisson curve with rate = median count rate of data. |
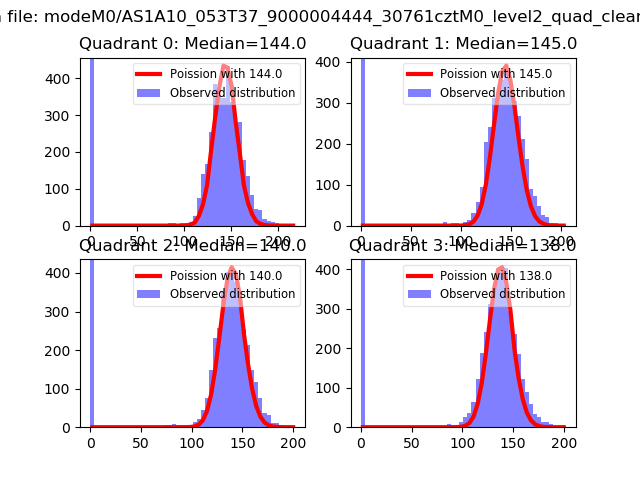 |
 |
| Quadrant-wise count rates Data is divided into 100 sec bins |
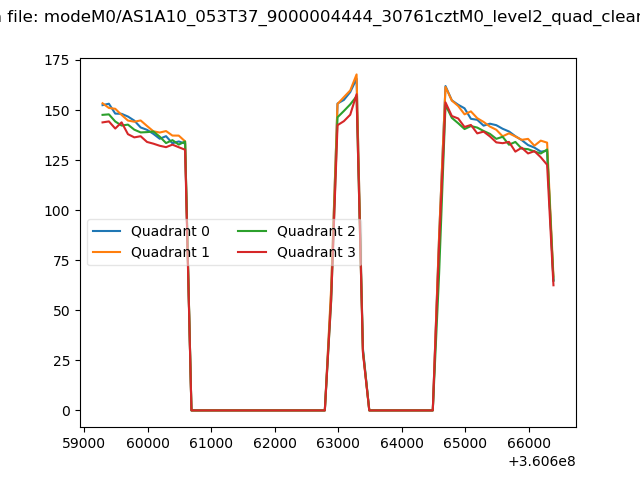 |
|
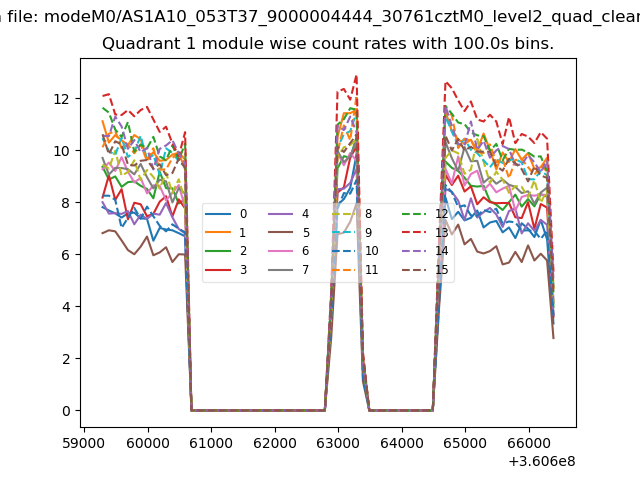
| Module-wise count rates for Quadrant A Data is divided into 100 sec bins |
 |
 |
| Module-wise count rates for Quadrant B Data is divided into 100 sec bins |
 |
 |
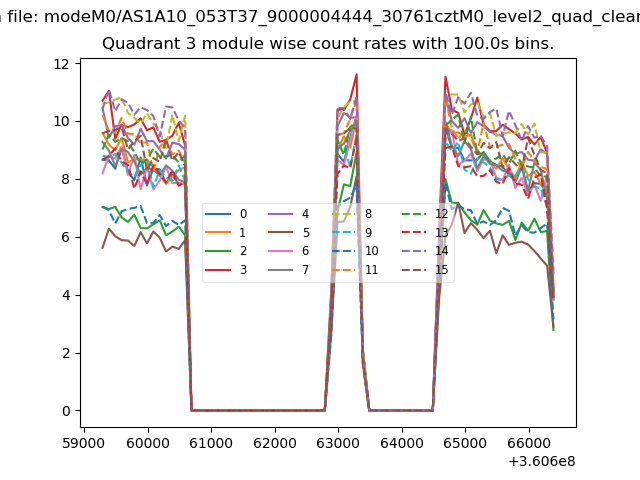
| Module-wise count rates for Quadrant C Data is divided into 100 sec bins |
 |
 |
| Module-wise count rates for Quadrant D Data is divided into 100 sec bins |
 |
 |
| Parameter | Plot |
|---|---|
| CZT HV Monitor | 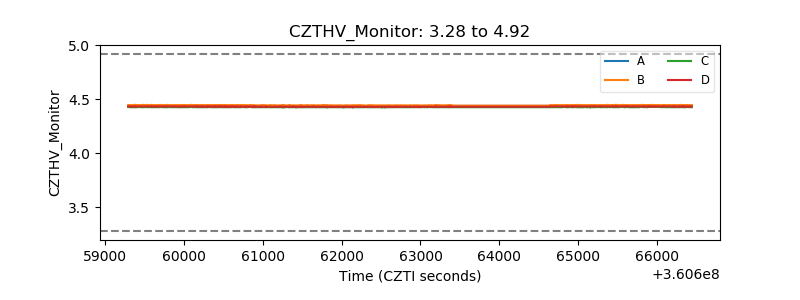 |
| D_VDD | 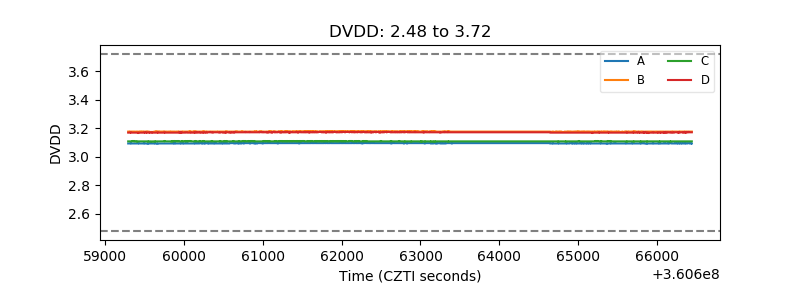 |
| Temperature 1 | 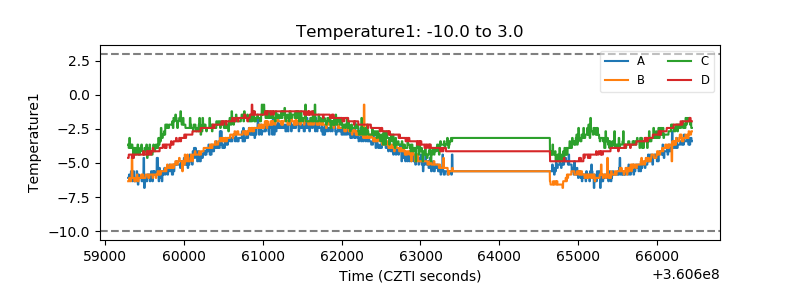 |
| Veto HV Monitor | 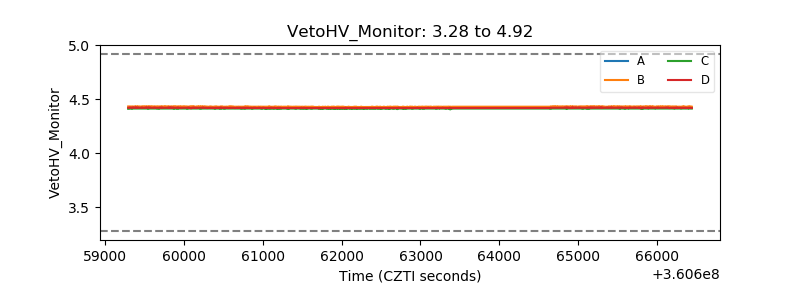 |
| Veto LLD | 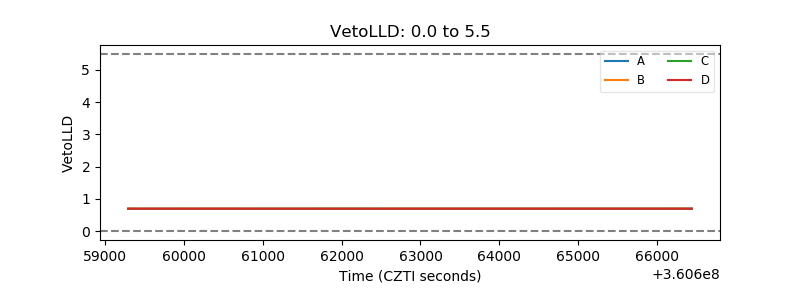 |
| Alpha Counter | 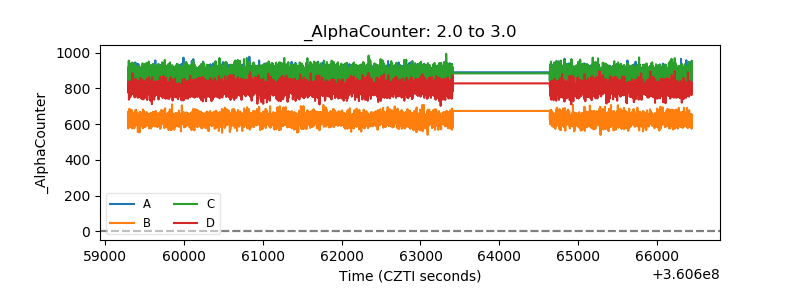 |
| _CPM_Rate | 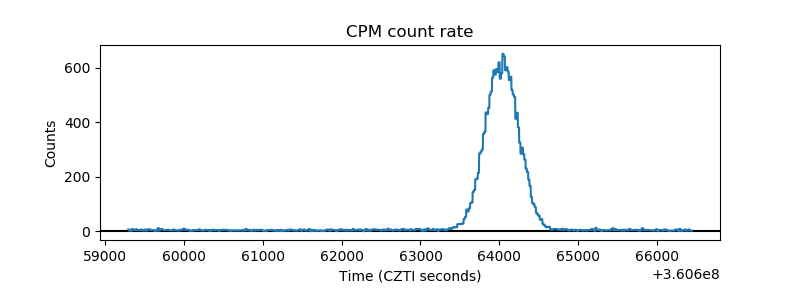 |
| CZT Counter | 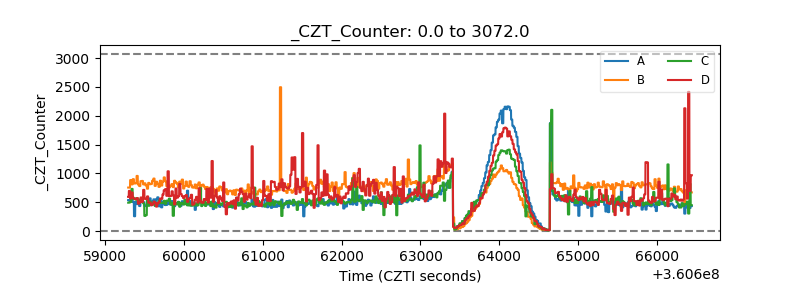 |
| +2.5 Volts monitor |  |
| +5 Volts monitor |  |
| _ROLL_ROT | 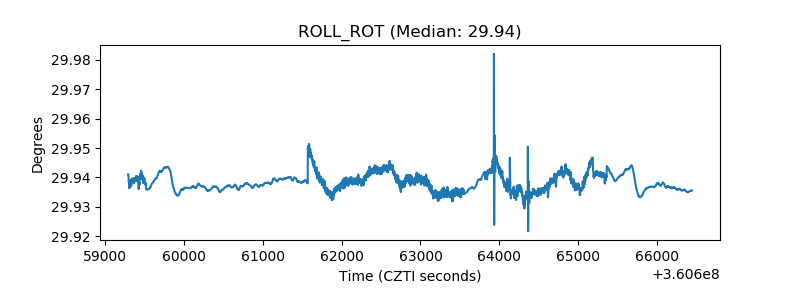 |
| _Roll_DEC | 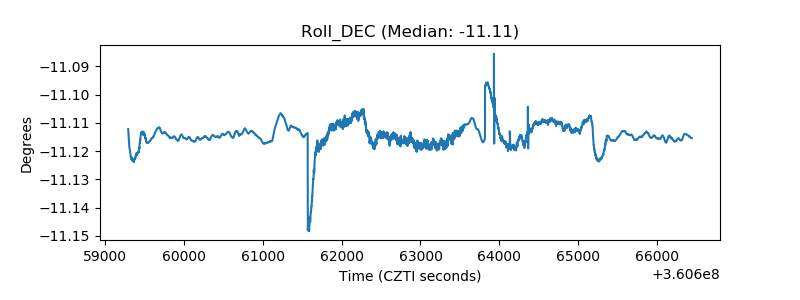 |
| _Roll_RA | 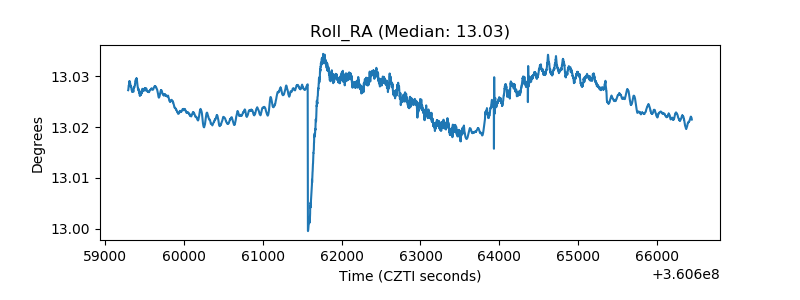 |
| Veto Counter |  |