| Param | Original file | Final file |
|---|---|---|
| Filename | modeM0/AS1A10_053T37_9000004444_30762cztM0_level2.evt | modeM0/AS1A10_053T37_9000004444_30762cztM0_level2_quad_clean.evt |
| Size (bytes) | 557,280,000 | 81,475,200 |
| Size | 531.5 MB | 77.7 MB |
| Events in quadrant A | 3,028,077 | 521,743 |
| Events in quadrant B | 4,718,003 | 521,379 |
| Events in quadrant C | 3,155,813 | 507,108 |
| Events in quadrant D | 5,557,980 | 486,357 |
| Mode SS | |||
|---|---|---|---|
| Quadrant | BADHDUFLAG | Total packets | Discarded packets |
| A | 0 | 128 | 4 |
| B | 0 | 128 | 2 |
| C | 0 | 128 | 2 |
| D | 0 | 128 | 2 |
| Mode M0 | |||
|---|---|---|---|
| Quadrant | BADHDUFLAG | Total packets | Discarded packets |
| A | 0 | 12910 | 189 |
| B | 0 | 18979 | 349 |
| C | 0 | 13165 | 201 |
| D | 0 | 21354 | 392 |
| Mode M9 | |||
|---|---|---|---|
| Quadrant | BADHDUFLAG | Total packets | Discarded packets |
| A | 0 | 9 | 0 |
| B | 0 | 10 | 1 |
| C | 0 | 9 | 0 |
| D | 0 | 9 | 0 |
| Quadrant | Total seconds | Saturated seconds | Saturation percentage |
|---|---|---|---|
| A | 6181 | 73 | 1.181039% |
| B | 6159 | 138 | 2.240623% |
| C | 6175 | 111 | 1.797571% |
| D | 6149 | 391 | 6.358758% |
Noise dominated data is calculated using 1-second bins in cleaned event files. If a bin has >2000 counts, and if more than 50% of those come from <1% of pixels, then it is considered to be noise-dominated and hence unusable.
| Quadrant | # 1 sec bins | Bins with >0 counts | Bins with >2000 counts | High rate bins dominated by noise | Noise dominated (total time) | Noise dominated (detector-on time) | Marked lightcurve |
|---|---|---|---|---|---|---|---|
| A | 7153 | 6215 | 1 | 1 | 0.01% | 0.02% | 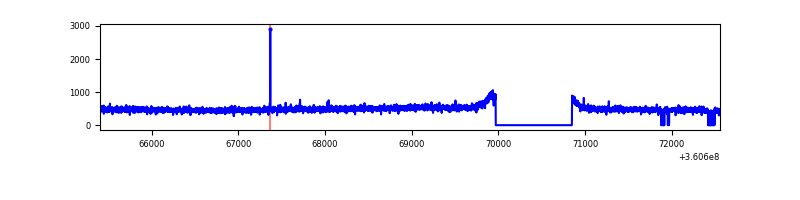 |
| B | 7154 | 6179 | 1 | 1 | 0.01% | 0.02% | 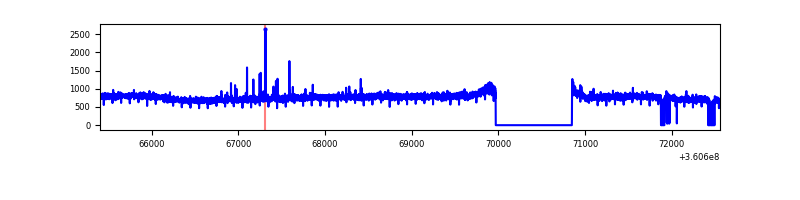 |
| C | 7156 | 6203 | 0 | 0 | 0.00% | 0.00% | 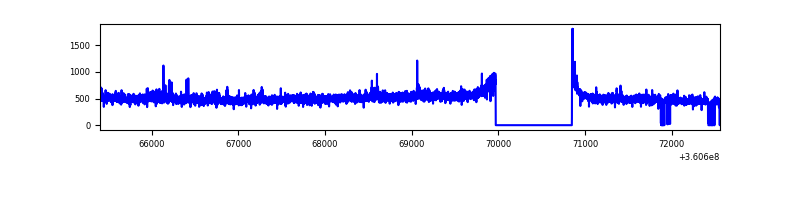 |
| D | 7151 | 6165 | 338 | 338 | 4.73% | 5.48% | 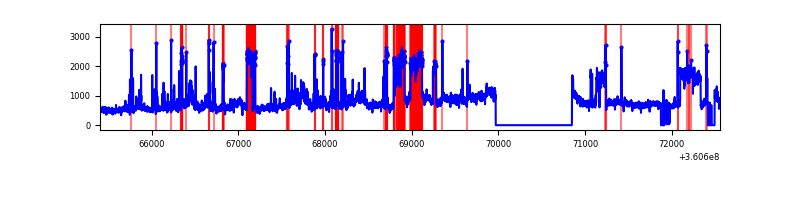 |
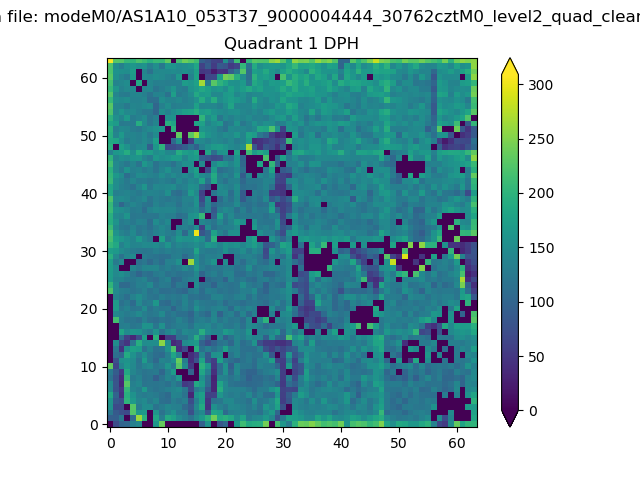
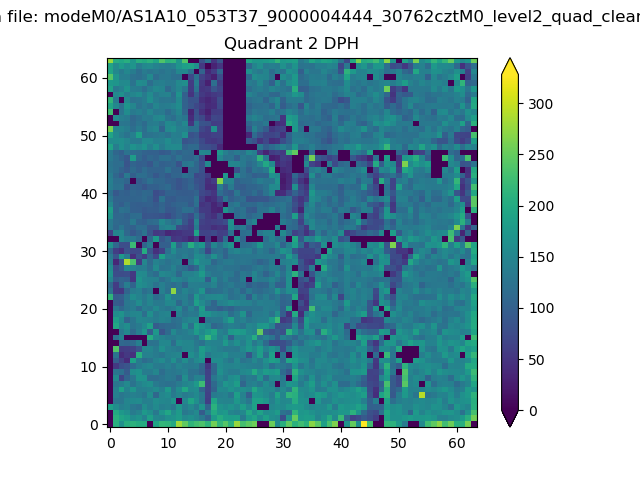
Top three noisy pixels from each quadrant. If the there are fewer than three noisy pixels in the level2.evt file, extra rows are filled as -1
| Pixel properties | Quadrant properties | ||||||
|---|---|---|---|---|---|---|---|
| Quadrant | DetID | PixID | Counts | Sigma | Mean | Median | Sigma |
| A | 13 | 254 | 10957 | 64.56 | 783 | 769 | 157.8 |
| A | 3 | 137 | 7687 | 43.84 | 783 | 769 | 157.8 |
| A | 0 | 226 | 6710 | 37.65 | 783 | 769 | 157.8 |
| B | 6 | 159 | 1669637 | 11349.2 | 765 | 745 | 147.0 |
| B | 12 | 111 | 18192 | 118.65 | 765 | 745 | 147.0 |
| B | 11 | 111 | 16581 | 107.69 | 765 | 745 | 147.0 |
| C | 14 | 238 | 121245 | 690.4 | 745 | 751 | 174.5 |
| C | 3 | 233 | 85751 | 487.03 | 745 | 751 | 174.5 |
| C | 0 | 10 | 16512 | 90.31 | 745 | 751 | 174.5 |
| D | 8 | 195 | 2375898 | 13438.93 | 750 | 732 | 176.7 |
| D | 2 | 250 | 75794 | 424.71 | 750 | 732 | 176.7 |
| D | 13 | 249 | 69868 | 391.18 | 750 | 732 | 176.7 |
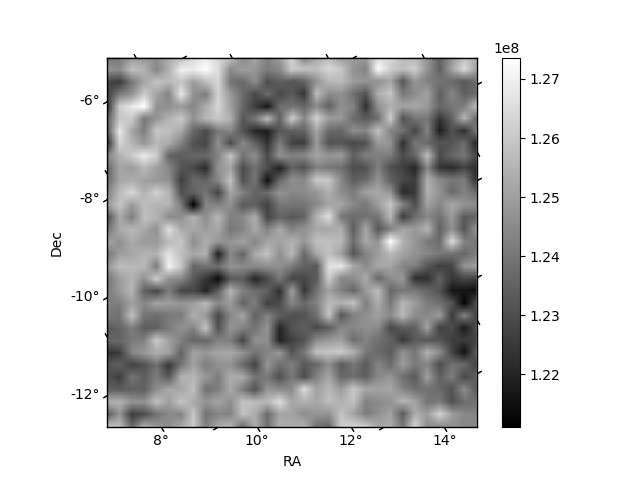
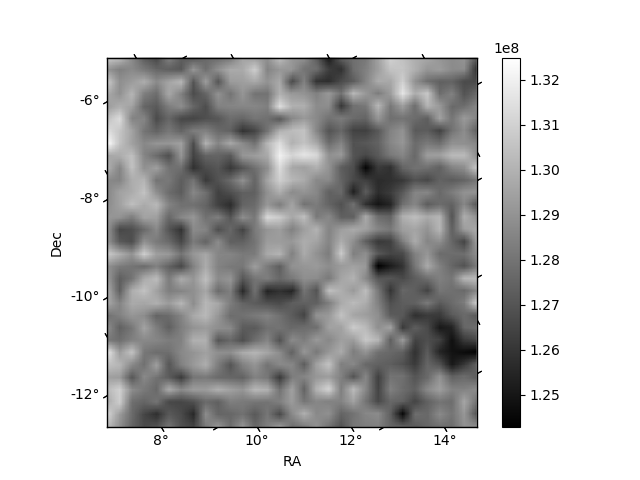
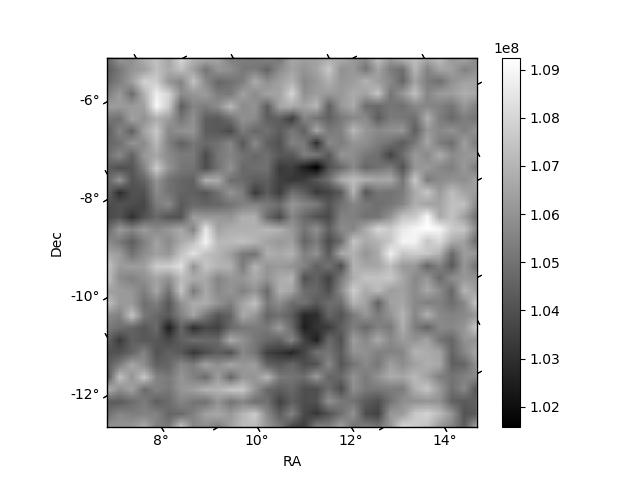
Histogram calculated using DETX and DETY for each event in the final _common_clean file
| Quadrant A | 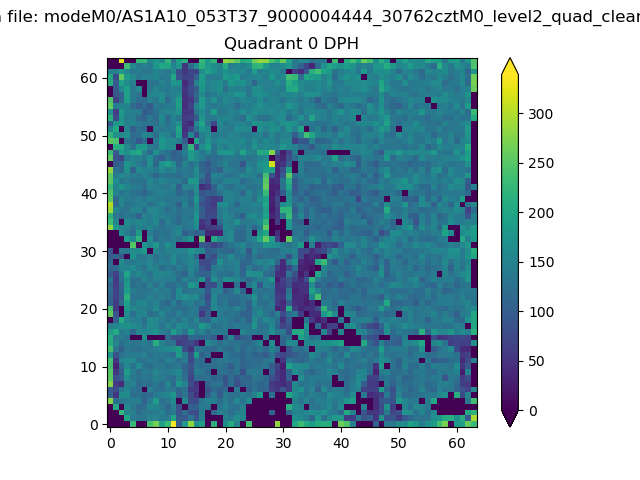 |
 |
Quadrant B |
|---|---|---|---|
| Quadrant D | 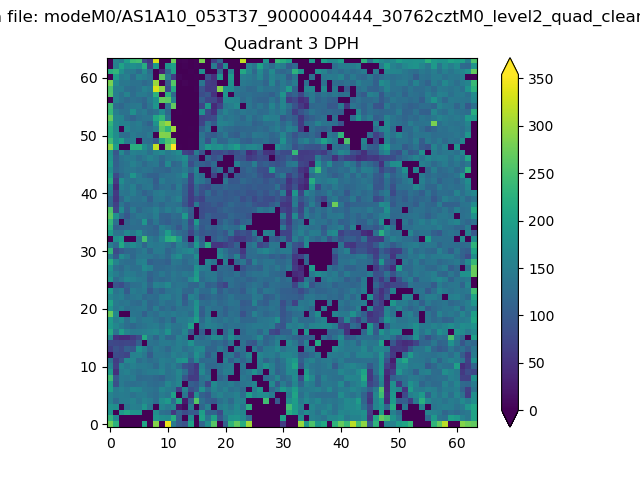 |
 |
Quadrant C |
| Plot type | Count rate plots | Images |
|---|---|---|
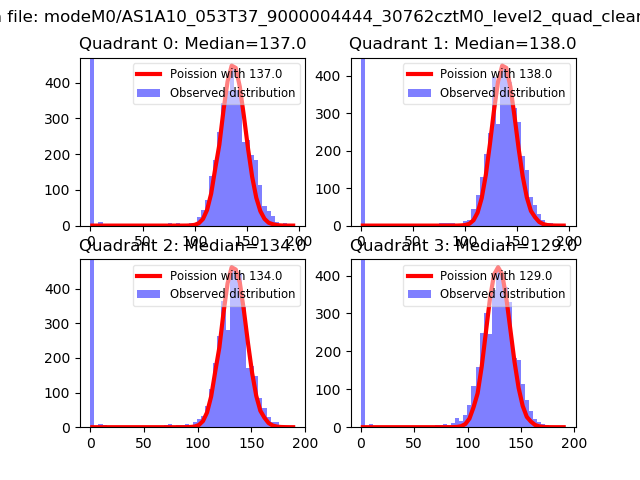
| Comparison with Poisson distribution Blue bars denote a histogram of data divided into 1 sec bins. Red curve is a Poisson curve with rate = median count rate of data. |
 |
 |
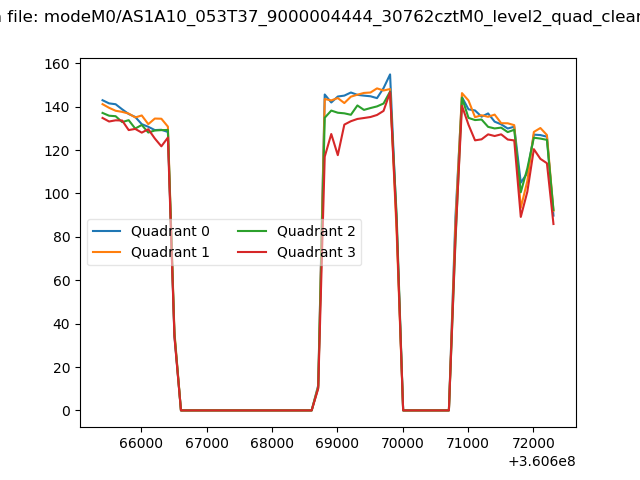
| Quadrant-wise count rates Data is divided into 100 sec bins |
 |
|
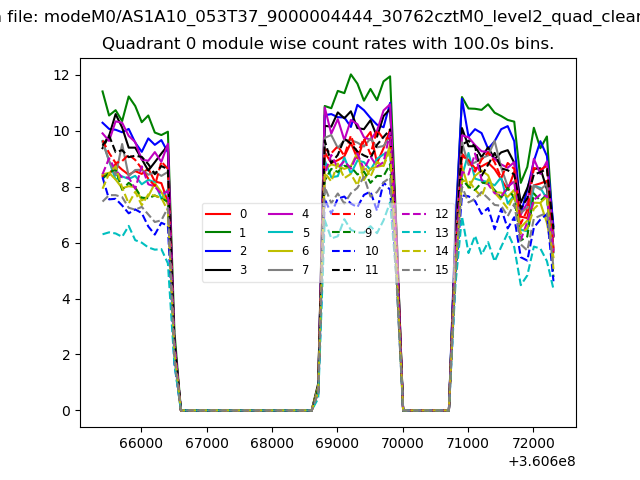
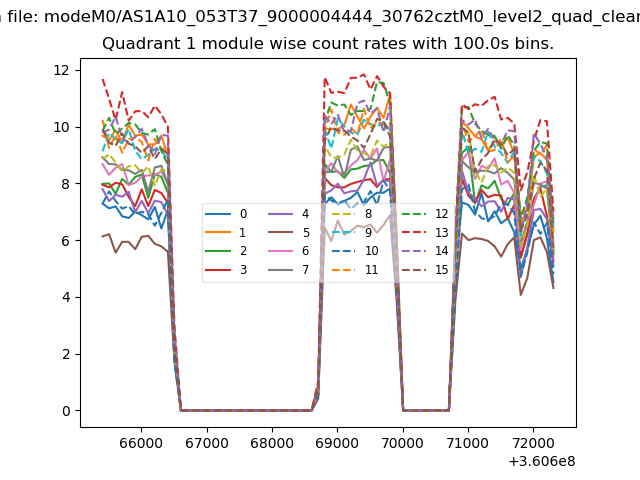
| Module-wise count rates for Quadrant A Data is divided into 100 sec bins |
 |
 |
| Module-wise count rates for Quadrant B Data is divided into 100 sec bins |
 |
 |
| Module-wise count rates for Quadrant C Data is divided into 100 sec bins |
 |
 |
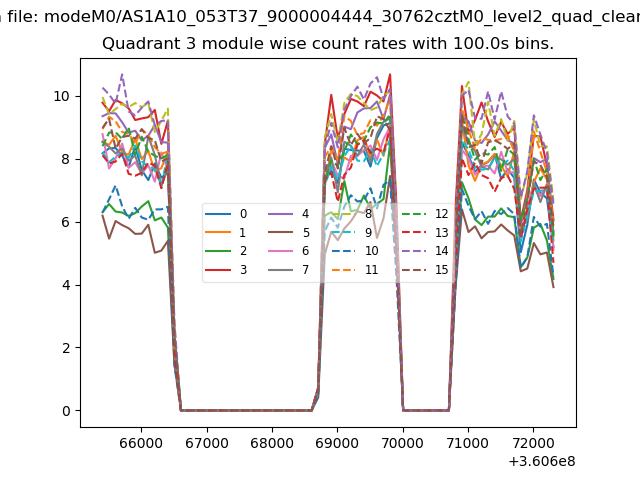
| Module-wise count rates for Quadrant D Data is divided into 100 sec bins |
 |
 |
| Parameter | Plot |
|---|---|
| CZT HV Monitor | 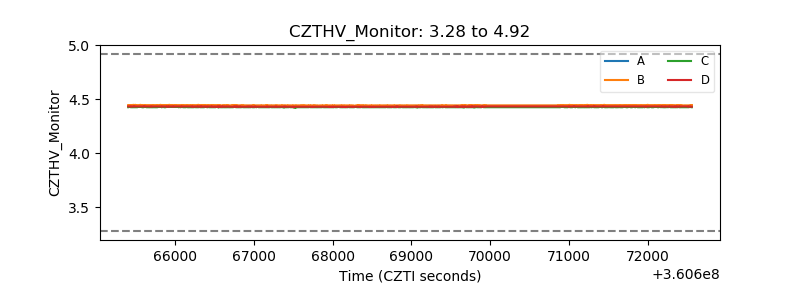 |
| D_VDD | 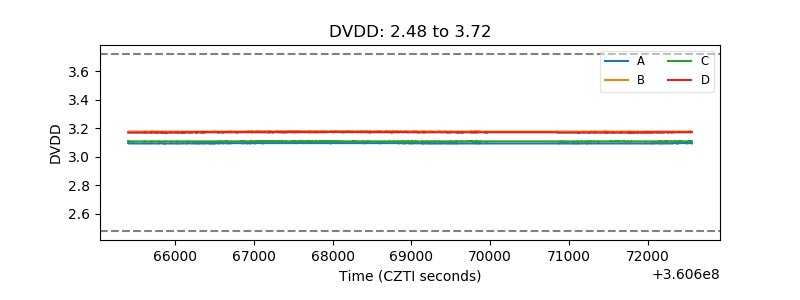 |
| Temperature 1 | 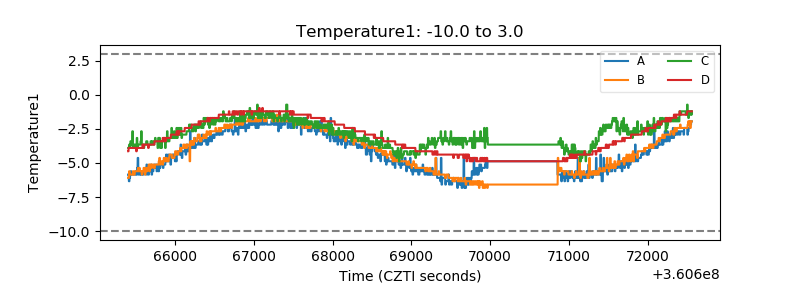 |
| Veto HV Monitor | 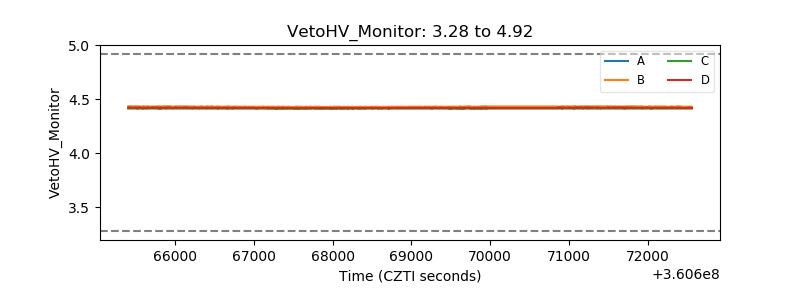 |
| Veto LLD | 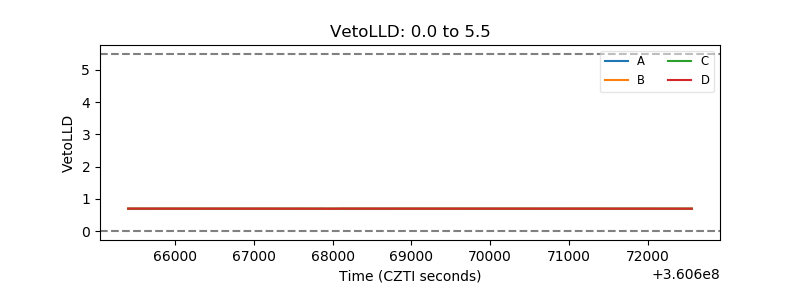 |
| Alpha Counter |  |
| _CPM_Rate |  |
| CZT Counter | 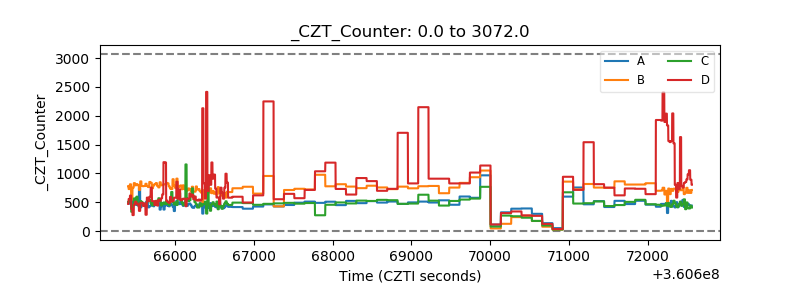 |
| +2.5 Volts monitor |  |
| +5 Volts monitor | 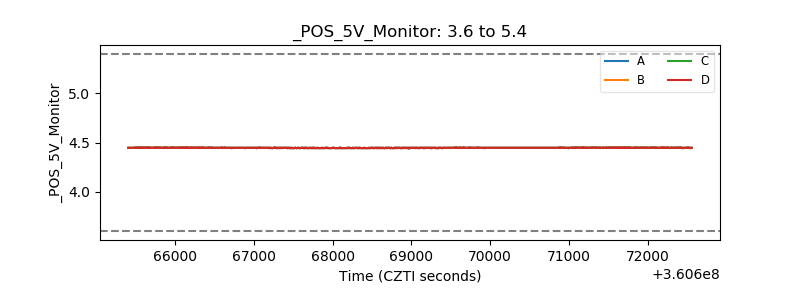 |
| _ROLL_ROT | 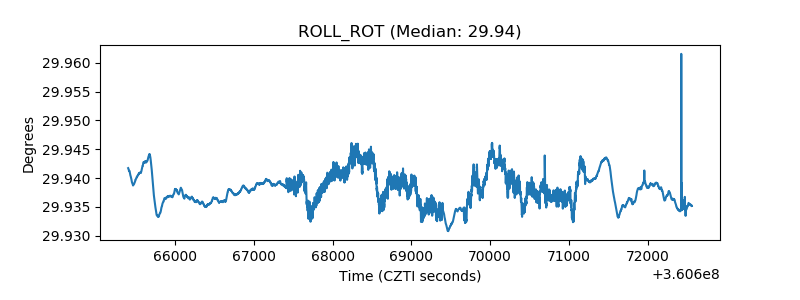 |
| _Roll_DEC | 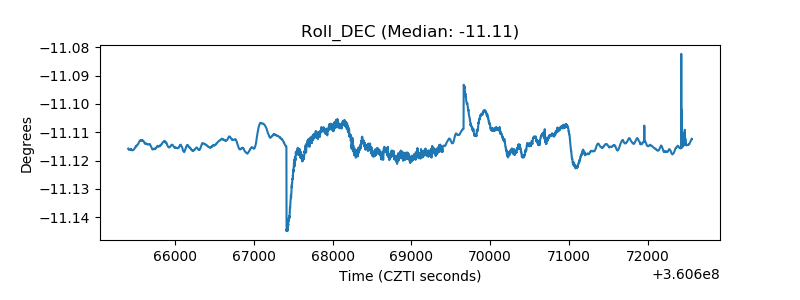 |
| _Roll_RA | 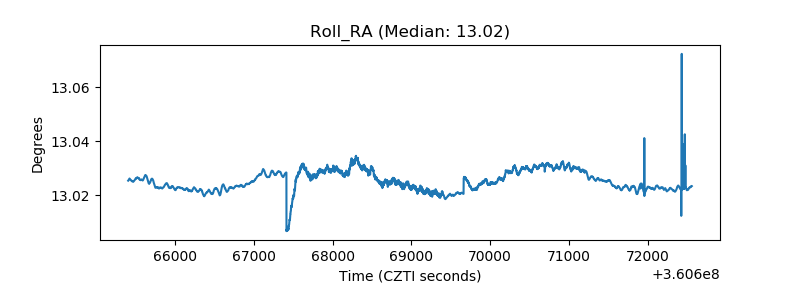 |
| Veto Counter | 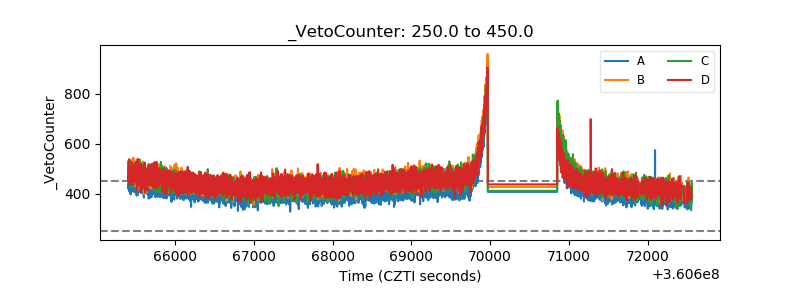 |