| Param | Original file | Final file |
|---|---|---|
| Filename | modeM0/AS1A10_053T37_9000004444_30763cztM0_level2.evt | modeM0/AS1A10_053T37_9000004444_30763cztM0_level2_quad_clean.evt |
| Size (bytes) | 658,696,320 | 86,241,600 |
| Size | 628.2 MB | 82.2 MB |
| Events in quadrant A | 3,270,418 | 548,497 |
| Events in quadrant B | 5,247,157 | 550,131 |
| Events in quadrant C | 3,572,812 | 536,311 |
| Events in quadrant D | 7,399,454 | 503,005 |
| Mode SS | |||
|---|---|---|---|
| Quadrant | BADHDUFLAG | Total packets | Discarded packets |
| A | 0 | 138 | 0 |
| B | 0 | 138 | 0 |
| C | 0 | 138 | 0 |
| D | 0 | 138 | 0 |
| Mode M0 | |||
|---|---|---|---|
| Quadrant | BADHDUFLAG | Total packets | Discarded packets |
| A | 0 | 13938 | 1 |
| B | 0 | 20674 | 1 |
| C | 0 | 14755 | 1 |
| D | 0 | 27033 | 1 |
| Mode M9 | |||
|---|---|---|---|
| Quadrant | BADHDUFLAG | Total packets | Discarded packets |
| A | 0 | 4 | 0 |
| B | 0 | 4 | 0 |
| C | 0 | 4 | 0 |
| D | 0 | 4 | 0 |
| Quadrant | Total seconds | Saturated seconds | Saturation percentage |
|---|---|---|---|
| A | 6792 | 120 | 1.766784% |
| B | 6793 | 187 | 2.752834% |
| C | 6793 | 207 | 3.047255% |
| D | 6793 | 611 | 8.994553% |
Noise dominated data is calculated using 1-second bins in cleaned event files. If a bin has >2000 counts, and if more than 50% of those come from <1% of pixels, then it is considered to be noise-dominated and hence unusable.
| Quadrant | # 1 sec bins | Bins with >0 counts | Bins with >2000 counts | High rate bins dominated by noise | Noise dominated (total time) | Noise dominated (detector-on time) | Marked lightcurve |
|---|---|---|---|---|---|---|---|
| A | 7252 | 6792 | 0 | 0 | 0.00% | 0.00% | 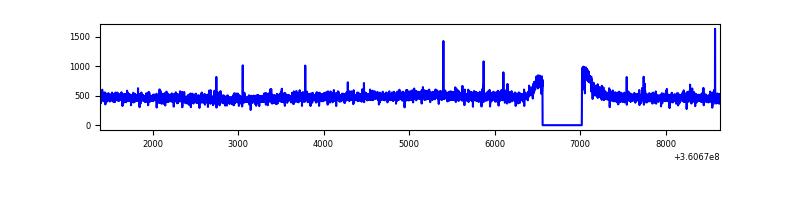 |
| B | 7253 | 6793 | 1 | 1 | 0.01% | 0.01% | 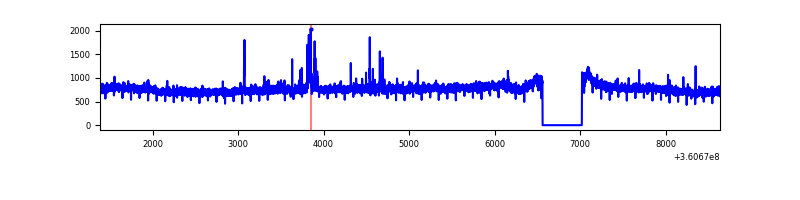 |
| C | 7253 | 6793 | 38 | 38 | 0.52% | 0.56% | 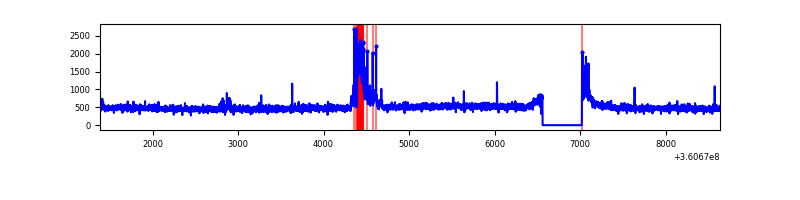 |
| D | 7253 | 6793 | 584 | 584 | 8.05% | 8.60% | 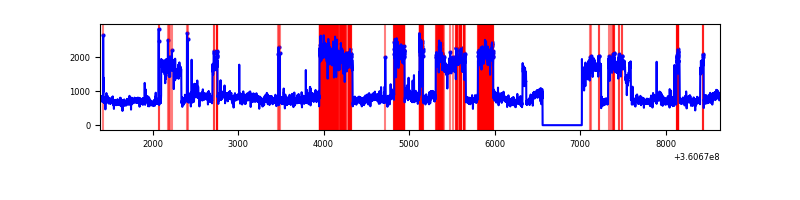 |
Top three noisy pixels from each quadrant. If the there are fewer than three noisy pixels in the level2.evt file, extra rows are filled as -1
| Pixel properties | Quadrant properties | ||||||
|---|---|---|---|---|---|---|---|
| Quadrant | DetID | PixID | Counts | Sigma | Mean | Median | Sigma |
| A | 13 | 254 | 12408 | 67.76 | 844 | 826 | 170.9 |
| A | 3 | 137 | 8664 | 45.85 | 844 | 826 | 170.9 |
| A | 0 | 226 | 7124 | 36.84 | 844 | 826 | 170.9 |
| B | 6 | 159 | 1875303 | 11621.86 | 831 | 809 | 161.3 |
| B | 0 | 182 | 44376 | 270.12 | 831 | 809 | 161.3 |
| B | 12 | 111 | 20069 | 119.41 | 831 | 809 | 161.3 |
| C | 3 | 233 | 243959 | 1282.51 | 806 | 812 | 189.6 |
| C | 14 | 238 | 129131 | 676.84 | 806 | 812 | 189.6 |
| C | 0 | 10 | 38483 | 198.7 | 806 | 812 | 189.6 |
| D | 8 | 195 | 4219811 | 21890.66 | 809 | 787 | 192.7 |
| D | 2 | 250 | 44921 | 228.99 | 809 | 787 | 192.7 |
| D | 2 | 234 | 30786 | 155.65 | 809 | 787 | 192.7 |
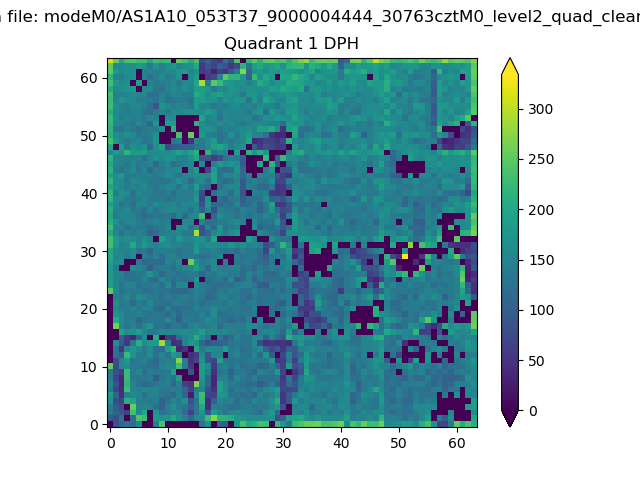
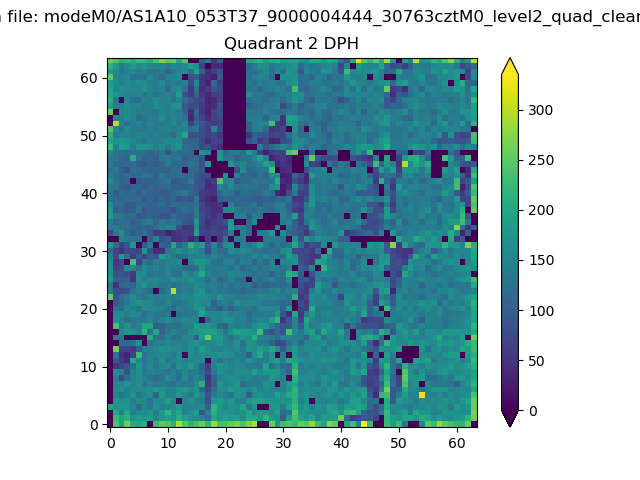
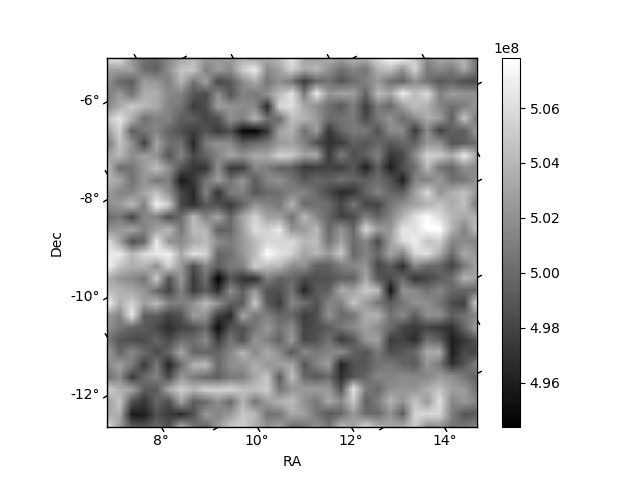
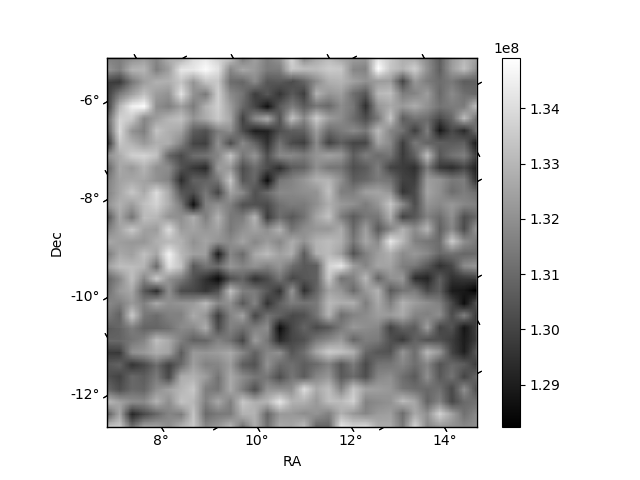
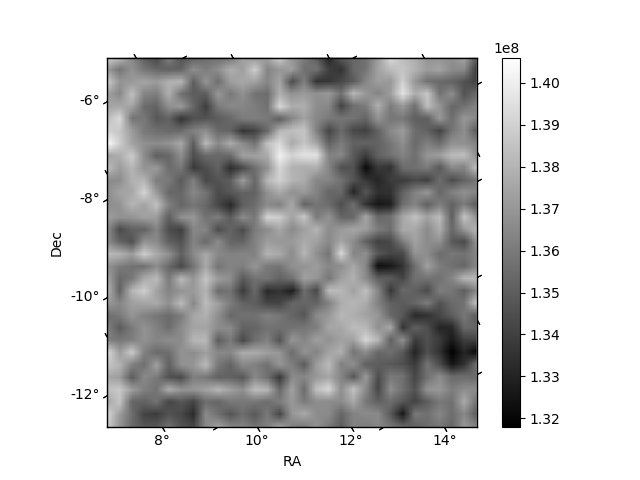
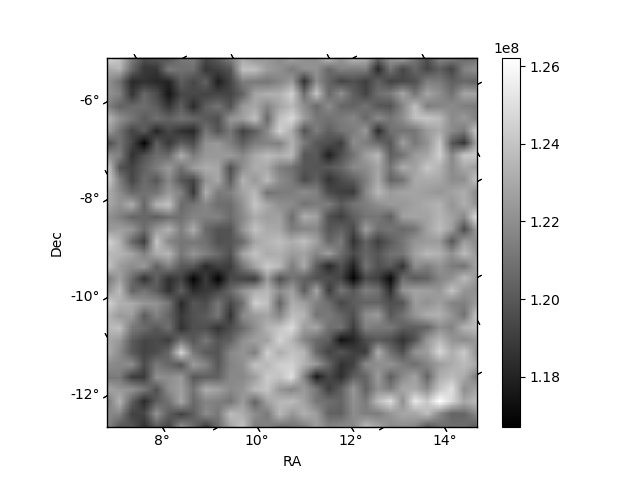
Histogram calculated using DETX and DETY for each event in the final _common_clean file
| Quadrant A |  |
 |
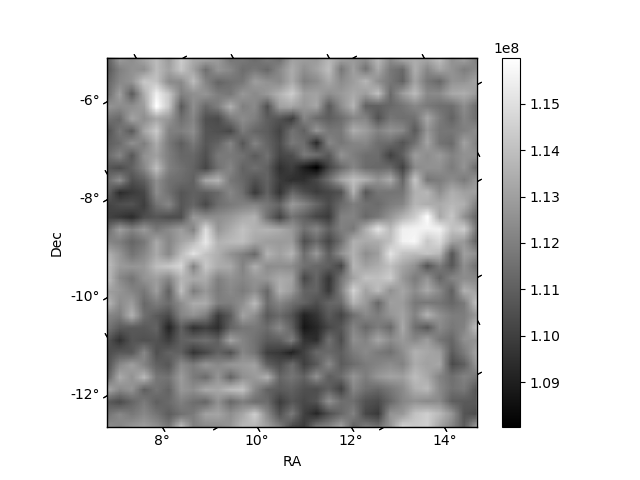
Quadrant B |
|---|---|---|---|
| Quadrant D | 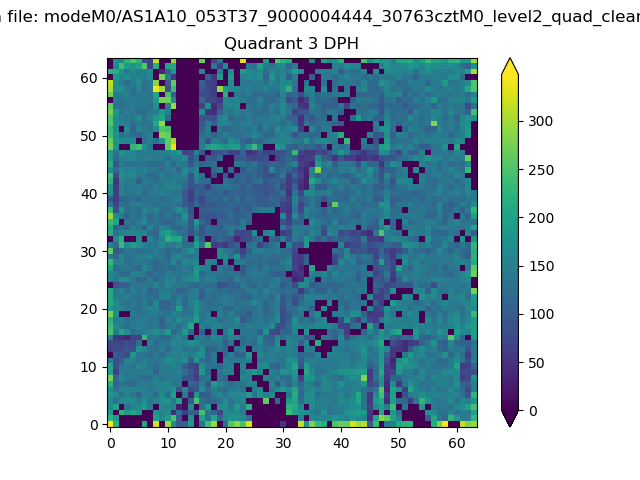 |
 |
Quadrant C |
| Plot type | Count rate plots | Images |
|---|---|---|
| Comparison with Poisson distribution Blue bars denote a histogram of data divided into 1 sec bins. Red curve is a Poisson curve with rate = median count rate of data. |
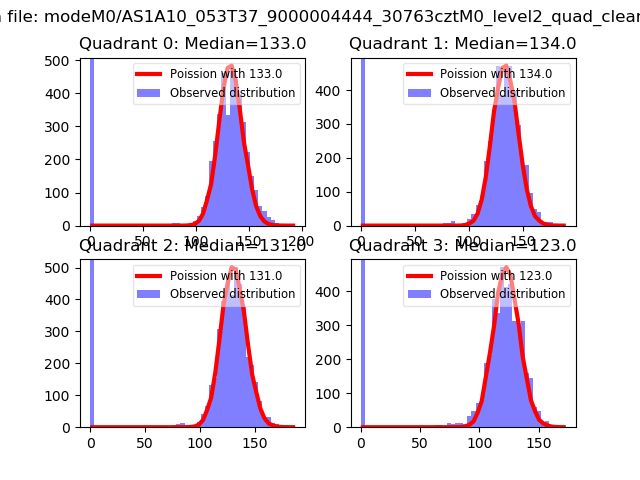 |
 |
| Quadrant-wise count rates Data is divided into 100 sec bins |
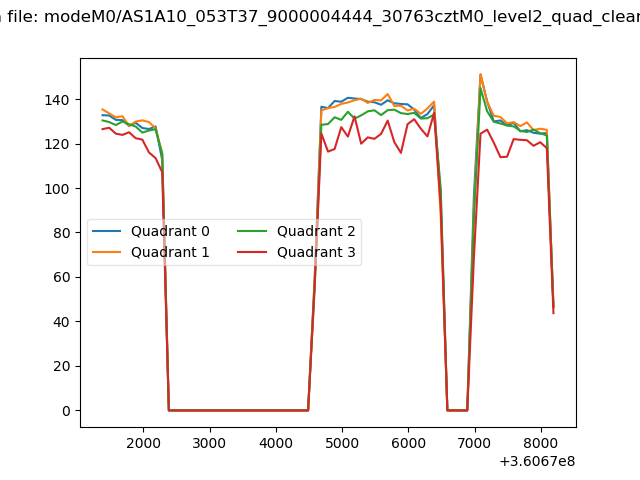 |
|
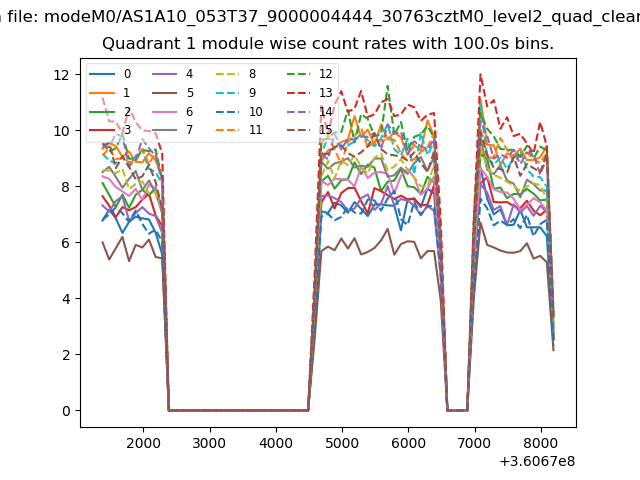
| Module-wise count rates for Quadrant A Data is divided into 100 sec bins |
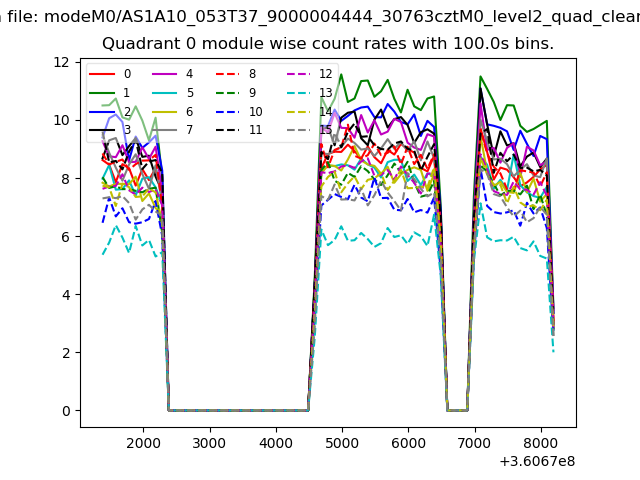 |
 |
| Module-wise count rates for Quadrant B Data is divided into 100 sec bins |
 |
 |
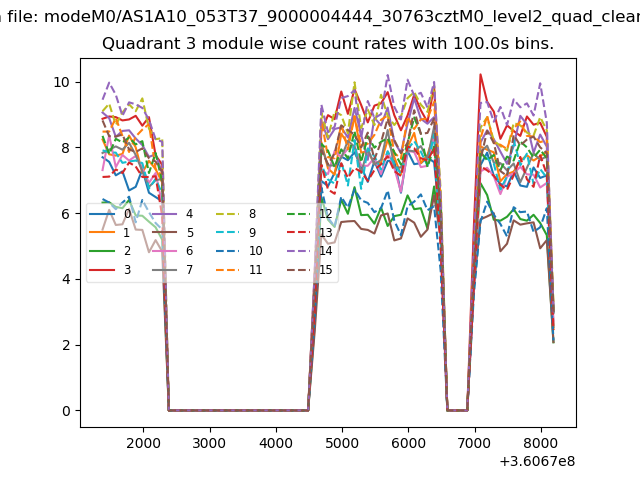
| Module-wise count rates for Quadrant C Data is divided into 100 sec bins |
 |
 |
| Module-wise count rates for Quadrant D Data is divided into 100 sec bins |
 |
 |
| Parameter | Plot |
|---|---|
| CZT HV Monitor | 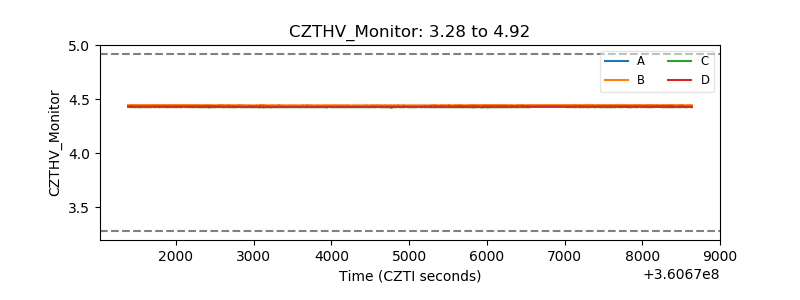 |
| D_VDD | 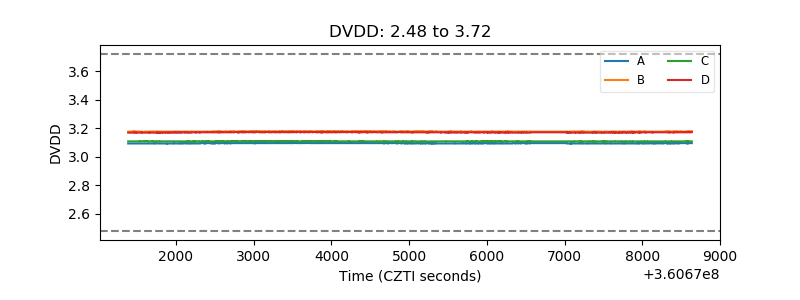 |
| Temperature 1 | 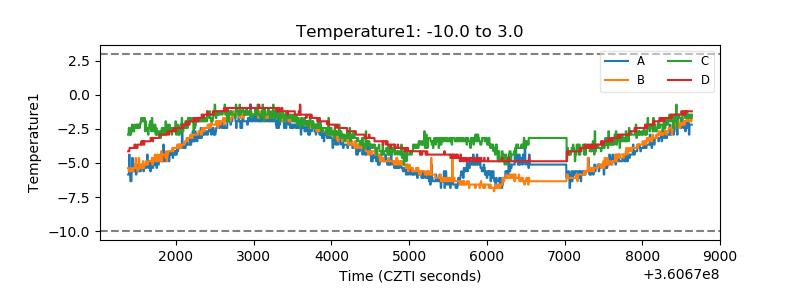 |
| Veto HV Monitor | 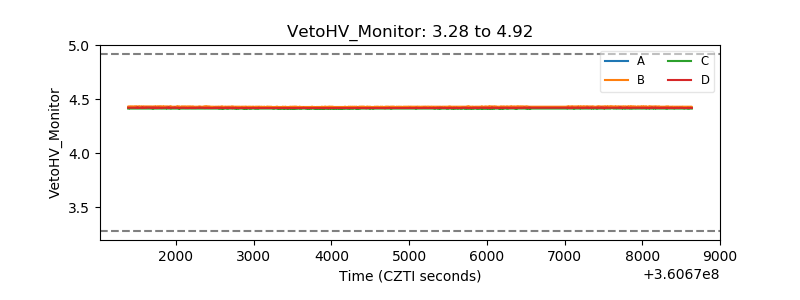 |
| Veto LLD | 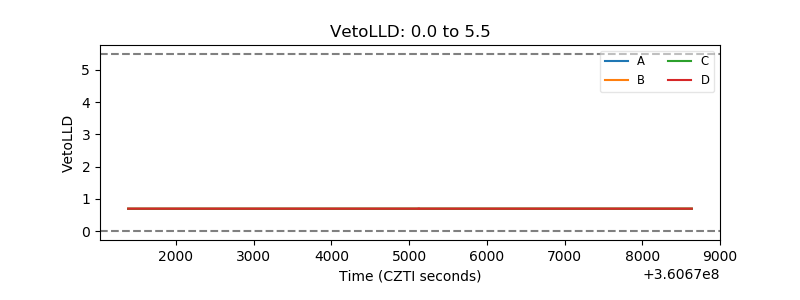 |
| Alpha Counter |  |
| _CPM_Rate |  |
| CZT Counter | 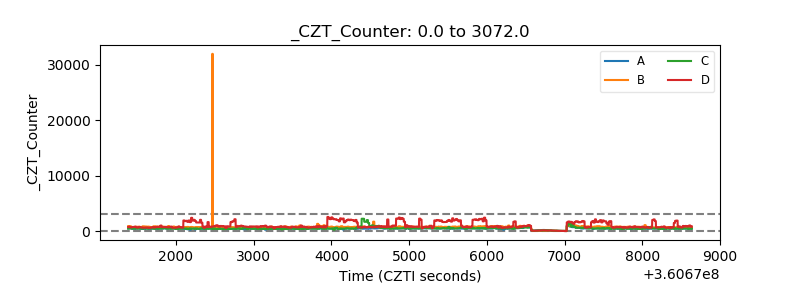 |
| +2.5 Volts monitor |  |
| +5 Volts monitor |  |
| _ROLL_ROT | 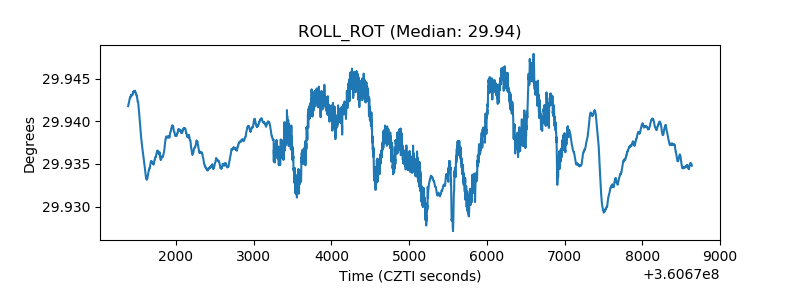 |
| _Roll_DEC | 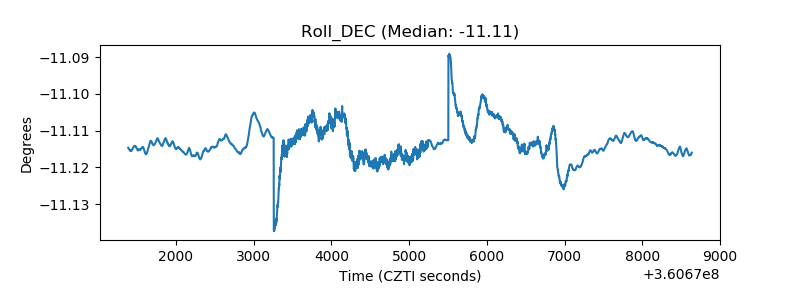 |
| _Roll_RA | 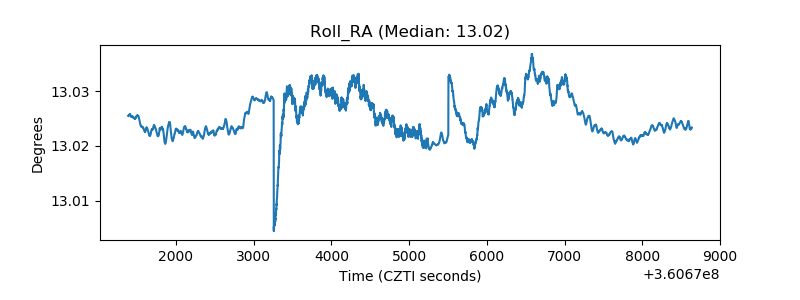 |
| Veto Counter | 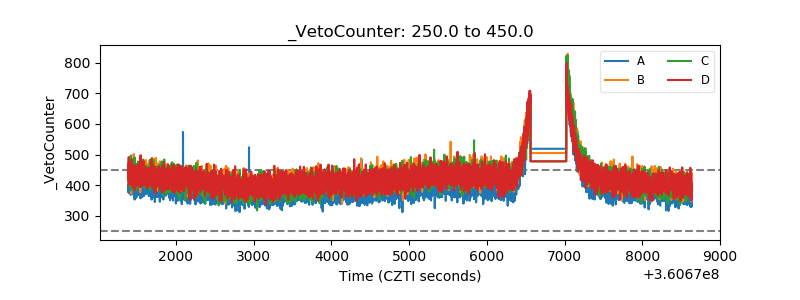 |