| Param | Original file | Final file |
|---|---|---|
| Filename | modeM0/AS1A10_071T12_9000004446cztM0_level2.fits | modeM0/AS1A10_071T12_9000004446cztM0_level2_quad_clean.evt |
| Size (bytes) | 691,801,920 | 488,050,560 |
| Size | 659.8 MB | 465.4 MB |
| Events in quadrant A | 4,418,942 | 2,715,892 |
| Events in quadrant B | 4,107,954 | 2,694,958 |
| Events in quadrant C | 4,150,354 | 2,539,176 |
| Events in quadrant D | 3,596,396 | 2,151,955 |
| Mode SS | |||
|---|---|---|---|
| Quadrant | BADHDUFLAG | Total packets | Discarded packets |
| A | 0 | 1388 | 0 |
| B | 0 | 1388 | 0 |
| C | 0 | 1388 | 0 |
| D | 0 | 1388 | 0 |
| Mode M9 | |||
|---|---|---|---|
| Quadrant | BADHDUFLAG | Total packets | Discarded packets |
| A | 0 | 117 | 0 |
| B | 0 | 117 | 0 |
| C | 0 | 117 | 0 |
| D | 0 | 117 | 0 |
| Mode M0 | |||
|---|---|---|---|
| Quadrant | BADHDUFLAG | Total packets | Discarded packets |
| A | 0 | 149693 | 0 |
| B | 0 | 208456 | 0 |
| C | 0 | 155282 | 0 |
| D | 0 | 239020 | 0 |
| Quadrant | Total seconds | Saturated seconds | Saturation percentage |
|---|---|---|---|
| A | 68181 | 1369 | 2.007891% |
| B | 68181 | 1712 | 2.510963% |
| C | 68181 | 2069 | 3.034570% |
| D | 68181 | 5616 | 8.236899% |
Noise dominated data is calculated using 1-second bins in cleaned event files. If a bin has >2000 counts, and if more than 50% of those come from <1% of pixels, then it is considered to be noise-dominated and hence unusable.
| Quadrant | # 1 sec bins | Bins with >0 counts | Bins with >2000 counts | High rate bins dominated by noise | Noise dominated (total time) | Noise dominated (detector-on time) | Marked lightcurve |
|---|---|---|---|---|---|---|---|
| A | 79606 | 68164 | 0 | 0 | 0.00% | 0.00% | 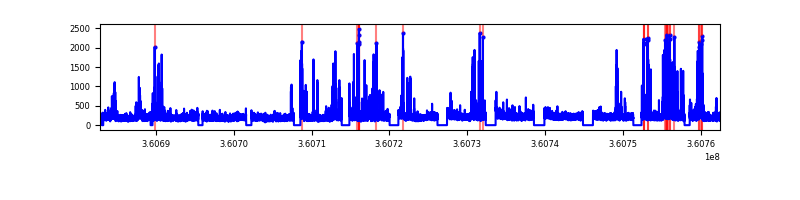 |
| B | 79606 | 68163 | 0 | 0 | 0.00% | 0.00% |  |
| C | 79606 | 68155 | 0 | 0 | 0.00% | 0.00% |  |
| D | 79605 | 68156 | 0 | 0 | 0.00% | 0.00% |  |
Top three noisy pixels from each quadrant. If the there are fewer than three noisy pixels in the level2.evt file, extra rows are filled as -1
| Pixel properties | Quadrant properties | ||||||
|---|---|---|---|---|---|---|---|
| Quadrant | DetID | PixID | Counts | Sigma | Mean | Median | Sigma |
| A | 0 | 29 | 3608 | 9.01 | 1151 | 1084 | 280.0 |
| A | 7 | 110 | 3308 | 7.94 | 1151 | 1084 | 280.0 |
| A | 9 | 19 | 3250 | 7.73 | 1151 | 1084 | 280.0 |
| B | 2 | 9 | 3252 | 10.45 | 1088 | 1043 | 211.3 |
| B | 2 | 8 | 2711 | 7.89 | 1088 | 1043 | 211.3 |
| B | 3 | 80 | 2701 | 7.85 | 1088 | 1043 | 211.3 |
| C | 1 | 81 | 3176 | 7.74 | 1098 | 1029 | 277.4 |
| C | 1 | 80 | 3101 | 7.47 | 1098 | 1029 | 277.4 |
| C | 3 | 187 | 2823 | 6.47 | 1098 | 1029 | 277.4 |
| D | 15 | 46 | 2733 | 6.62 | 1027 | 938 | 271.2 |
| D | 6 | 67 | 2563 | 5.99 | 1027 | 938 | 271.2 |
| D | 10 | 189 | 2544 | 5.92 | 1027 | 938 | 271.2 |
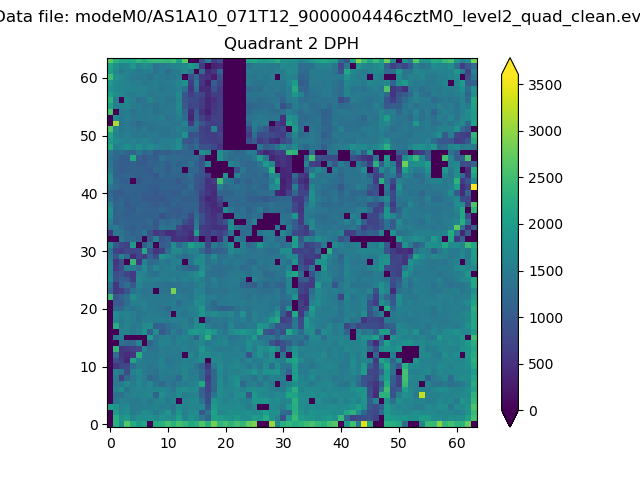
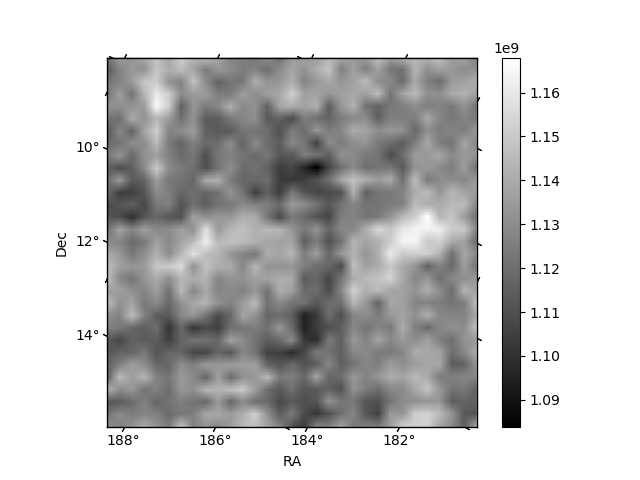
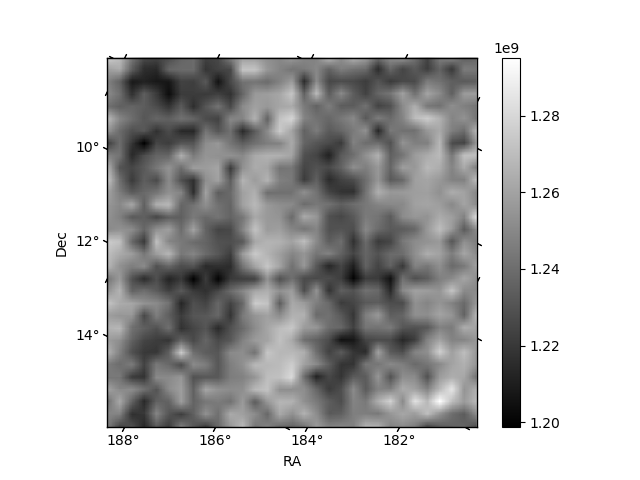
Histogram calculated using DETX and DETY for each event in the final _common_clean file
| Quadrant A | 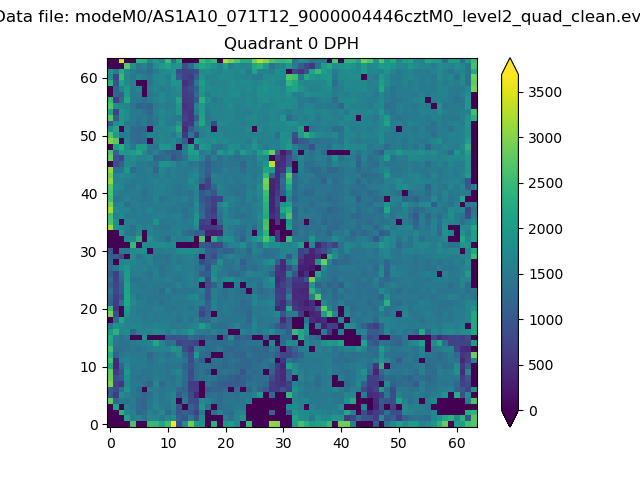 |
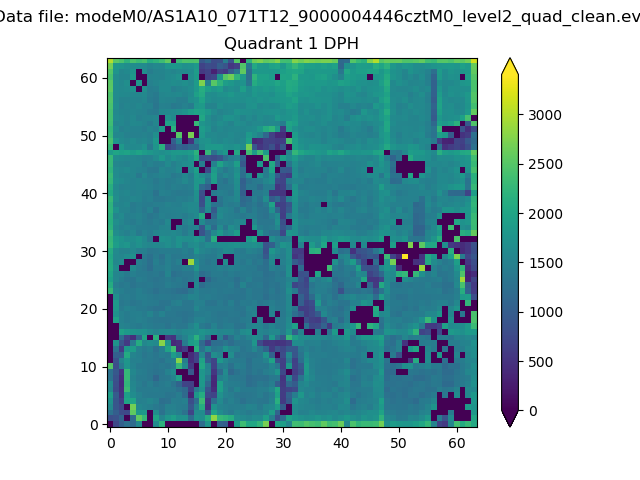 |
Quadrant B |
|---|---|---|---|
| Quadrant D | 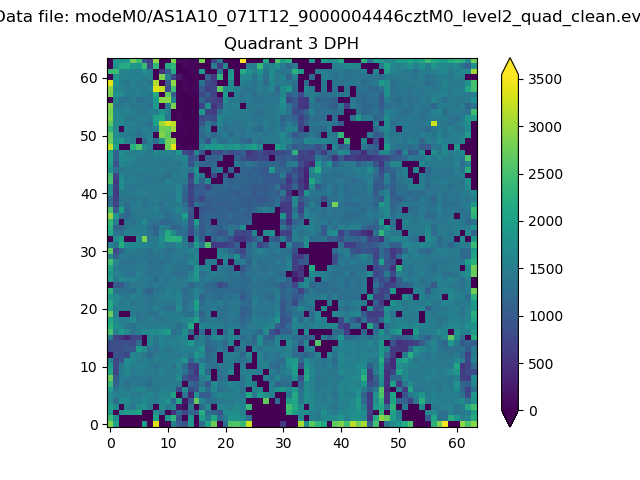 |
 |
Quadrant C |
| Plot type | Count rate plots | Images |
|---|---|---|
| Comparison with Poisson distribution Blue bars denote a histogram of data divided into 1 sec bins. Red curve is a Poisson curve with rate = median count rate of data. |
 |
 |
| Quadrant-wise count rates Data is divided into 100 sec bins |
 |
|
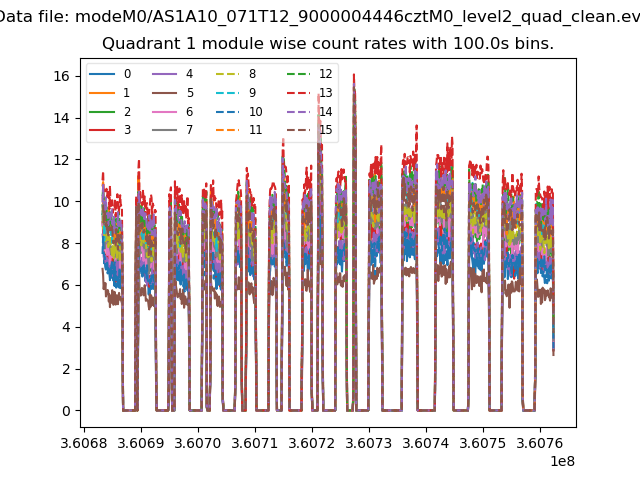
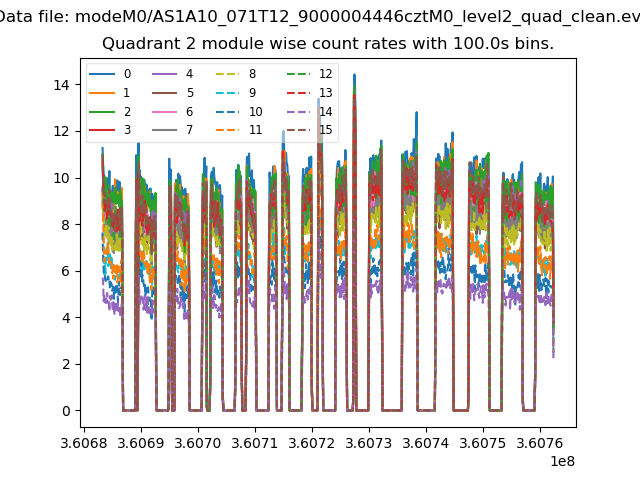
| Module-wise count rates for Quadrant A Data is divided into 100 sec bins |
 |
 |
| Module-wise count rates for Quadrant B Data is divided into 100 sec bins |
 |
 |
| Module-wise count rates for Quadrant C Data is divided into 100 sec bins |
 |
 |
| Module-wise count rates for Quadrant D Data is divided into 100 sec bins |
 |
 |
| Parameter | Plot |
|---|---|
| CZT HV Monitor |  |
| D_VDD |  |
| Temperature 1 | 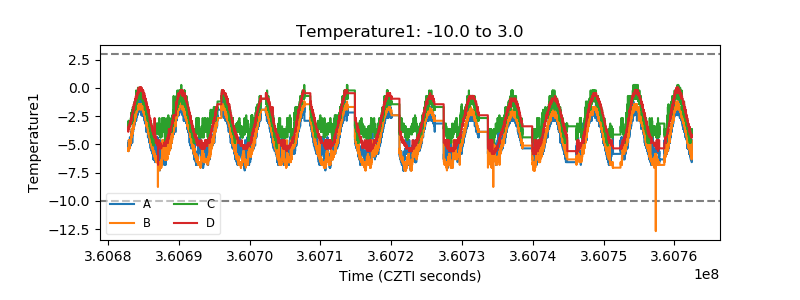 |
| Veto HV Monitor |  |
| Veto LLD | 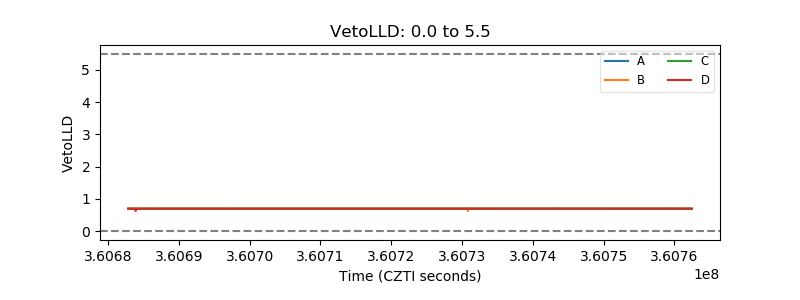 |
| Alpha Counter | 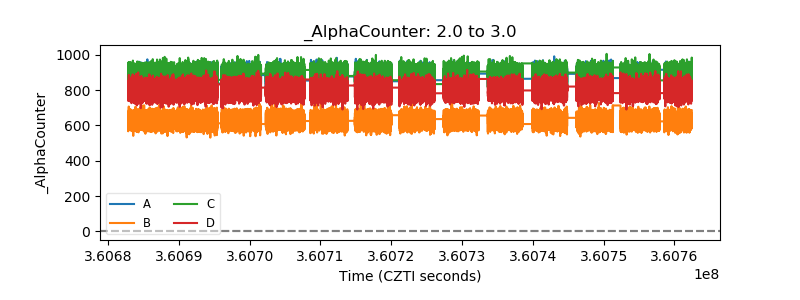 |
| _CPM_Rate |  |
| CZT Counter | 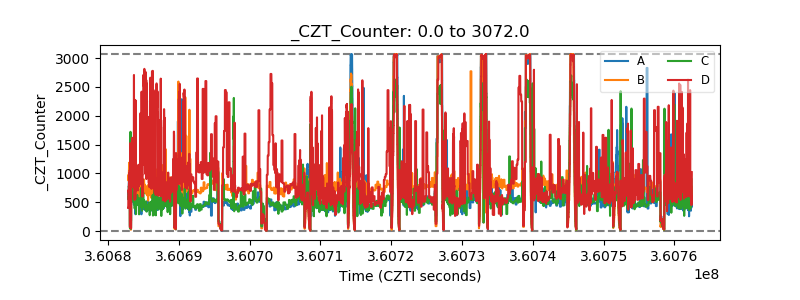 |
| +2.5 Volts monitor |  |
| +5 Volts monitor |  |
| _ROLL_ROT |  |
| _Roll_DEC |  |
| _Roll_RA |  |
| Veto Counter |  |