| Param | Original file | Final file |
|---|---|---|
| Filename | modeM0/AS1A10_071T12_9000004446_30765cztM0_level2.evt | modeM0/AS1A10_071T12_9000004446_30765cztM0_level2_quad_clean.evt |
| Size (bytes) | 805,835,520 | 104,618,880 |
| Size | 768.5 MB | 99.8 MB |
| Events in quadrant A | 4,023,723 | 693,457 |
| Events in quadrant B | 6,043,941 | 688,254 |
| Events in quadrant C | 3,940,438 | 666,715 |
| Events in quadrant D | 9,882,561 | 588,777 |
| Mode SS | |||
|---|---|---|---|
| Quadrant | BADHDUFLAG | Total packets | Discarded packets |
| A | 0 | 154 | 0 |
| B | 0 | 154 | 0 |
| C | 0 | 154 | 0 |
| D | 0 | 154 | 0 |
| Mode M9 | |||
|---|---|---|---|
| Quadrant | BADHDUFLAG | Total packets | Discarded packets |
| A | 0 | 3 | 0 |
| B | 0 | 3 | 0 |
| C | 0 | 3 | 0 |
| D | 0 | 3 | 0 |
| Mode M0 | |||
|---|---|---|---|
| Quadrant | BADHDUFLAG | Total packets | Discarded packets |
| A | 0 | 16932 | 1 |
| B | 0 | 23691 | 1 |
| C | 0 | 16320 | 1 |
| D | 0 | 34672 | 1 |
| Quadrant | Total seconds | Saturated seconds | Saturation percentage |
|---|---|---|---|
| A | 7625 | 209 | 2.740984% |
| B | 7625 | 290 | 3.803279% |
| C | 7625 | 215 | 2.819672% |
| D | 7626 | 1498 | 19.643325% |
Noise dominated data is calculated using 1-second bins in cleaned event files. If a bin has >2000 counts, and if more than 50% of those come from <1% of pixels, then it is considered to be noise-dominated and hence unusable.
| Quadrant | # 1 sec bins | Bins with >0 counts | Bins with >2000 counts | High rate bins dominated by noise | Noise dominated (total time) | Noise dominated (detector-on time) | Marked lightcurve |
|---|---|---|---|---|---|---|---|
| A | 7870 | 7625 | 29 | 29 | 0.37% | 0.38% | 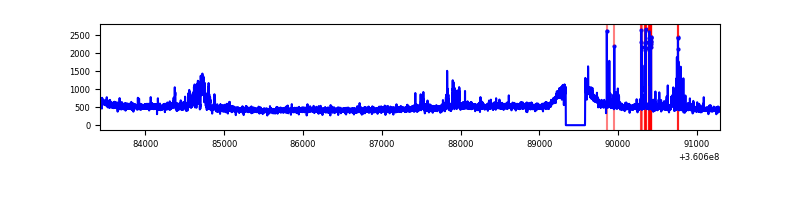 |
| B | 7870 | 7625 | 31 | 31 | 0.39% | 0.41% | 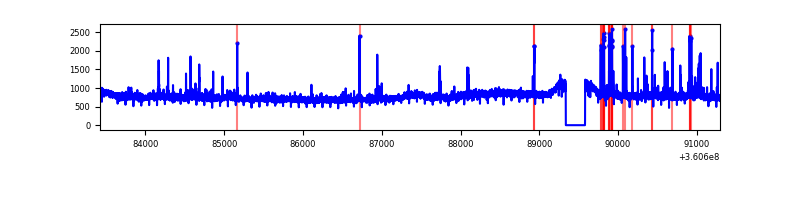 |
| C | 7870 | 7625 | 0 | 0 | 0.00% | 0.00% | 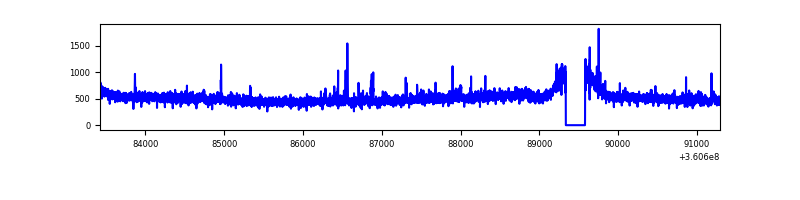 |
| D | 7871 | 7626 | 1723 | 1723 | 21.89% | 22.59% | 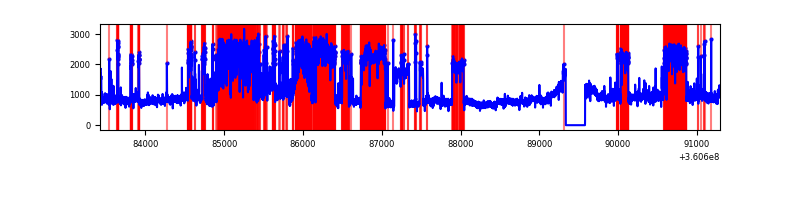 |
Top three noisy pixels from each quadrant. If the there are fewer than three noisy pixels in the level2.evt file, extra rows are filled as -1
| Pixel properties | Quadrant properties | ||||||
|---|---|---|---|---|---|---|---|
| Quadrant | DetID | PixID | Counts | Sigma | Mean | Median | Sigma |
| A | 0 | 13 | 312850 | 1593.78 | 962 | 940 | 195.7 |
| A | 13 | 254 | 13156 | 62.42 | 962 | 940 | 195.7 |
| A | 3 | 137 | 10059 | 46.6 | 962 | 940 | 195.7 |
| B | 6 | 159 | 2065651 | 11297.94 | 942 | 917 | 182.8 |
| B | 4 | 80 | 133751 | 726.85 | 942 | 917 | 182.8 |
| B | 0 | 190 | 34253 | 182.41 | 942 | 917 | 182.8 |
| C | 14 | 238 | 145271 | 658.63 | 921 | 928 | 219.2 |
| C | 3 | 233 | 101755 | 460.07 | 921 | 928 | 219.2 |
| C | 15 | 208 | 27799 | 122.61 | 921 | 928 | 219.2 |
| D | 8 | 195 | 4568805 | 20500.42 | 885 | 864 | 222.8 |
| D | 12 | 218 | 1387713 | 6224.03 | 885 | 864 | 222.8 |
| D | 13 | 249 | 233252 | 1042.93 | 885 | 864 | 222.8 |
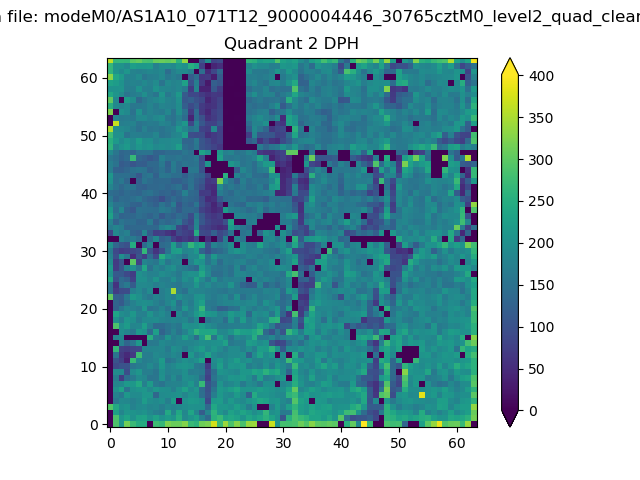
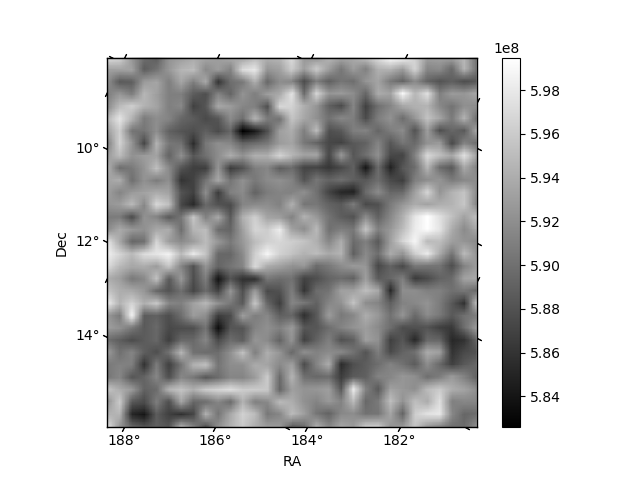
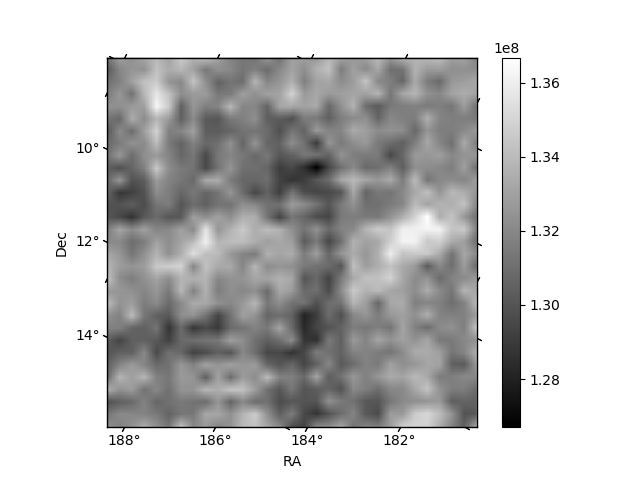
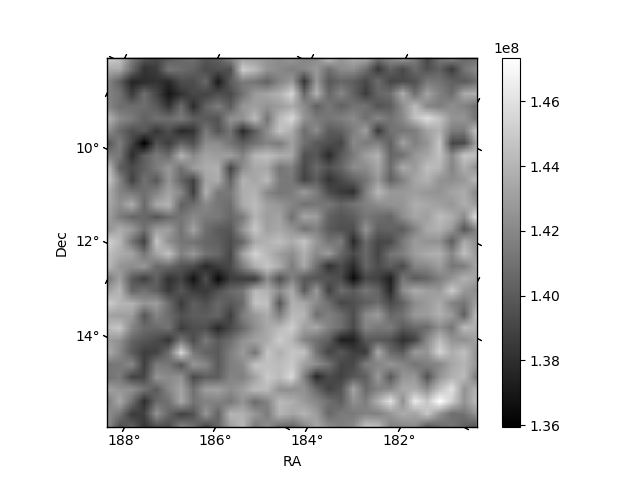
Histogram calculated using DETX and DETY for each event in the final _common_clean file
| Quadrant A | 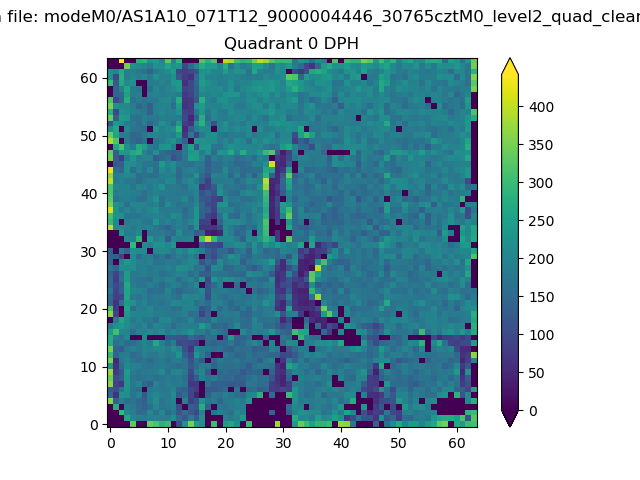 |
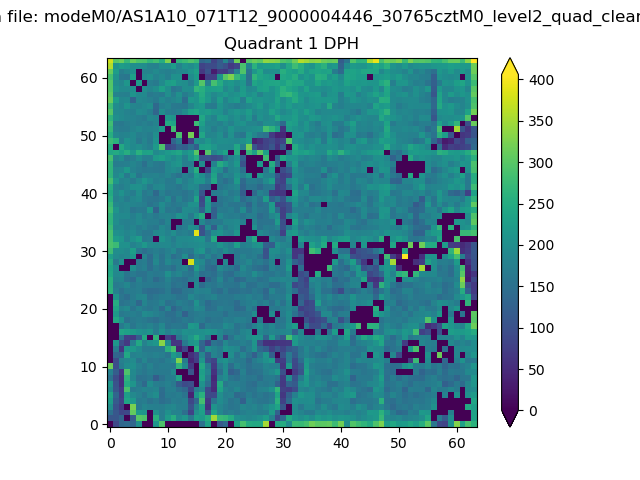 |
Quadrant B |
|---|---|---|---|
| Quadrant D | 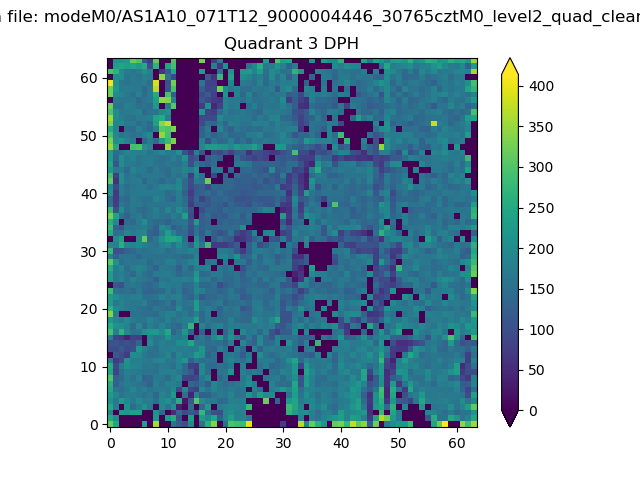 |
 |
Quadrant C |
| Plot type | Count rate plots | Images |
|---|---|---|
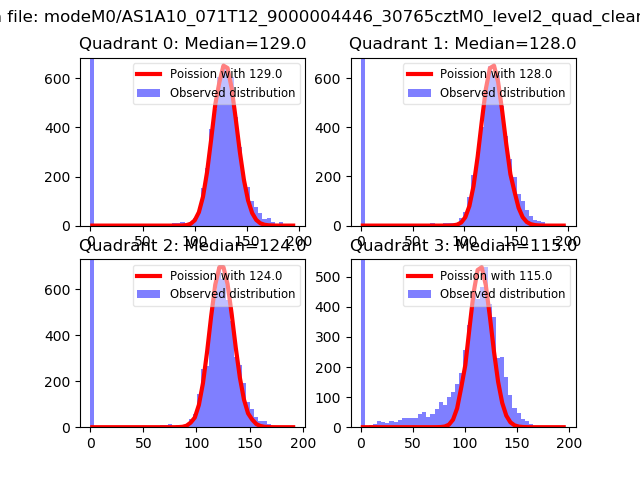
| Comparison with Poisson distribution Blue bars denote a histogram of data divided into 1 sec bins. Red curve is a Poisson curve with rate = median count rate of data. |
 |
 |
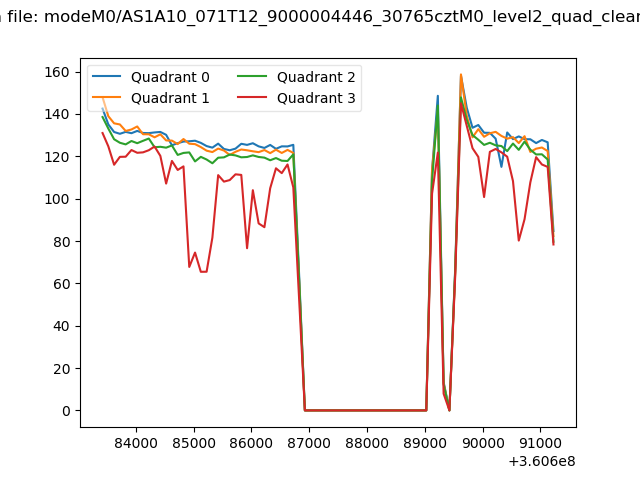
| Quadrant-wise count rates Data is divided into 100 sec bins |
 |
|
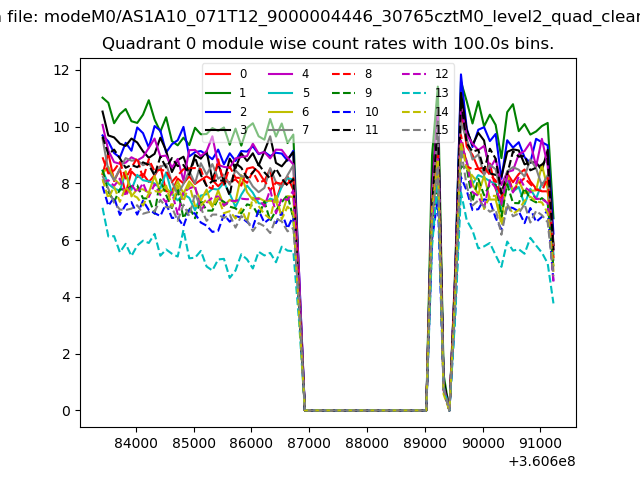
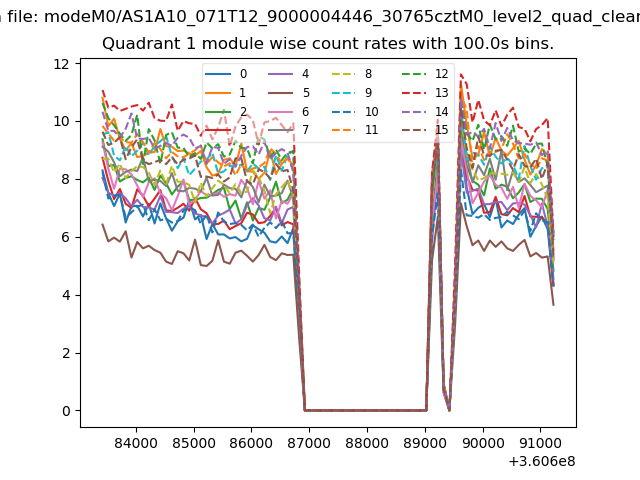
| Module-wise count rates for Quadrant A Data is divided into 100 sec bins |
 |
 |
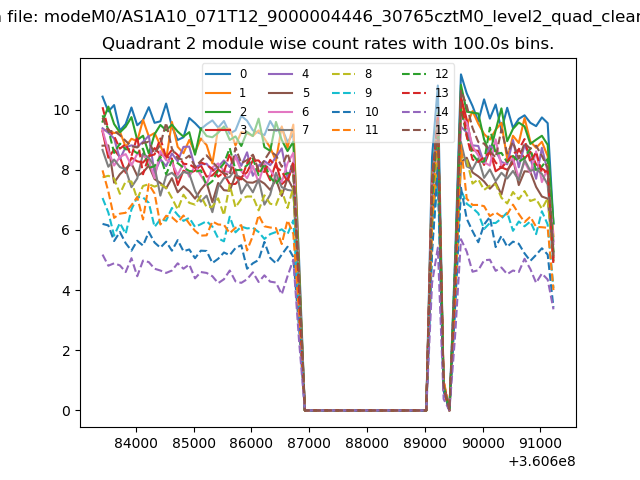
| Module-wise count rates for Quadrant B Data is divided into 100 sec bins |
 |
 |
| Module-wise count rates for Quadrant C Data is divided into 100 sec bins |
 |
 |
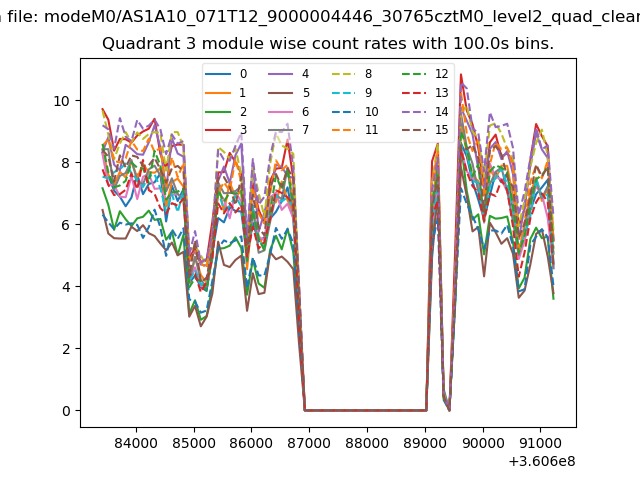
| Module-wise count rates for Quadrant D Data is divided into 100 sec bins |
 |
 |
| Parameter | Plot |
|---|---|
| CZT HV Monitor | 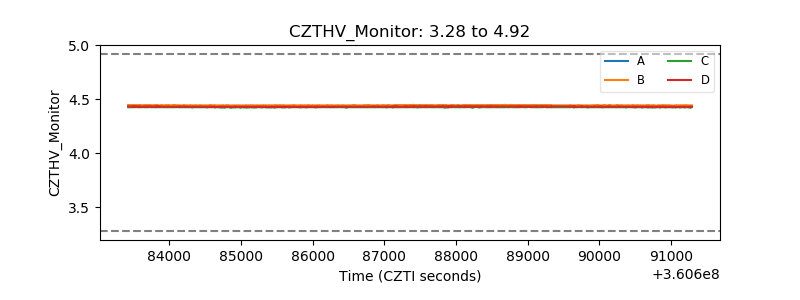 |
| D_VDD | 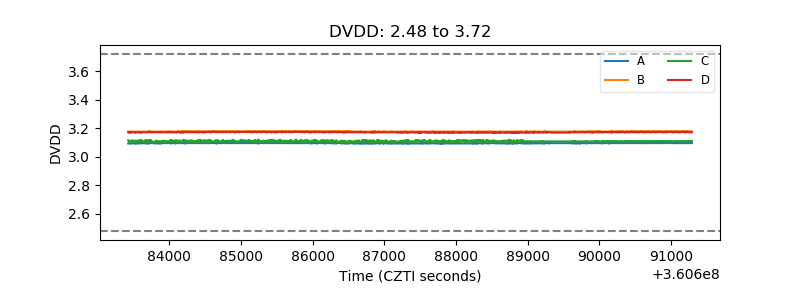 |
| Temperature 1 | 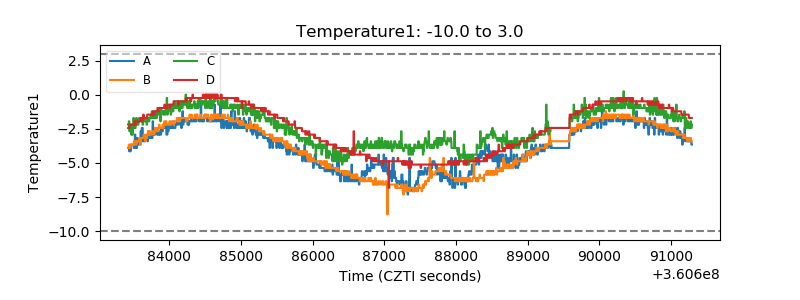 |
| Veto HV Monitor | 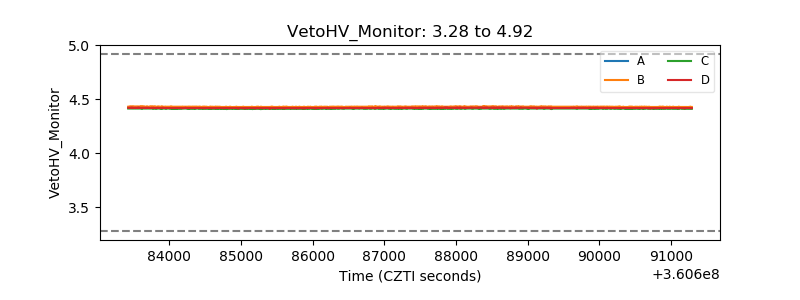 |
| Veto LLD | 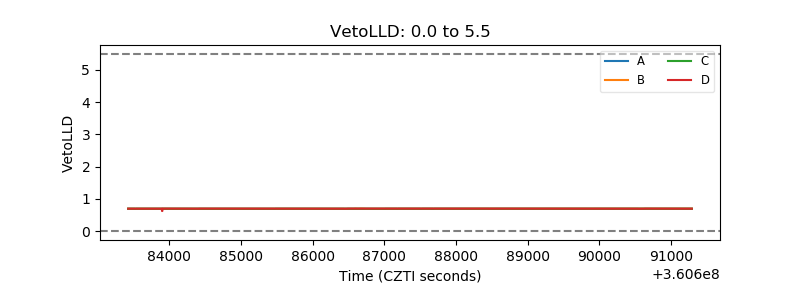 |
| Alpha Counter | 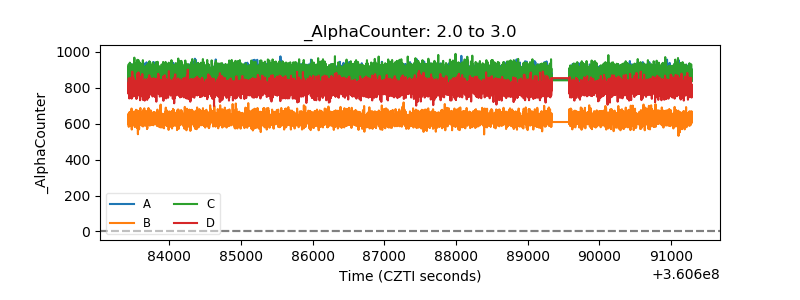 |
| _CPM_Rate | 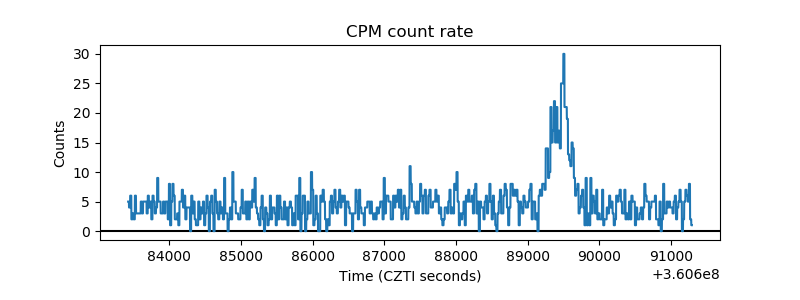 |
| CZT Counter | 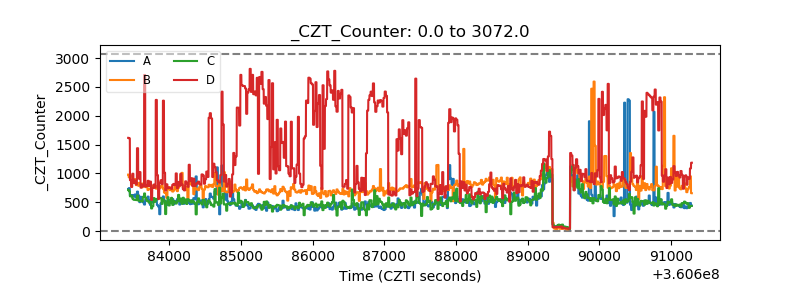 |
| +2.5 Volts monitor |  |
| +5 Volts monitor |  |
| _ROLL_ROT | 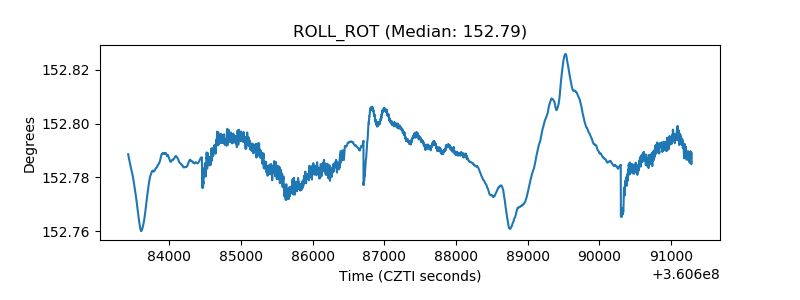 |
| _Roll_DEC | 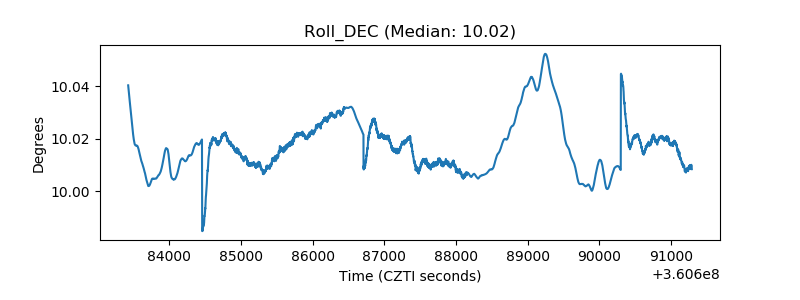 |
| _Roll_RA | 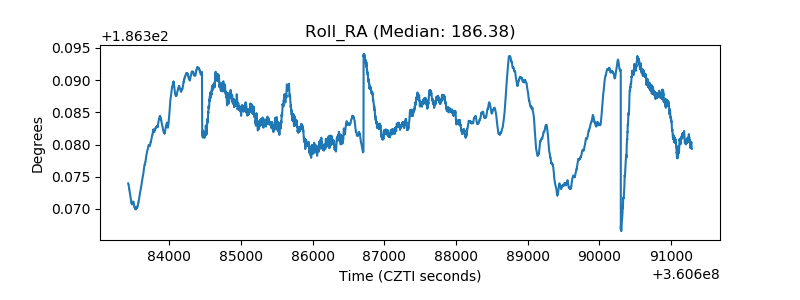 |
| Veto Counter | 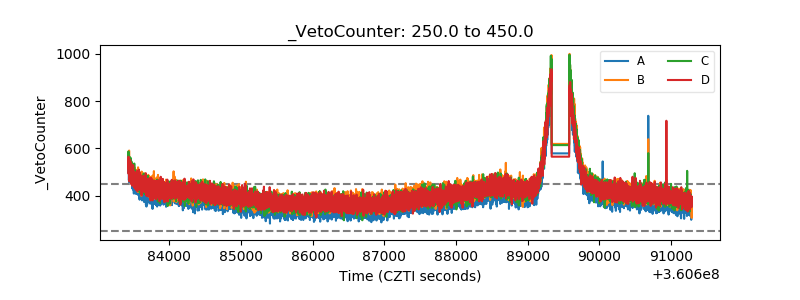 |