| Param | Original file | Final file |
|---|---|---|
| Filename | modeM0/AS1A10_071T12_9000004446_30768cztM0_level2.evt | modeM0/AS1A10_071T12_9000004446_30768cztM0_level2_quad_clean.evt |
| Size (bytes) | 1,767,381,120 | 230,215,680 |
| Size | 1.6 GB | 219.6 MB |
| Events in quadrant A | 8,775,788 | 1,483,270 |
| Events in quadrant B | 14,056,366 | 1,472,098 |
| Events in quadrant C | 9,508,466 | 1,423,098 |
| Events in quadrant D | 19,957,138 | 1,334,725 |
| Mode SS | |||
|---|---|---|---|
| Quadrant | BADHDUFLAG | Total packets | Discarded packets |
| A | 0 | 372 | 0 |
| B | 0 | 372 | 0 |
| C | 0 | 372 | 0 |
| D | 0 | 372 | 0 |
| Mode M9 | |||
|---|---|---|---|
| Quadrant | BADHDUFLAG | Total packets | Discarded packets |
| A | 0 | 21 | 0 |
| B | 0 | 21 | 0 |
| C | 0 | 21 | 0 |
| D | 0 | 21 | 0 |
| Mode M0 | |||
|---|---|---|---|
| Quadrant | BADHDUFLAG | Total packets | Discarded packets |
| A | 0 | 38154 | 3 |
| B | 0 | 55552 | 3 |
| C | 0 | 39839 | 3 |
| D | 0 | 72437 | 3 |
| Quadrant | Total seconds | Saturated seconds | Saturation percentage |
|---|---|---|---|
| A | 18261 | 133 | 0.728328% |
| B | 18262 | 266 | 1.456576% |
| C | 18262 | 359 | 1.965831% |
| D | 18262 | 2025 | 11.088599% |
Noise dominated data is calculated using 1-second bins in cleaned event files. If a bin has >2000 counts, and if more than 50% of those come from <1% of pixels, then it is considered to be noise-dominated and hence unusable.
| Quadrant | # 1 sec bins | Bins with >0 counts | Bins with >2000 counts | High rate bins dominated by noise | Noise dominated (total time) | Noise dominated (detector-on time) | Marked lightcurve |
|---|---|---|---|---|---|---|---|
| A | 20326 | 18262 | 33 | 33 | 0.16% | 0.18% | 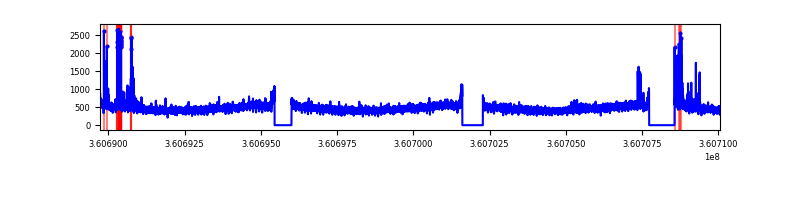 |
| B | 20327 | 18262 | 47 | 47 | 0.23% | 0.26% | 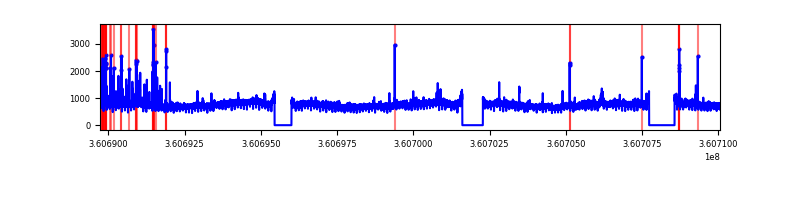 |
| C | 20327 | 18262 | 73 | 73 | 0.36% | 0.40% | 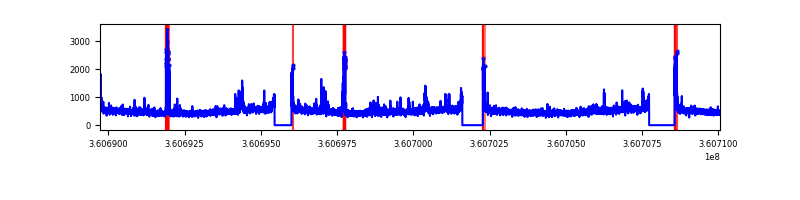 |
| D | 20327 | 18262 | 1864 | 1864 | 9.17% | 10.21% | 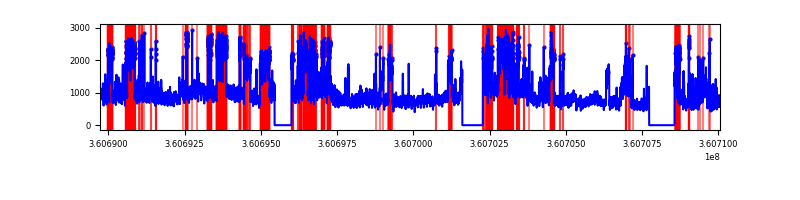 |
Top three noisy pixels from each quadrant. If the there are fewer than three noisy pixels in the level2.evt file, extra rows are filled as -1
| Pixel properties | Quadrant properties | ||||||
|---|---|---|---|---|---|---|---|
| Quadrant | DetID | PixID | Counts | Sigma | Mean | Median | Sigma |
| A | 0 | 13 | 230930 | 515.84 | 2213 | 2166 | 443.5 |
| A | 13 | 254 | 34876 | 73.76 | 2213 | 2166 | 443.5 |
| A | 3 | 137 | 22911 | 46.78 | 2213 | 2166 | 443.5 |
| B | 6 | 159 | 5099722 | 12287.14 | 2180 | 2121 | 414.9 |
| B | 4 | 80 | 177152 | 421.89 | 2180 | 2121 | 414.9 |
| B | 0 | 230 | 53148 | 122.99 | 2180 | 2121 | 414.9 |
| C | 3 | 233 | 592638 | 1191.72 | 2117 | 2133 | 495.5 |
| C | 14 | 238 | 339039 | 679.92 | 2117 | 2133 | 495.5 |
| C | 0 | 10 | 160863 | 320.34 | 2117 | 2133 | 495.5 |
| D | 8 | 195 | 10308359 | 18692.47 | 2073 | 2036 | 551.4 |
| D | 13 | 249 | 686881 | 1242.1 | 2073 | 2036 | 551.4 |
| D | 12 | 227 | 608642 | 1100.2 | 2073 | 2036 | 551.4 |
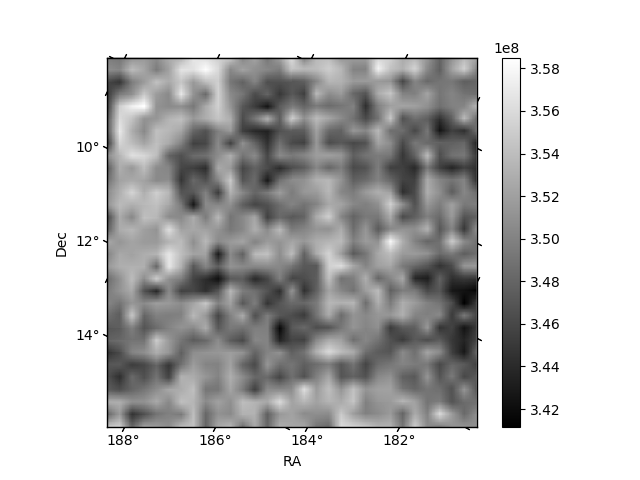
Histogram calculated using DETX and DETY for each event in the final _common_clean file
| Quadrant A | 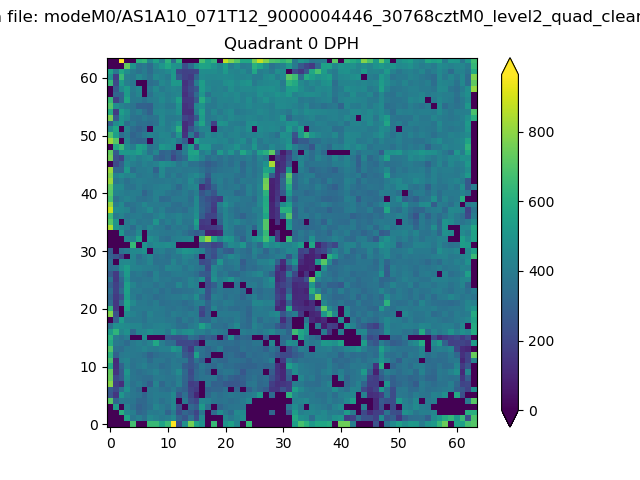 |
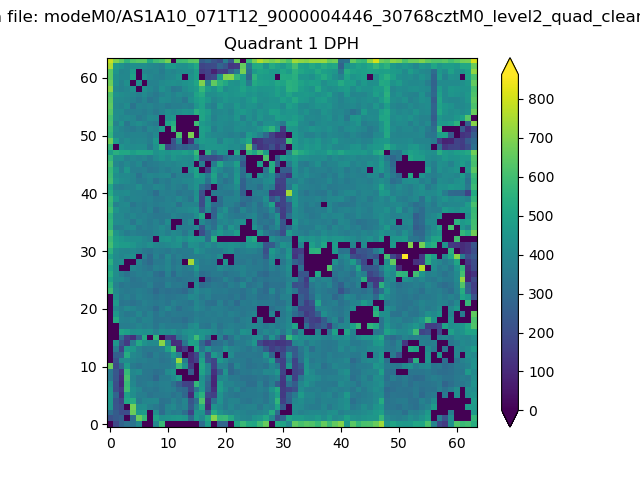 |
Quadrant B |
|---|---|---|---|
| Quadrant D | 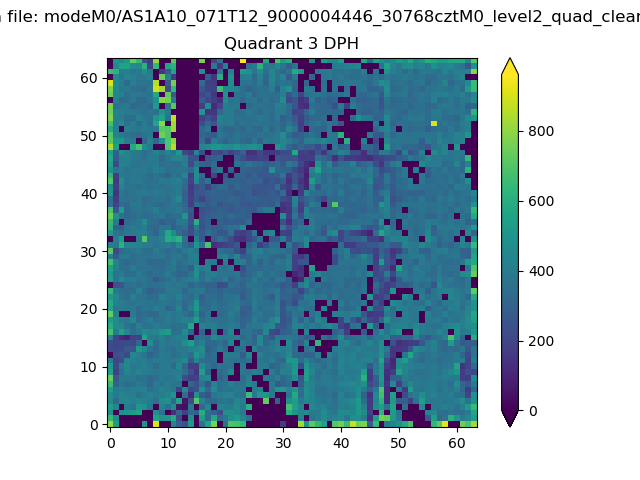 |
 |
Quadrant C |
| Plot type | Count rate plots | Images |
|---|---|---|
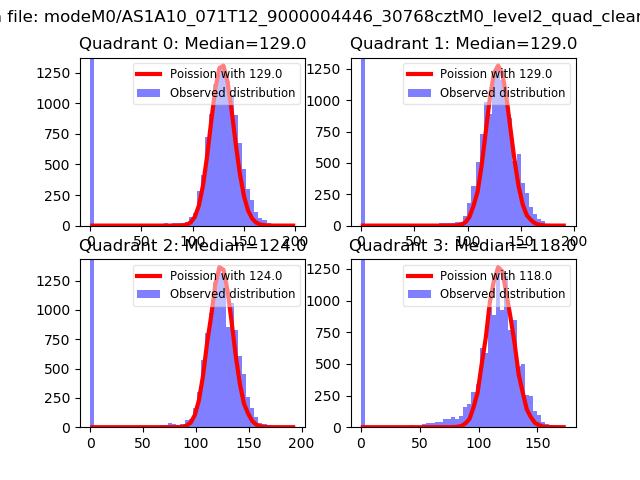
| Comparison with Poisson distribution Blue bars denote a histogram of data divided into 1 sec bins. Red curve is a Poisson curve with rate = median count rate of data. |
 |
 |
| Quadrant-wise count rates Data is divided into 100 sec bins |
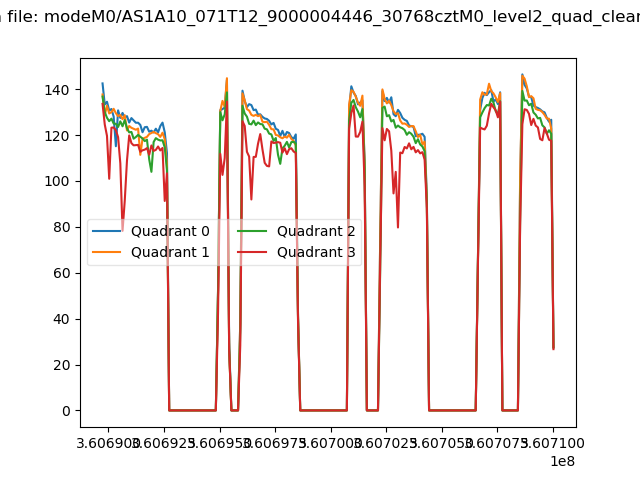 |
|
| Module-wise count rates for Quadrant A Data is divided into 100 sec bins |
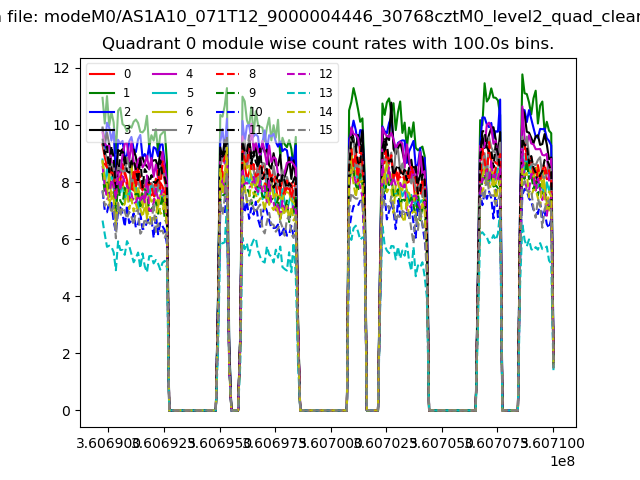 |
 |
| Module-wise count rates for Quadrant B Data is divided into 100 sec bins |
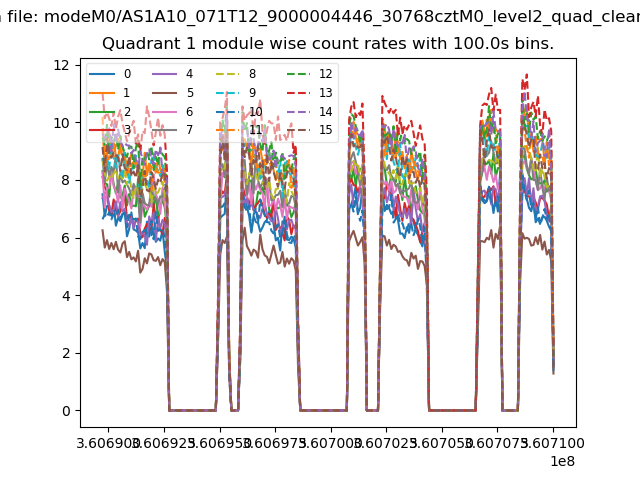 |
 |
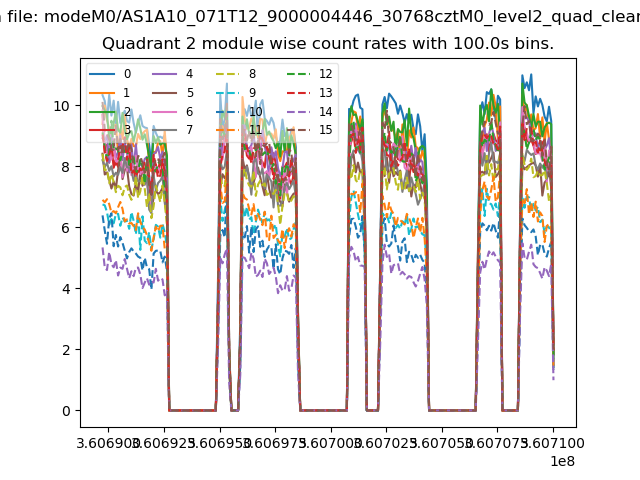
| Module-wise count rates for Quadrant C Data is divided into 100 sec bins |
 |
 |
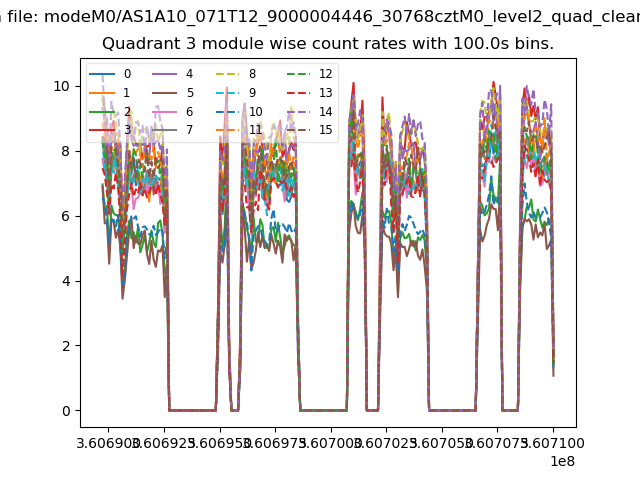
| Module-wise count rates for Quadrant D Data is divided into 100 sec bins |
 |
 |
| Parameter | Plot |
|---|---|
| CZT HV Monitor | 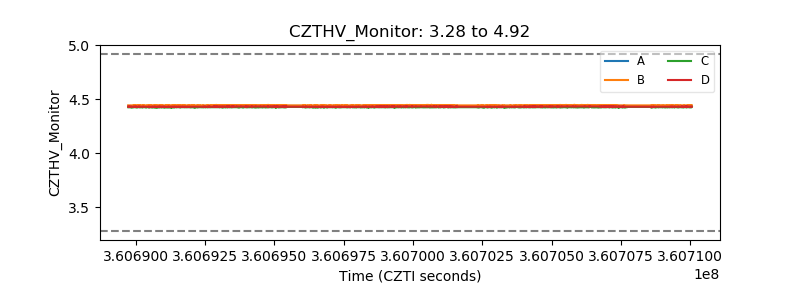 |
| D_VDD | 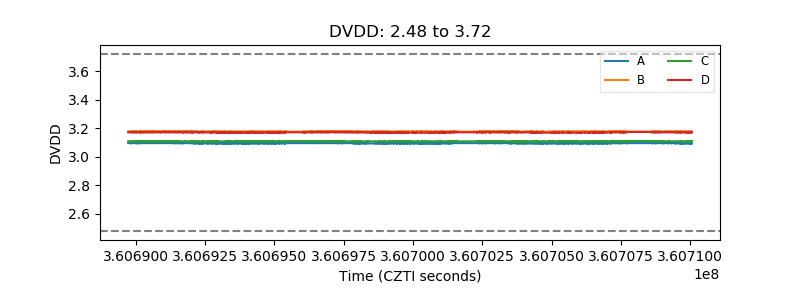 |
| Temperature 1 | 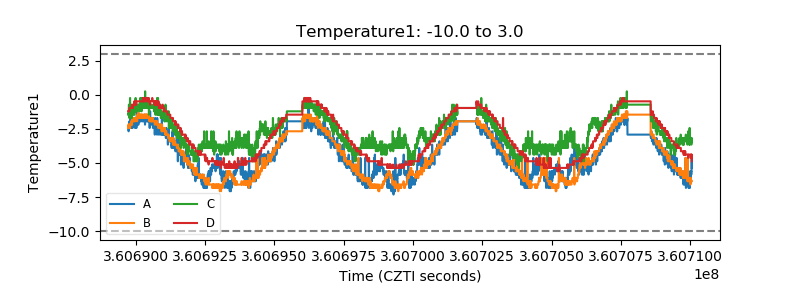 |
| Veto HV Monitor | 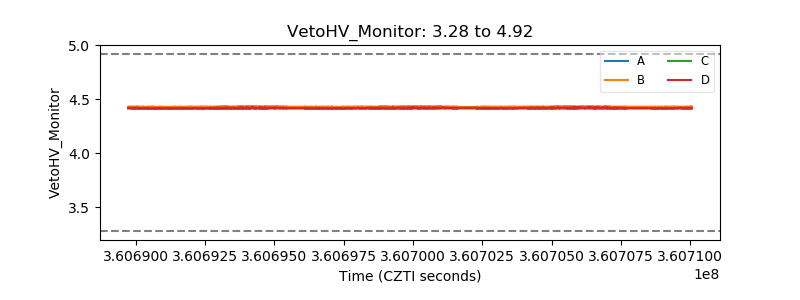 |
| Veto LLD | 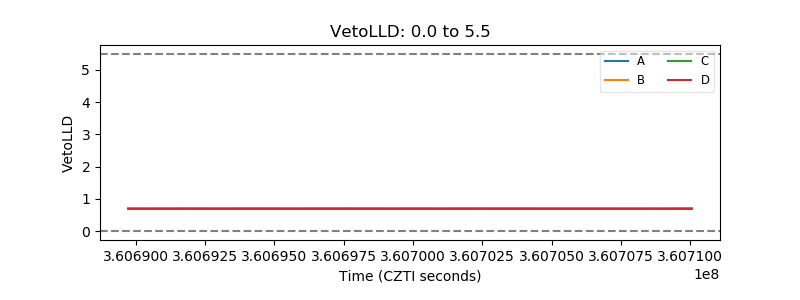 |
| Alpha Counter | 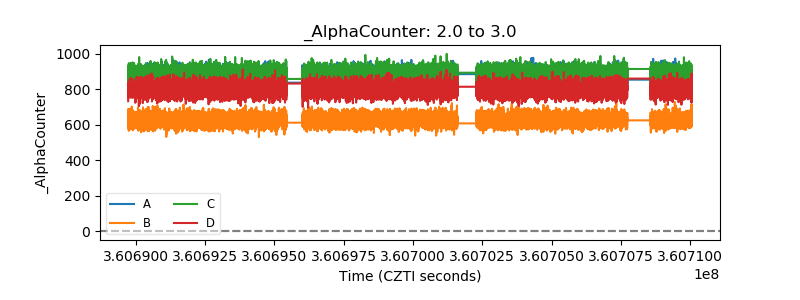 |
| _CPM_Rate | 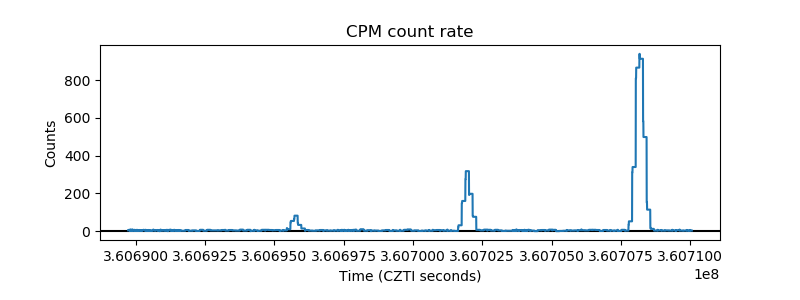 |
| CZT Counter | 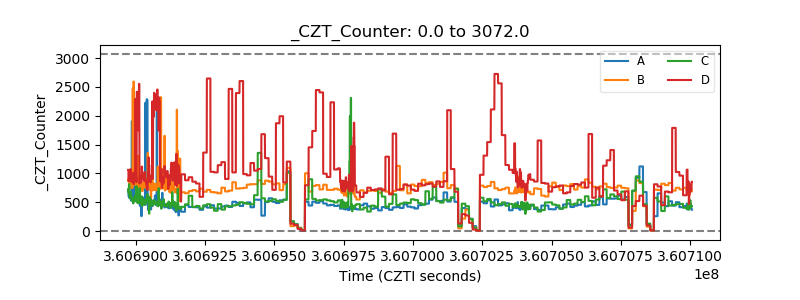 |
| +2.5 Volts monitor |  |
| +5 Volts monitor |  |
| _ROLL_ROT | 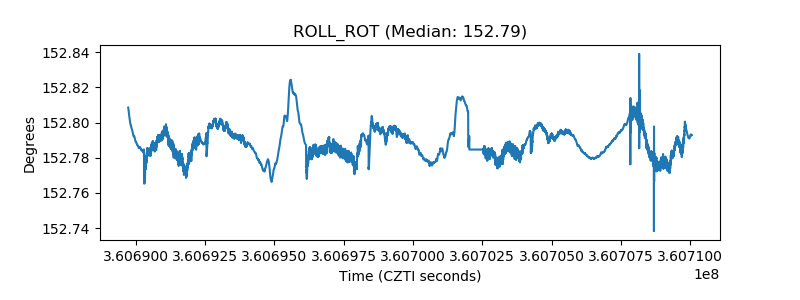 |
| _Roll_DEC | 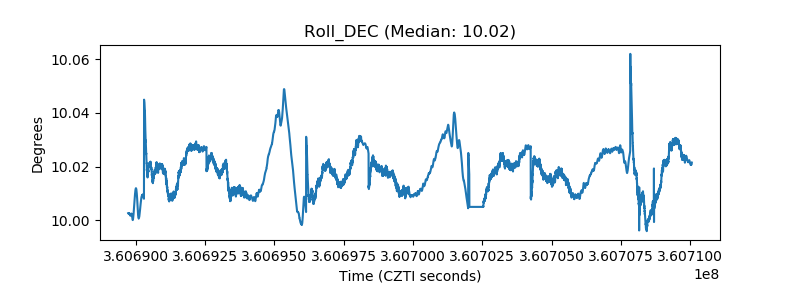 |
| _Roll_RA |  |
| Veto Counter | 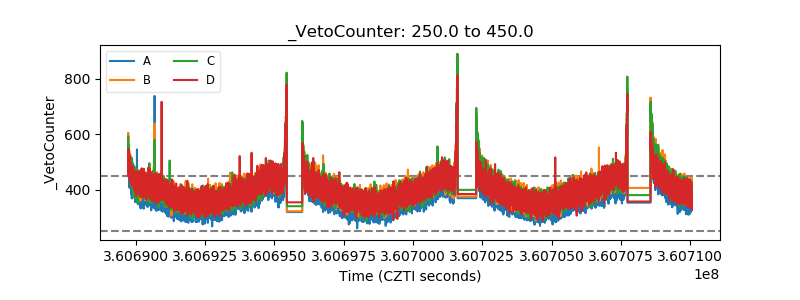 |