| Param | Original file | Final file |
|---|---|---|
| Filename | modeM0/AS1A10_071T12_9000004446_30769cztM0_level2.evt | modeM0/AS1A10_071T12_9000004446_30769cztM0_level2_quad_clean.evt |
| Size (bytes) | 609,612,480 | 91,857,600 |
| Size | 581.4 MB | 87.6 MB |
| Events in quadrant A | 3,438,280 | 594,809 |
| Events in quadrant B | 5,239,986 | 599,154 |
| Events in quadrant C | 3,466,987 | 572,634 |
| Events in quadrant D | 5,862,196 | 546,239 |
| Mode SS | |||
|---|---|---|---|
| Quadrant | BADHDUFLAG | Total packets | Discarded packets |
| A | 0 | 136 | 0 |
| B | 0 | 136 | 0 |
| C | 0 | 136 | 0 |
| D | 0 | 136 | 0 |
| Mode M9 | |||
|---|---|---|---|
| Quadrant | BADHDUFLAG | Total packets | Discarded packets |
| A | 0 | 19 | 0 |
| B | 0 | 19 | 0 |
| C | 0 | 19 | 0 |
| D | 0 | 19 | 0 |
| Mode M0 | |||
|---|---|---|---|
| Quadrant | BADHDUFLAG | Total packets | Discarded packets |
| A | 0 | 14595 | 2 |
| B | 0 | 20439 | 2 |
| C | 0 | 14412 | 2 |
| D | 0 | 22088 | 2 |
| Quadrant | Total seconds | Saturated seconds | Saturation percentage |
|---|---|---|---|
| A | 6734 | 72 | 1.069201% |
| B | 6735 | 92 | 1.365999% |
| C | 6735 | 117 | 1.737194% |
| D | 6735 | 336 | 4.988864% |
Noise dominated data is calculated using 1-second bins in cleaned event files. If a bin has >2000 counts, and if more than 50% of those come from <1% of pixels, then it is considered to be noise-dominated and hence unusable.
| Quadrant | # 1 sec bins | Bins with >0 counts | Bins with >2000 counts | High rate bins dominated by noise | Noise dominated (total time) | Noise dominated (detector-on time) | Marked lightcurve |
|---|---|---|---|---|---|---|---|
| A | 8564 | 6735 | 17 | 17 | 0.20% | 0.25% | 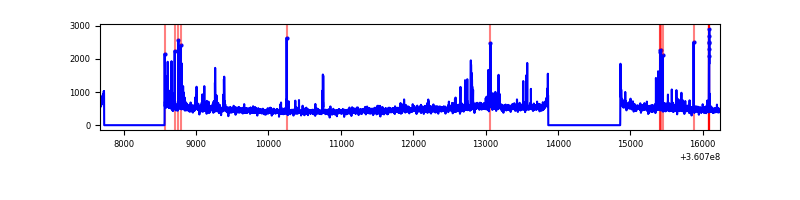 |
| B | 8565 | 6735 | 12 | 12 | 0.14% | 0.18% | 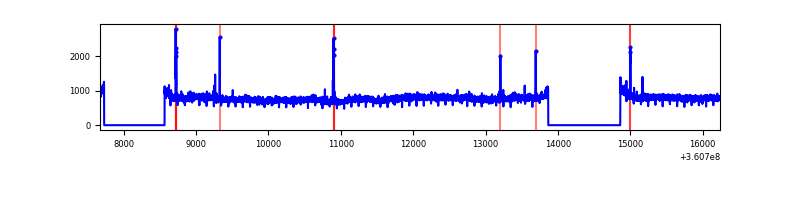 |
| C | 8565 | 6735 | 17 | 17 | 0.20% | 0.25% | 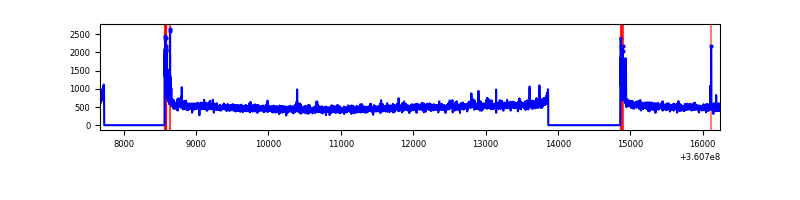 |
| D | 8565 | 6735 | 316 | 316 | 3.69% | 4.69% | 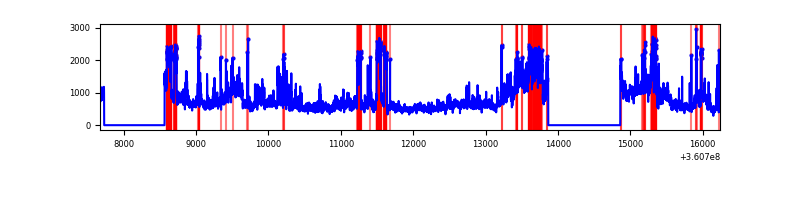 |
Top three noisy pixels from each quadrant. If the there are fewer than three noisy pixels in the level2.evt file, extra rows are filled as -1
| Pixel properties | Quadrant properties | ||||||
|---|---|---|---|---|---|---|---|
| Quadrant | DetID | PixID | Counts | Sigma | Mean | Median | Sigma |
| A | 0 | 13 | 231132 | 1370.43 | 829 | 812 | 168.1 |
| A | 13 | 254 | 12775 | 71.18 | 829 | 812 | 168.1 |
| A | 3 | 137 | 8401 | 45.16 | 829 | 812 | 168.1 |
| B | 6 | 159 | 1932335 | 12103.13 | 824 | 800 | 159.6 |
| B | 5 | 172 | 26549 | 161.34 | 824 | 800 | 159.6 |
| B | 0 | 230 | 21855 | 131.93 | 824 | 800 | 159.6 |
| C | 14 | 238 | 128817 | 685.43 | 796 | 802 | 186.8 |
| C | 0 | 10 | 118850 | 632.07 | 796 | 802 | 186.8 |
| C | 3 | 233 | 93294 | 495.23 | 796 | 802 | 186.8 |
| D | 12 | 227 | 1473290 | 7061.38 | 788 | 772 | 208.5 |
| D | 8 | 195 | 1191567 | 5710.39 | 788 | 772 | 208.5 |
| D | 13 | 249 | 69650 | 330.3 | 788 | 772 | 208.5 |
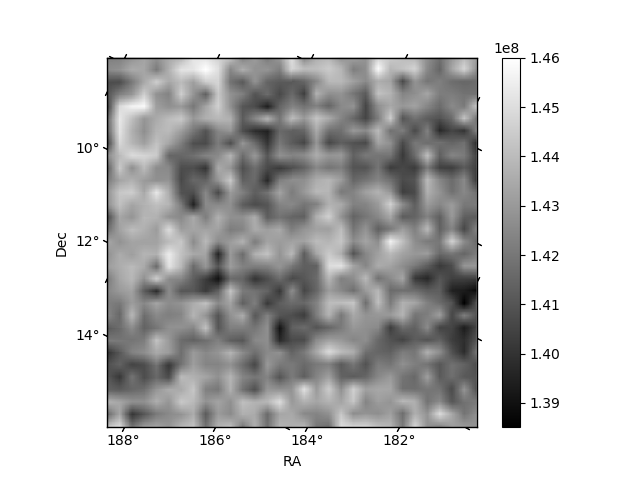
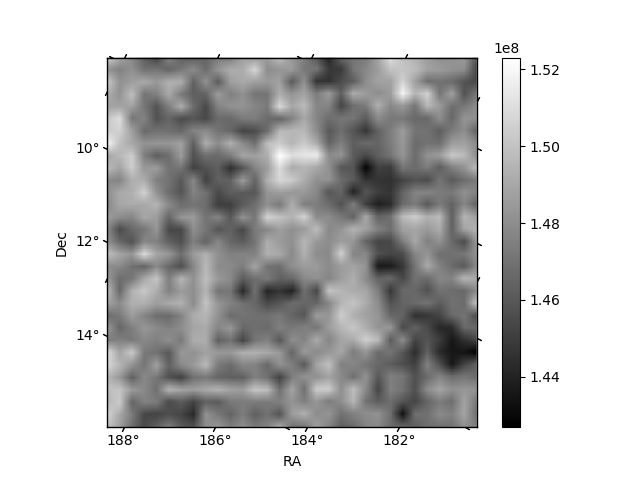
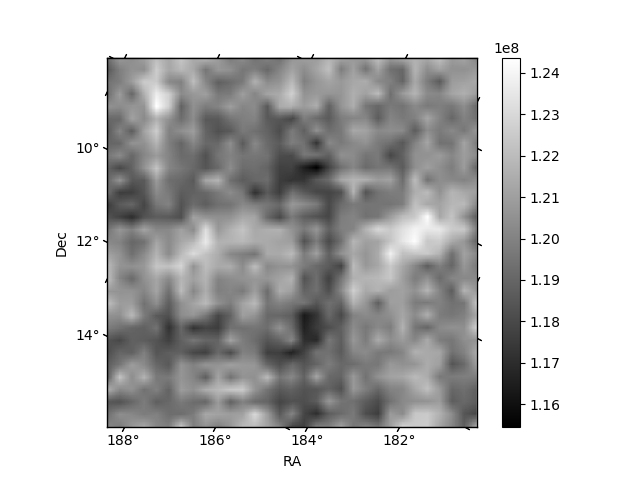
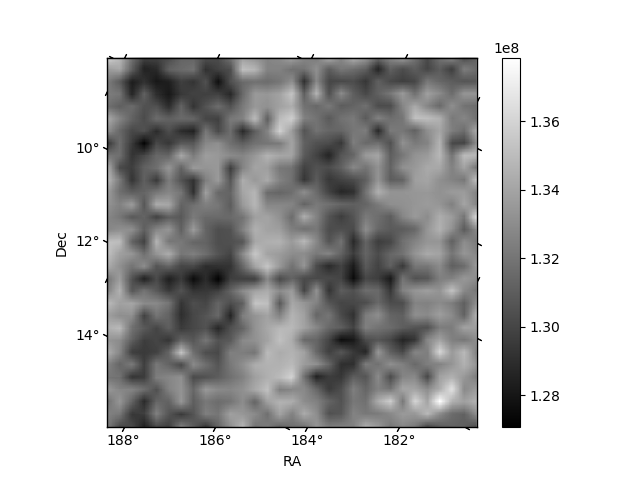
Histogram calculated using DETX and DETY for each event in the final _common_clean file
| Quadrant A |  |
 |
Quadrant B |
|---|---|---|---|
| Quadrant D | 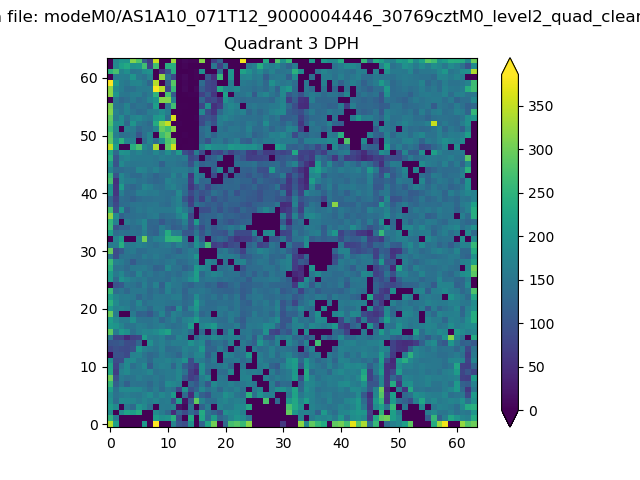 |
 |
Quadrant C |
| Plot type | Count rate plots | Images |
|---|---|---|
| Comparison with Poisson distribution Blue bars denote a histogram of data divided into 1 sec bins. Red curve is a Poisson curve with rate = median count rate of data. |
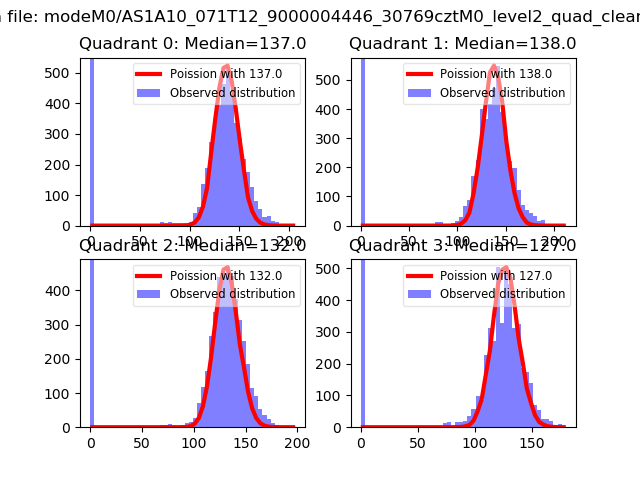 |
 |
| Quadrant-wise count rates Data is divided into 100 sec bins |
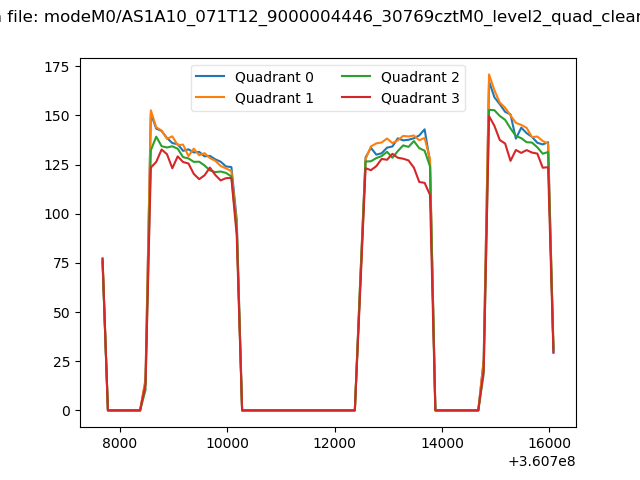 |
|
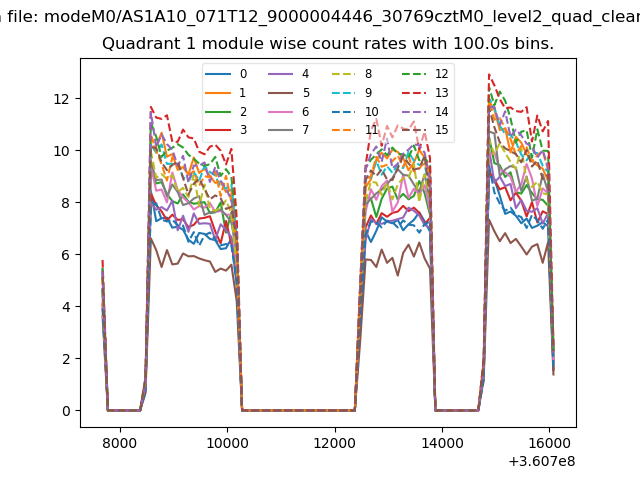
| Module-wise count rates for Quadrant A Data is divided into 100 sec bins |
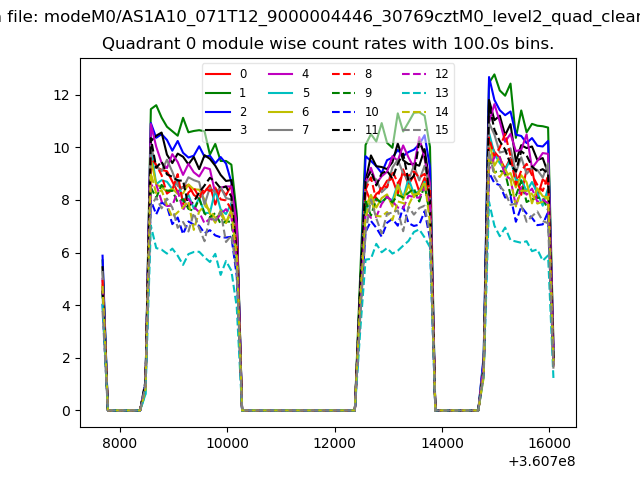 |
 |
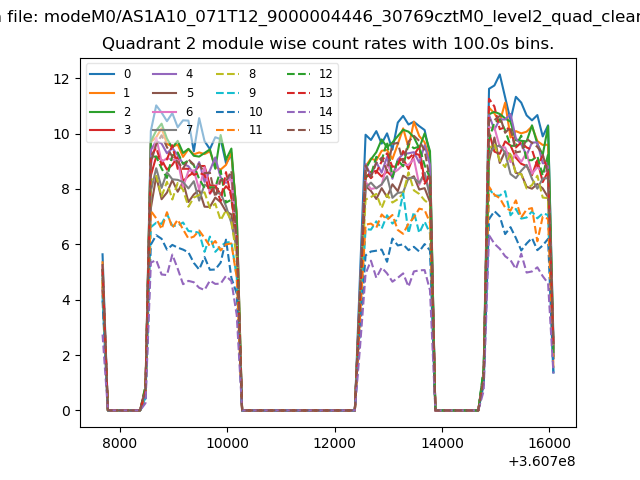
| Module-wise count rates for Quadrant B Data is divided into 100 sec bins |
 |
 |
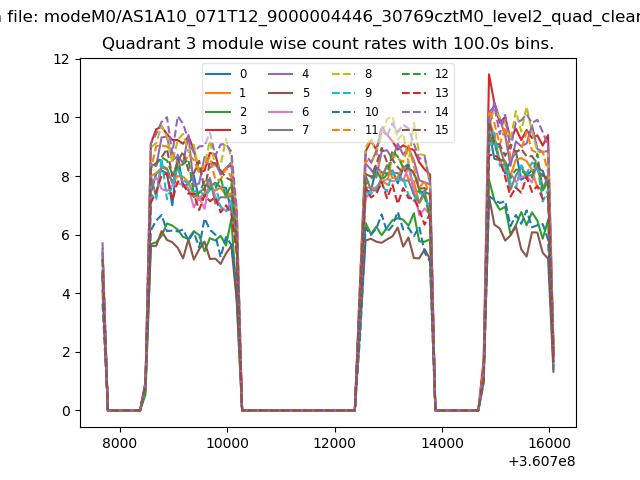
| Module-wise count rates for Quadrant C Data is divided into 100 sec bins |
 |
 |
| Module-wise count rates for Quadrant D Data is divided into 100 sec bins |
 |
 |
| Parameter | Plot |
|---|---|
| CZT HV Monitor | 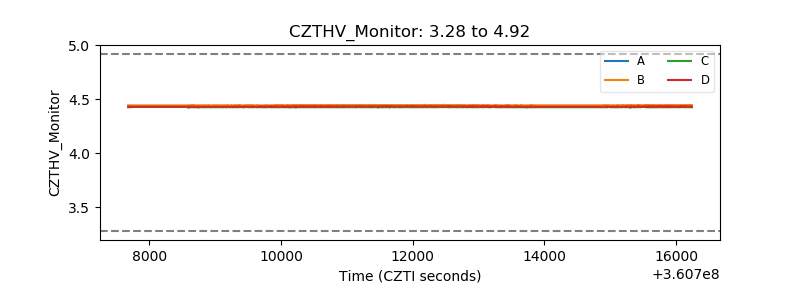 |
| D_VDD | 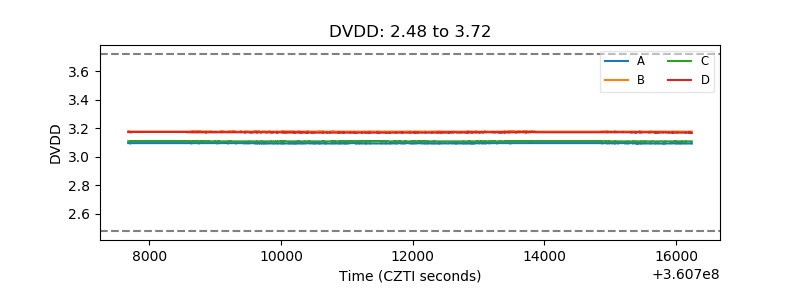 |
| Temperature 1 | 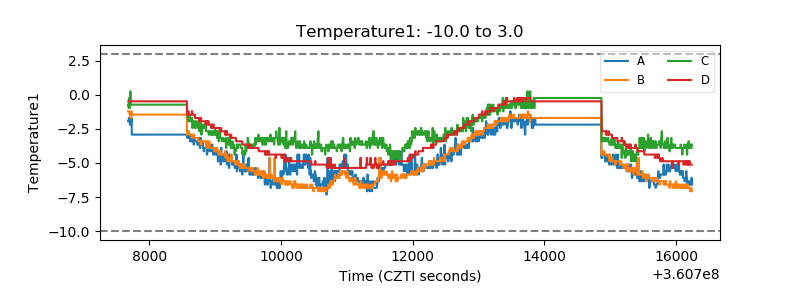 |
| Veto HV Monitor |  |
| Veto LLD | 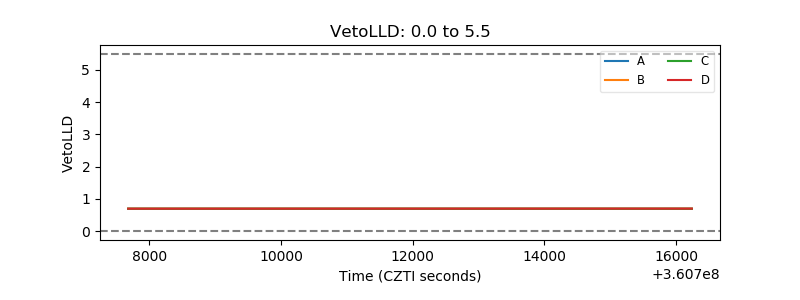 |
| Alpha Counter | 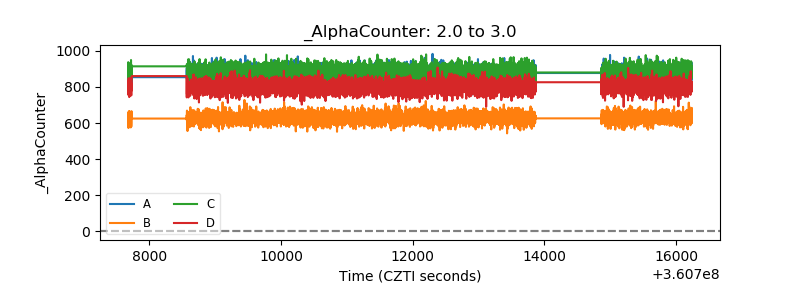 |
| _CPM_Rate | 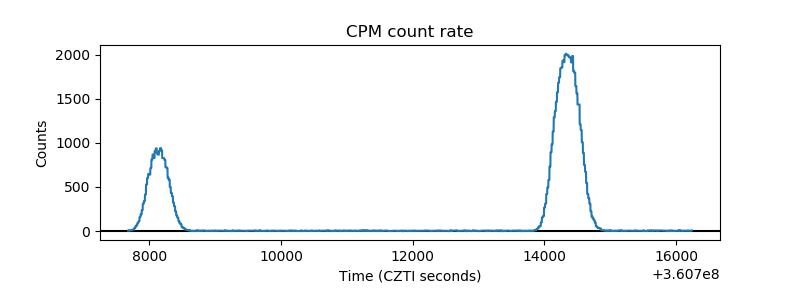 |
| CZT Counter |  |
| +2.5 Volts monitor |  |
| +5 Volts monitor | 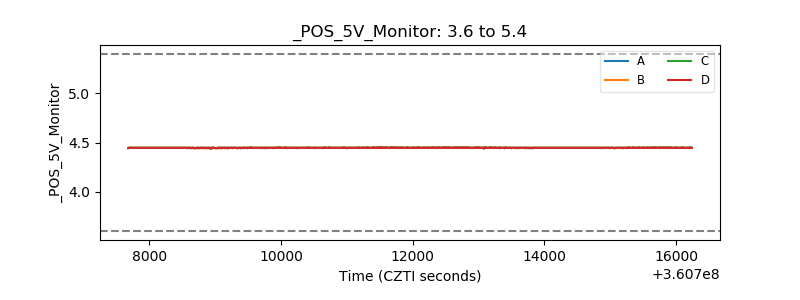 |
| _ROLL_ROT | 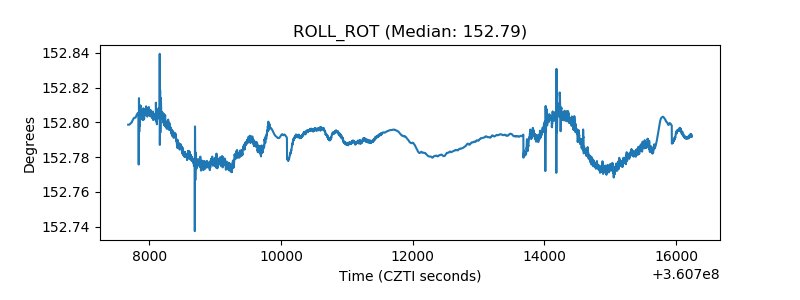 |
| _Roll_DEC | 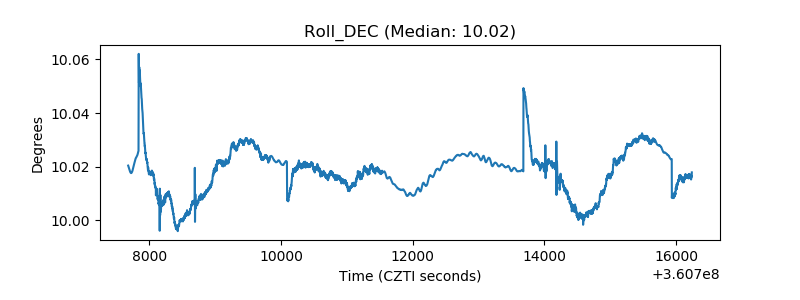 |
| _Roll_RA |  |
| Veto Counter | 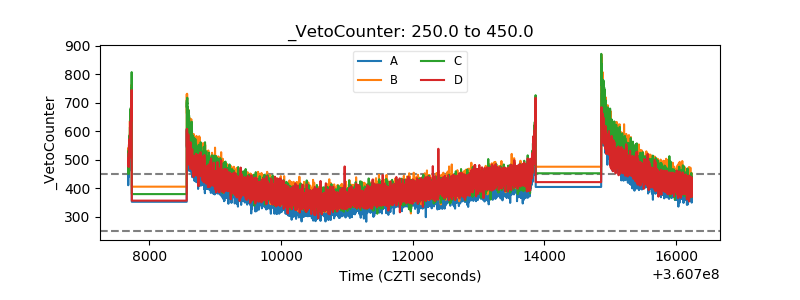 |