| Param | Original file | Final file |
|---|---|---|
| Filename | modeM0/AS1A10_071T12_9000004446_30771cztM0_level2.evt | modeM0/AS1A10_071T12_9000004446_30771cztM0_level2_quad_clean.evt |
| Size (bytes) | 580,268,160 | 84,453,120 |
| Size | 553.4 MB | 80.5 MB |
| Events in quadrant A | 3,412,542 | 543,729 |
| Events in quadrant B | 5,102,995 | 550,147 |
| Events in quadrant C | 3,373,076 | 520,042 |
| Events in quadrant D | 5,248,573 | 493,386 |
| Mode SS | |||
|---|---|---|---|
| Quadrant | BADHDUFLAG | Total packets | Discarded packets |
| A | 0 | 130 | 0 |
| B | 0 | 130 | 0 |
| C | 0 | 130 | 0 |
| D | 0 | 130 | 0 |
| Mode M9 | |||
|---|---|---|---|
| Quadrant | BADHDUFLAG | Total packets | Discarded packets |
| A | 0 | 14 | 0 |
| B | 0 | 15 | 0 |
| C | 0 | 15 | 0 |
| D | 0 | 15 | 0 |
| Mode M0 | |||
|---|---|---|---|
| Quadrant | BADHDUFLAG | Total packets | Discarded packets |
| A | 0 | 14045 | 2 |
| B | 0 | 19616 | 2 |
| C | 0 | 13856 | 2 |
| D | 0 | 20126 | 2 |
| Quadrant | Total seconds | Saturated seconds | Saturation percentage |
|---|---|---|---|
| A | 6456 | 66 | 1.022305% |
| B | 6456 | 64 | 0.991326% |
| C | 6455 | 76 | 1.177382% |
| D | 6455 | 300 | 4.647560% |
Noise dominated data is calculated using 1-second bins in cleaned event files. If a bin has >2000 counts, and if more than 50% of those come from <1% of pixels, then it is considered to be noise-dominated and hence unusable.
| Quadrant | # 1 sec bins | Bins with >0 counts | Bins with >2000 counts | High rate bins dominated by noise | Noise dominated (total time) | Noise dominated (detector-on time) | Marked lightcurve |
|---|---|---|---|---|---|---|---|
| A | 7591 | 6456 | 24 | 24 | 0.32% | 0.37% | 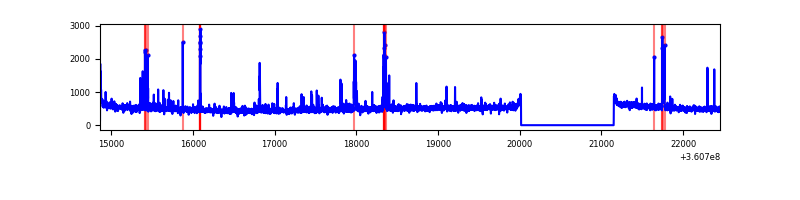 |
| B | 7591 | 6456 | 4 | 4 | 0.05% | 0.06% | 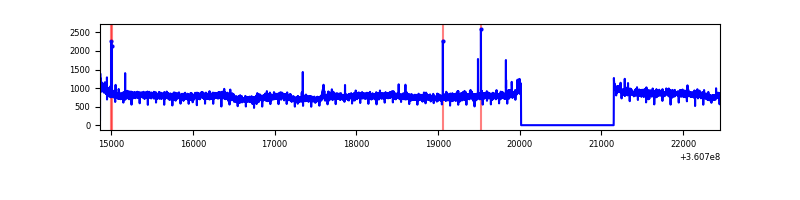 |
| C | 7590 | 6455 | 8 | 8 | 0.11% | 0.12% | 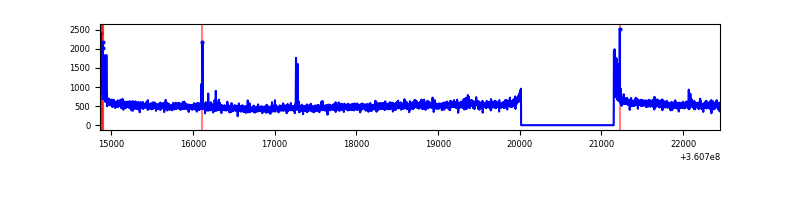 |
| D | 7590 | 6456 | 260 | 260 | 3.43% | 4.03% | 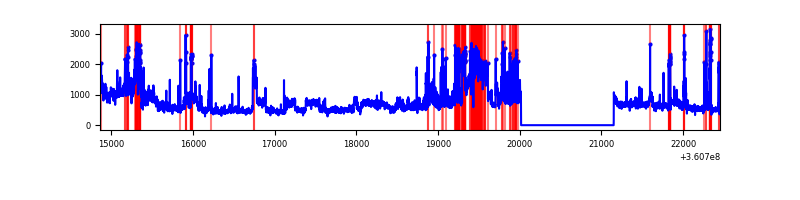 |
Top three noisy pixels from each quadrant. If the there are fewer than three noisy pixels in the level2.evt file, extra rows are filled as -1
| Pixel properties | Quadrant properties | ||||||
|---|---|---|---|---|---|---|---|
| Quadrant | DetID | PixID | Counts | Sigma | Mean | Median | Sigma |
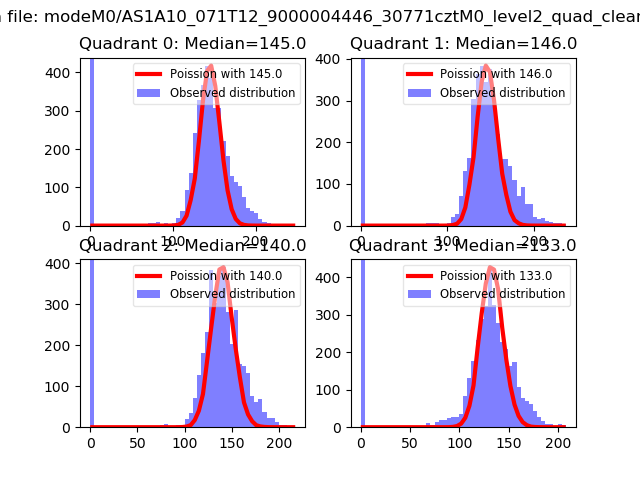
| A | 0 | 13 | 242080 | 1462.38 | 822 | 806 | 165.0 |
| A | 13 | 254 | 11909 | 67.3 | 822 | 806 | 165.0 |
| A | 3 | 137 | 8140 | 44.45 | 822 | 806 | 165.0 |
| B | 6 | 159 | 1842350 | 11879.62 | 818 | 798 | 155.0 |
| B | 12 | 111 | 19239 | 118.96 | 818 | 798 | 155.0 |
| B | 11 | 111 | 17486 | 107.65 | 818 | 798 | 155.0 |
| C | 14 | 238 | 126264 | 685.92 | 784 | 790 | 182.9 |
| C | 3 | 233 | 89011 | 482.27 | 784 | 790 | 182.9 |
| C | 0 | 10 | 80220 | 434.21 | 784 | 790 | 182.9 |
| D | 8 | 195 | 1422631 | 7099.25 | 773 | 760 | 200.3 |
| D | 12 | 227 | 544005 | 2712.36 | 773 | 760 | 200.3 |
| D | 13 | 249 | 179314 | 891.5 | 773 | 760 | 200.3 |
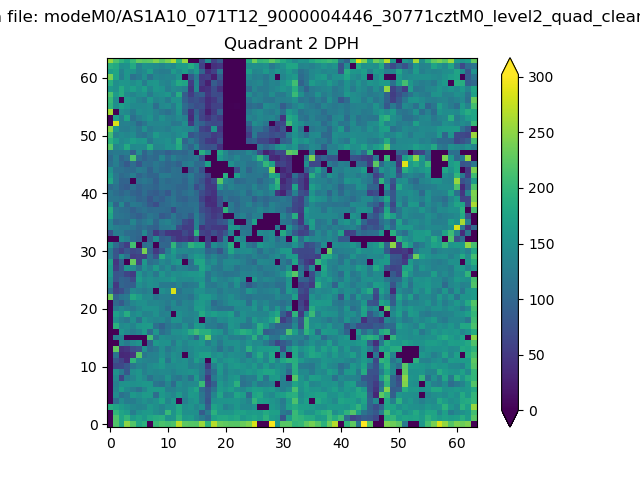
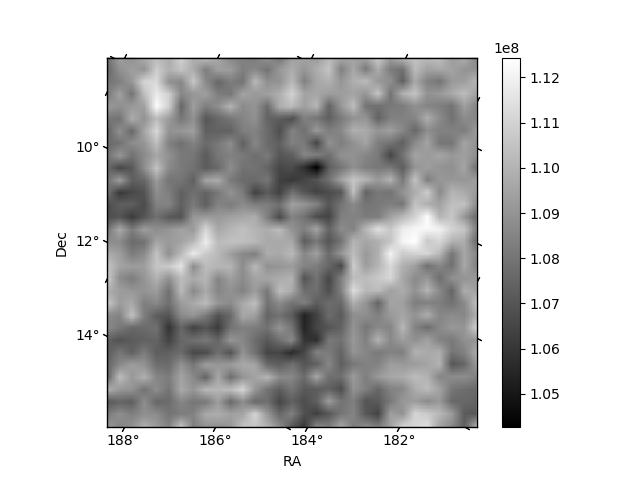
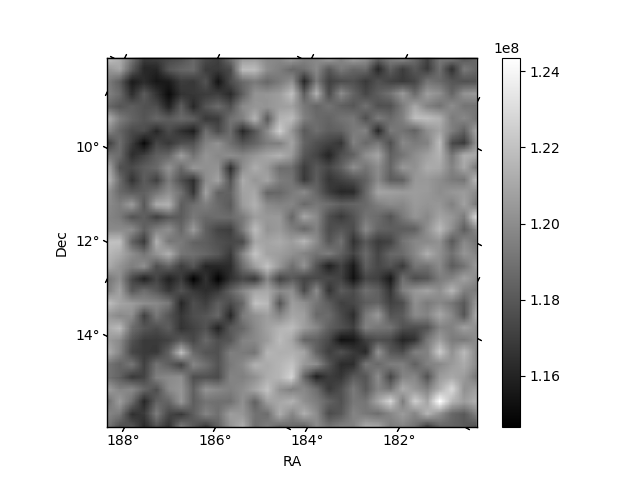
Histogram calculated using DETX and DETY for each event in the final _common_clean file
| Quadrant A | 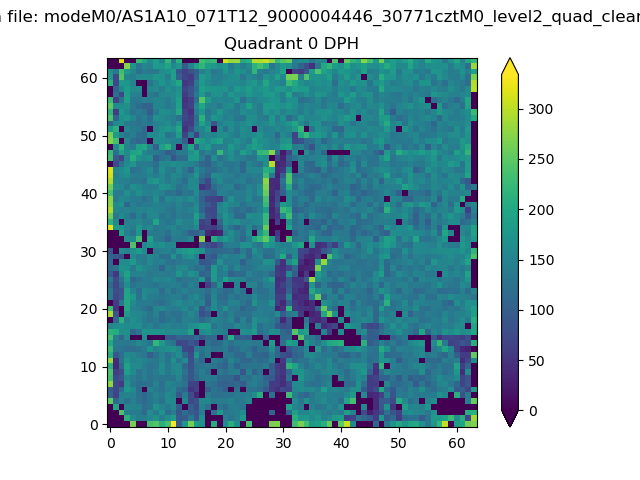 |
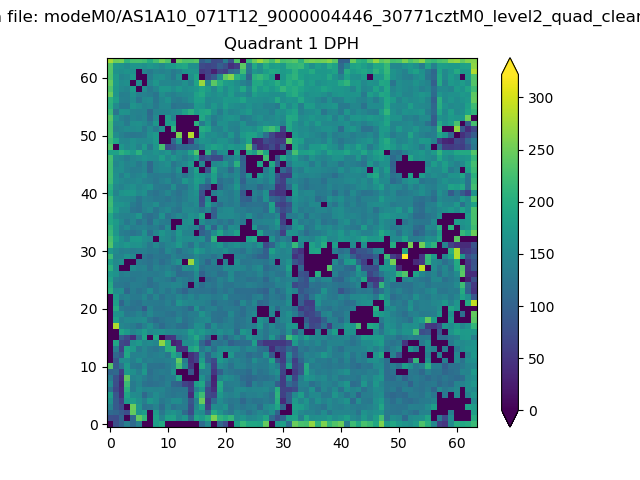 |
Quadrant B |
|---|---|---|---|
| Quadrant D | 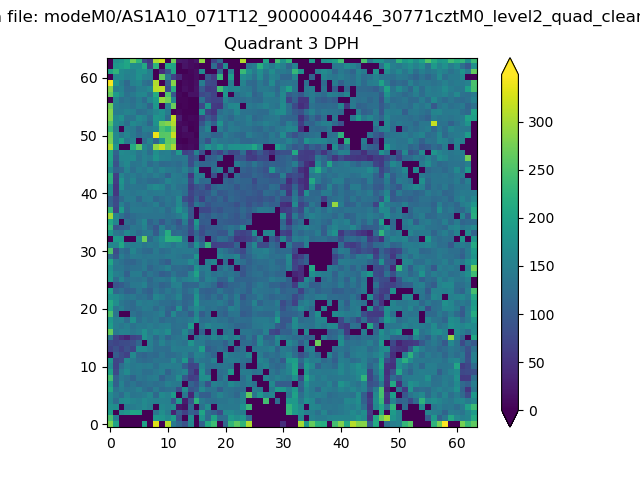 |
 |
Quadrant C |
| Plot type | Count rate plots | Images |
|---|---|---|
| Comparison with Poisson distribution Blue bars denote a histogram of data divided into 1 sec bins. Red curve is a Poisson curve with rate = median count rate of data. |
 |
 |
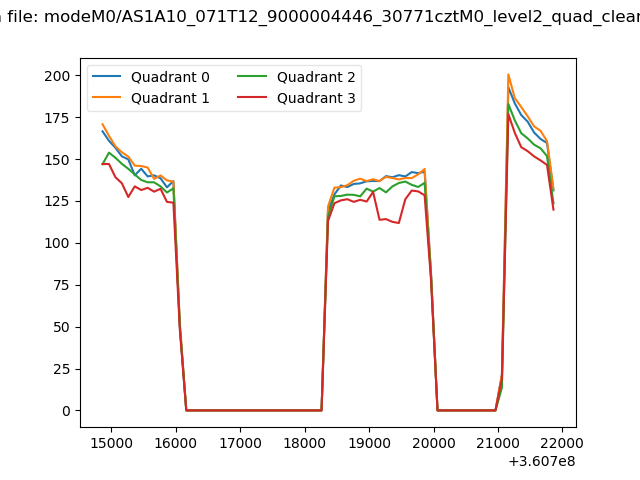
| Quadrant-wise count rates Data is divided into 100 sec bins |
 |
|
| Module-wise count rates for Quadrant A Data is divided into 100 sec bins |
 |
 |
| Module-wise count rates for Quadrant B Data is divided into 100 sec bins |
 |
 |
| Module-wise count rates for Quadrant C Data is divided into 100 sec bins |
 |
 |
| Module-wise count rates for Quadrant D Data is divided into 100 sec bins |
 |
 |
| Parameter | Plot |
|---|---|
| CZT HV Monitor |  |
| D_VDD | 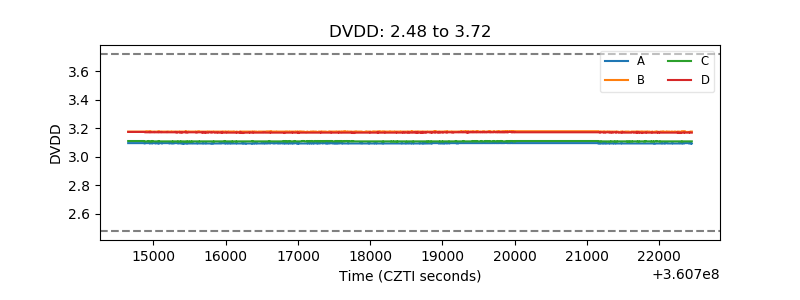 |
| Temperature 1 | 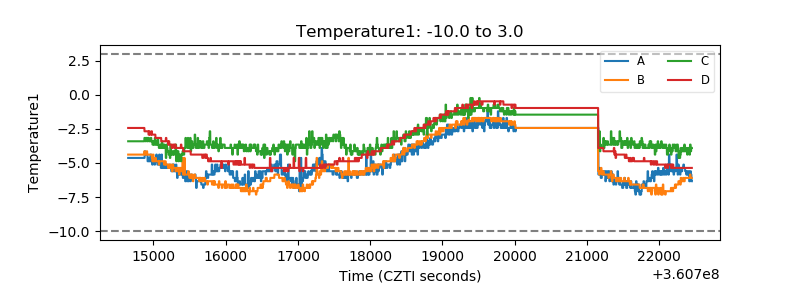 |
| Veto HV Monitor | 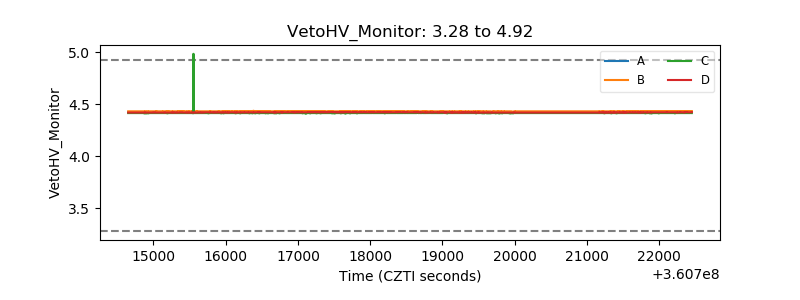 |
| Veto LLD | 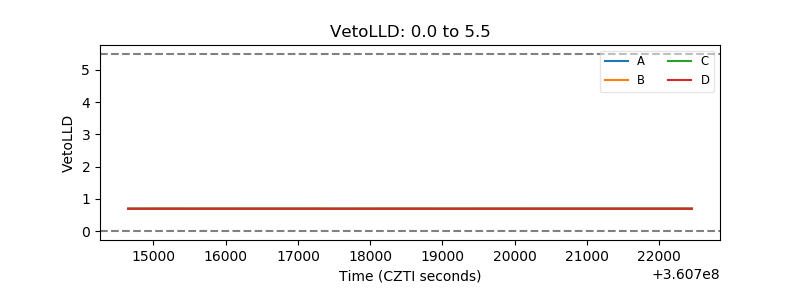 |
| Alpha Counter | 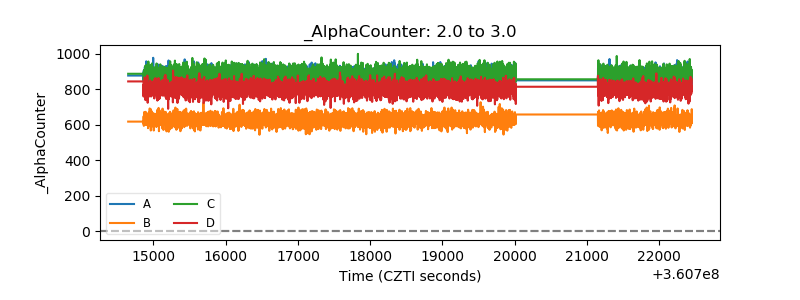 |
| _CPM_Rate | 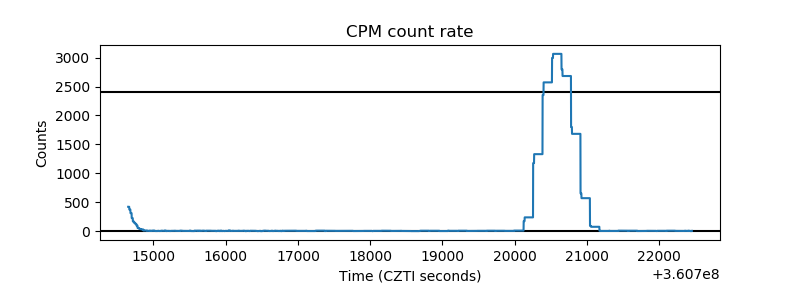 |
| CZT Counter |  |
| +2.5 Volts monitor |  |
| +5 Volts monitor |  |
| _ROLL_ROT |  |
| _Roll_DEC | 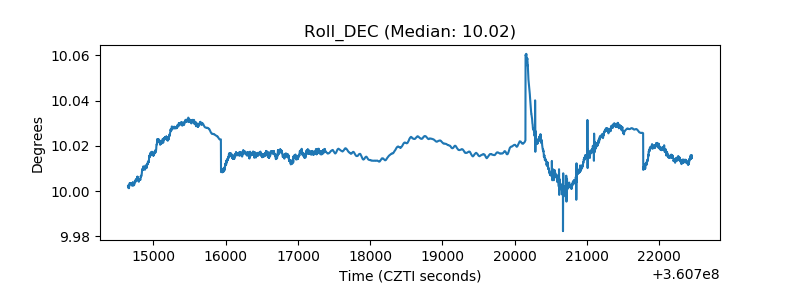 |
| _Roll_RA |  |
| Veto Counter |  |