| Param | Original file | Final file |
|---|---|---|
| Filename | modeM0/AS1A10_071T12_9000004446_30772cztM0_level2.evt | modeM0/AS1A10_071T12_9000004446_30772cztM0_level2_quad_clean.evt |
| Size (bytes) | 572,379,840 | 77,584,320 |
| Size | 545.9 MB | 74.0 MB |
| Events in quadrant A | 3,343,805 | 495,618 |
| Events in quadrant B | 5,158,344 | 500,325 |
| Events in quadrant C | 3,552,145 | 465,841 |
| Events in quadrant D | 4,854,645 | 448,378 |
| Mode SS | |||
|---|---|---|---|
| Quadrant | BADHDUFLAG | Total packets | Discarded packets |
| A | 0 | 128 | 0 |
| B | 0 | 128 | 0 |
| C | 0 | 128 | 0 |
| D | 0 | 128 | 0 |
| Mode M9 | |||
|---|---|---|---|
| Quadrant | BADHDUFLAG | Total packets | Discarded packets |
| A | 0 | 19 | 0 |
| B | 0 | 20 | 0 |
| C | 0 | 20 | 0 |
| D | 0 | 20 | 0 |
| Mode M0 | |||
|---|---|---|---|
| Quadrant | BADHDUFLAG | Total packets | Discarded packets |
| A | 0 | 13665 | 2 |
| B | 0 | 19388 | 2 |
| C | 0 | 14230 | 4 |
| D | 0 | 18662 | 2 |
| Quadrant | Total seconds | Saturated seconds | Saturation percentage |
|---|---|---|---|
| A | 6294 | 23 | 0.365427% |
| B | 6294 | 70 | 1.112170% |
| C | 6293 | 108 | 1.716193% |
| D | 6293 | 195 | 3.098681% |
Noise dominated data is calculated using 1-second bins in cleaned event files. If a bin has >2000 counts, and if more than 50% of those come from <1% of pixels, then it is considered to be noise-dominated and hence unusable.
| Quadrant | # 1 sec bins | Bins with >0 counts | Bins with >2000 counts | High rate bins dominated by noise | Noise dominated (total time) | Noise dominated (detector-on time) | Marked lightcurve |
|---|---|---|---|---|---|---|---|
| A | 7529 | 6295 | 5 | 5 | 0.07% | 0.08% | 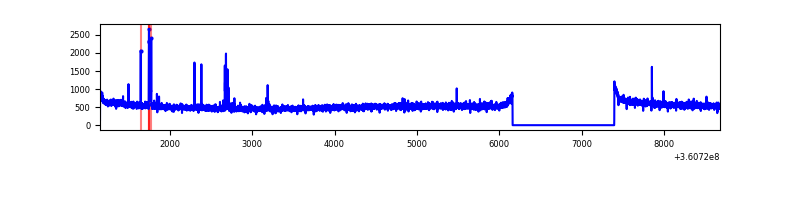 |
| B | 7529 | 6294 | 1 | 1 | 0.01% | 0.02% | 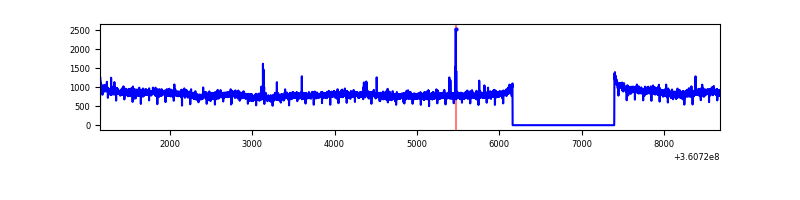 |
| C | 7528 | 6293 | 7 | 7 | 0.09% | 0.11% | 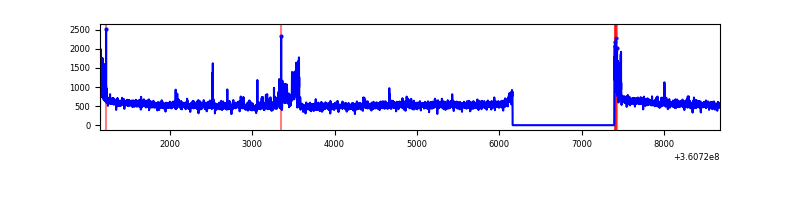 |
| D | 7528 | 6294 | 280 | 280 | 3.72% | 4.45% | 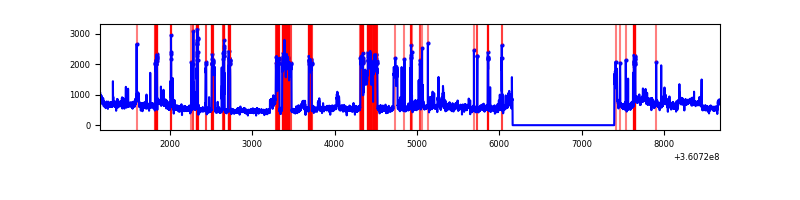 |
Top three noisy pixels from each quadrant. If the there are fewer than three noisy pixels in the level2.evt file, extra rows are filled as -1
| Pixel properties | Quadrant properties | ||||||
|---|---|---|---|---|---|---|---|
| Quadrant | DetID | PixID | Counts | Sigma | Mean | Median | Sigma |
| A | 0 | 13 | 59034 | 343.06 | 851 | 836 | 169.6 |
| A | 13 | 254 | 11004 | 59.94 | 851 | 836 | 169.6 |
| A | 3 | 137 | 7934 | 41.84 | 851 | 836 | 169.6 |
| B | 6 | 159 | 1784961 | 11181.84 | 848 | 829 | 159.6 |
| B | 0 | 230 | 20494 | 123.25 | 848 | 829 | 159.6 |
| B | 12 | 111 | 19180 | 115.01 | 848 | 829 | 159.6 |
| C | 3 | 233 | 206622 | 1096.73 | 802 | 807 | 187.7 |
| C | 14 | 238 | 133714 | 708.22 | 802 | 807 | 187.7 |
| C | 0 | 10 | 67387 | 354.78 | 802 | 807 | 187.7 |
| D | 8 | 195 | 1497036 | 7232.63 | 793 | 780 | 206.9 |
| D | 13 | 249 | 109018 | 523.2 | 793 | 780 | 206.9 |
| D | 2 | 250 | 80267 | 384.23 | 793 | 780 | 206.9 |
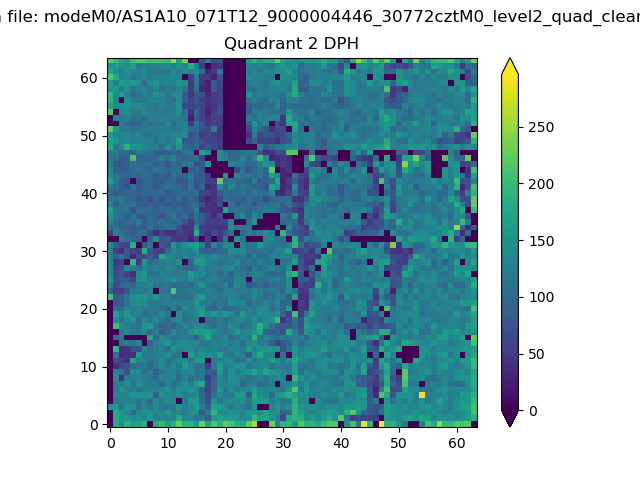
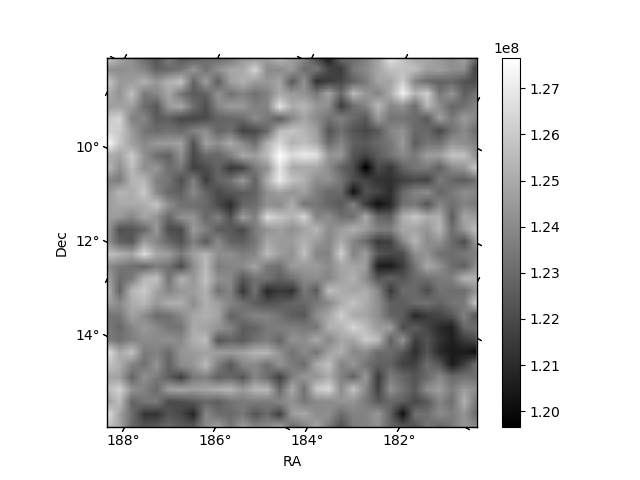
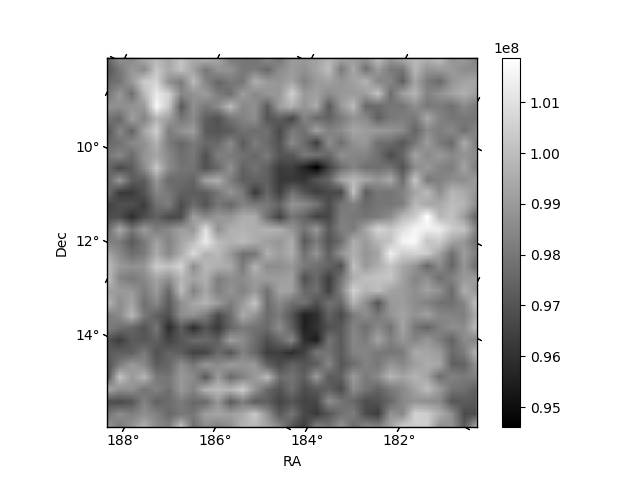
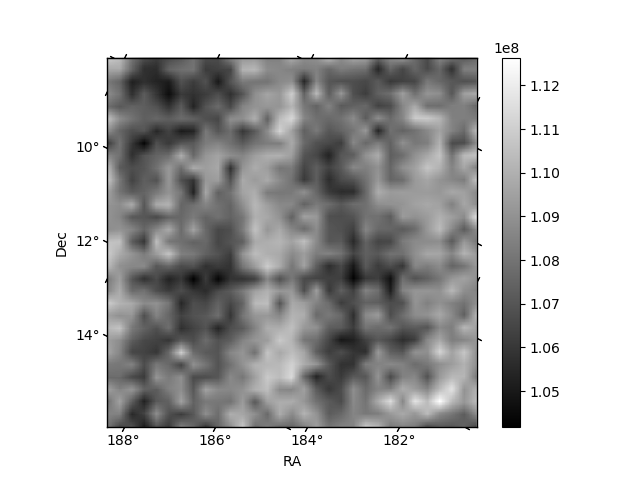
Histogram calculated using DETX and DETY for each event in the final _common_clean file
| Quadrant A | 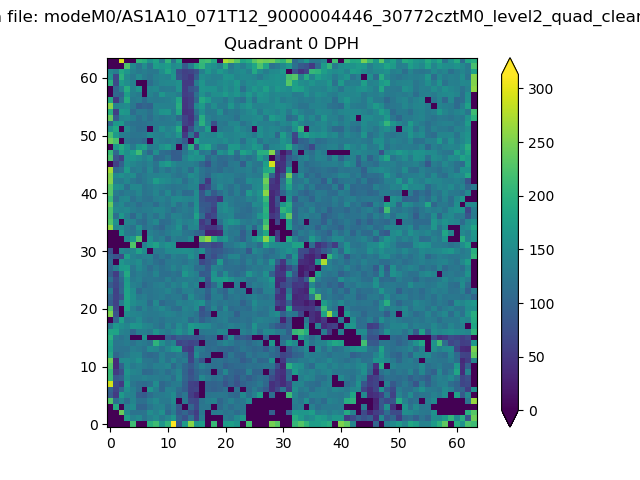 |
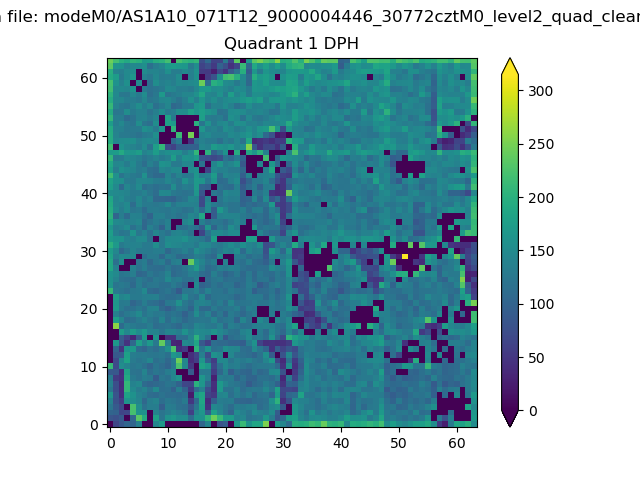 |
Quadrant B |
|---|---|---|---|
| Quadrant D | 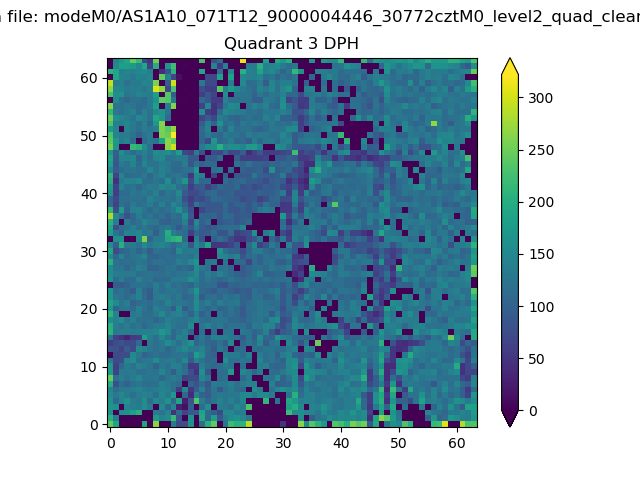 |
 |
Quadrant C |
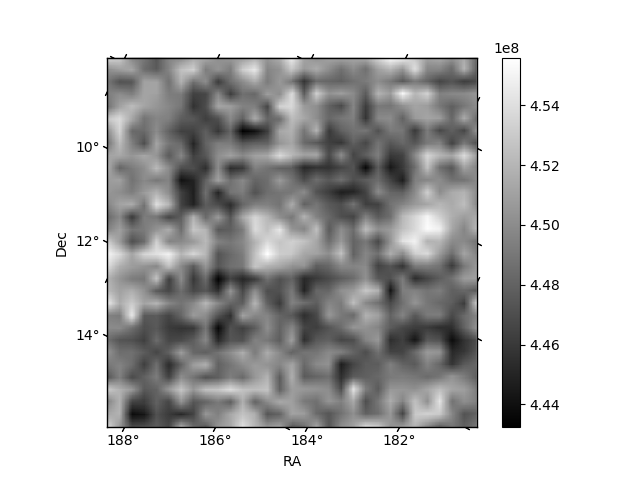
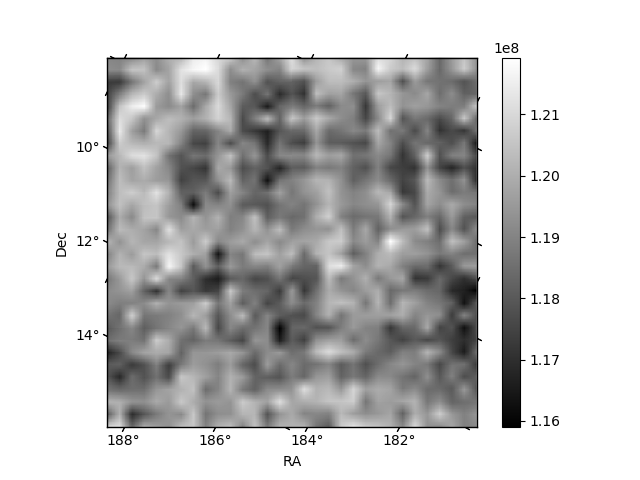
| Plot type | Count rate plots | Images |
|---|---|---|
| Comparison with Poisson distribution Blue bars denote a histogram of data divided into 1 sec bins. Red curve is a Poisson curve with rate = median count rate of data. |
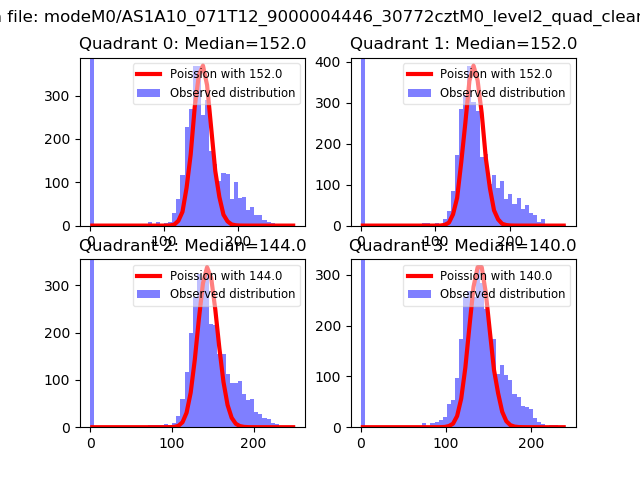 |
 |
| Quadrant-wise count rates Data is divided into 100 sec bins |
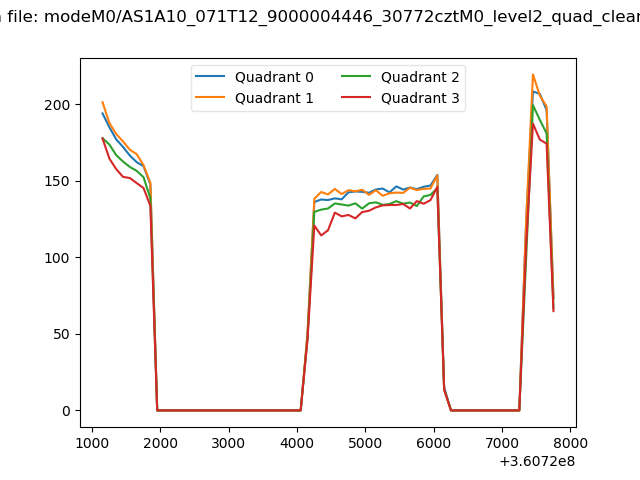 |
|
| Module-wise count rates for Quadrant A Data is divided into 100 sec bins |
 |
 |
| Module-wise count rates for Quadrant B Data is divided into 100 sec bins |
 |
 |
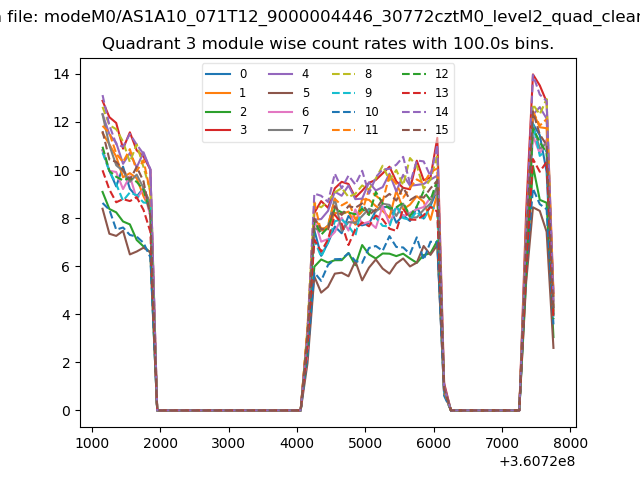
| Module-wise count rates for Quadrant C Data is divided into 100 sec bins |
 |
 |
| Module-wise count rates for Quadrant D Data is divided into 100 sec bins |
 |
 |
| Parameter | Plot |
|---|---|
| CZT HV Monitor |  |
| D_VDD | 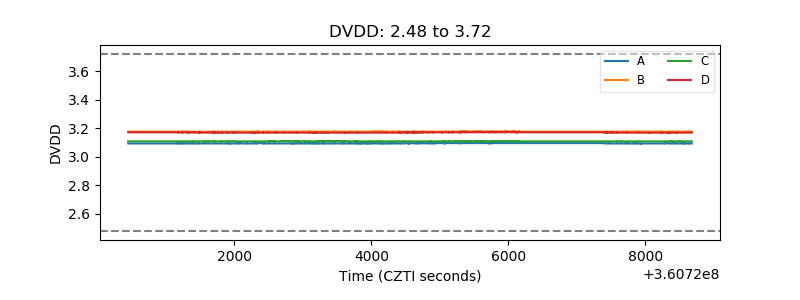 |
| Temperature 1 |  |
| Veto HV Monitor | 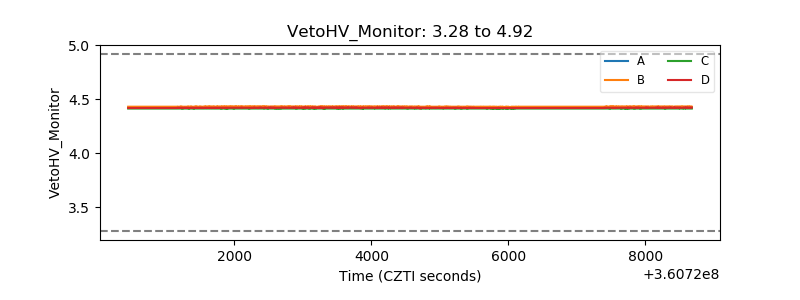 |
| Veto LLD | 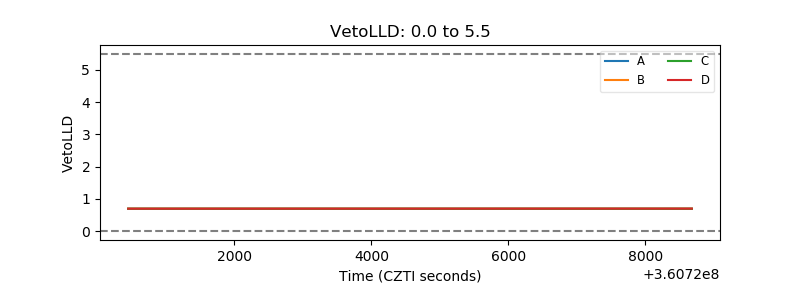 |
| Alpha Counter | 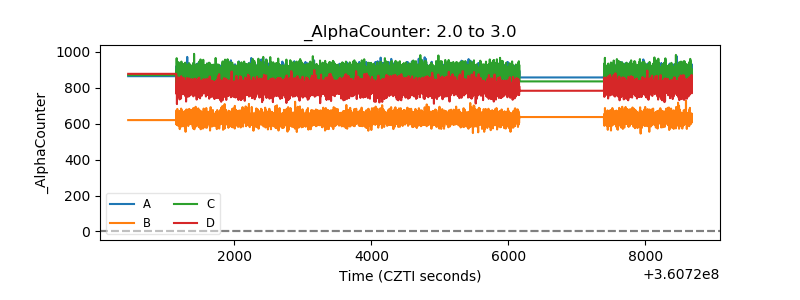 |
| _CPM_Rate | 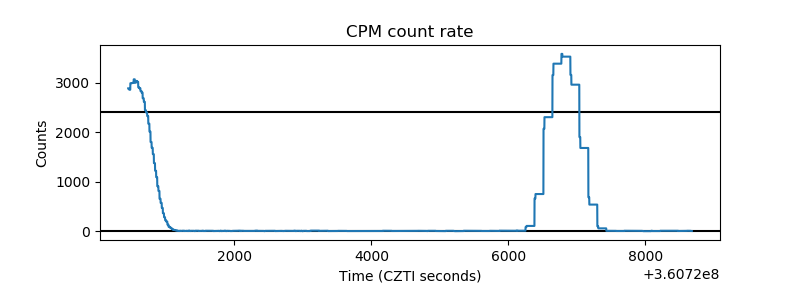 |
| CZT Counter | 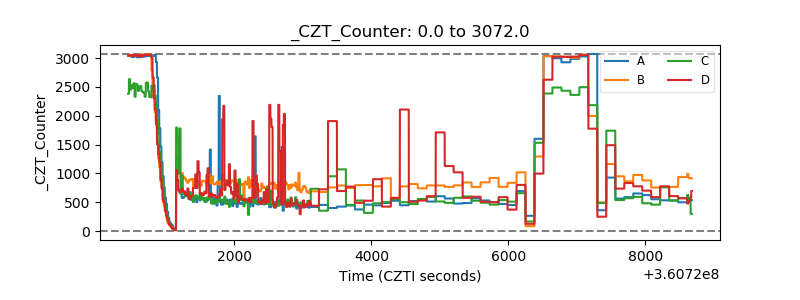 |
| +2.5 Volts monitor | 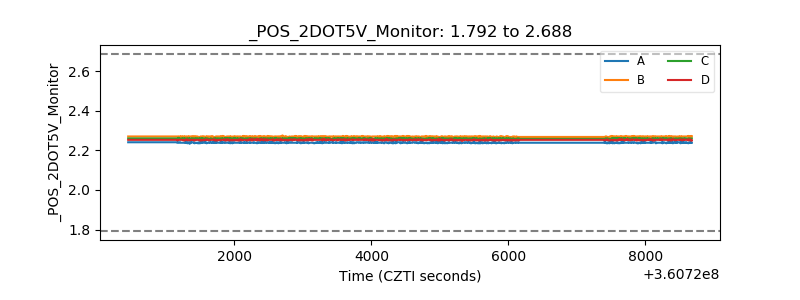 |
| +5 Volts monitor | 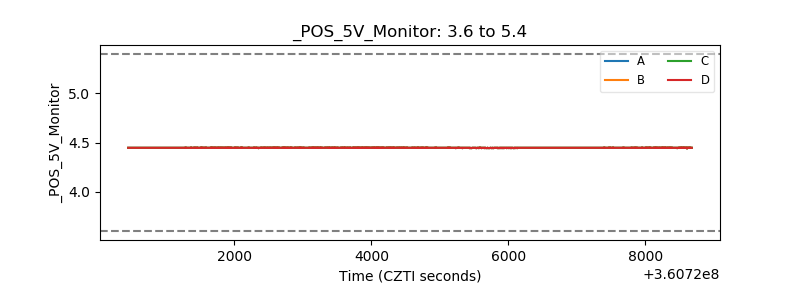 |
| _ROLL_ROT | 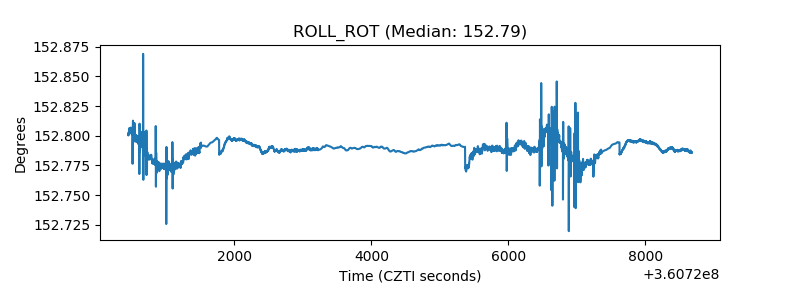 |
| _Roll_DEC |  |
| _Roll_RA | 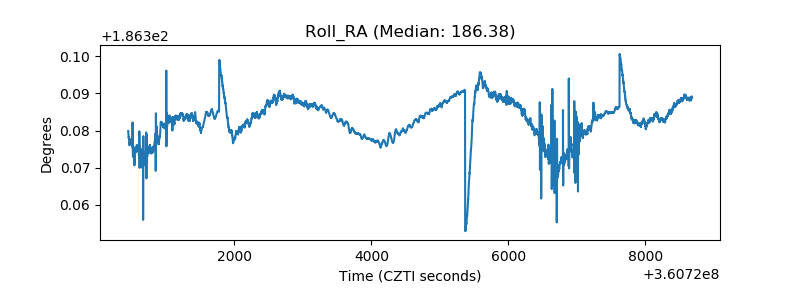 |
| Veto Counter |  |