| Param | Original file | Final file |
|---|---|---|
| Filename | modeM0/AS1A10_071T12_9000004446_30773cztM0_level2.evt | modeM0/AS1A10_071T12_9000004446_30773cztM0_level2_quad_clean.evt |
| Size (bytes) | 612,815,040 | 67,835,520 |
| Size | 584.4 MB | 64.7 MB |
| Events in quadrant A | 3,735,085 | 414,154 |
| Events in quadrant B | 5,457,493 | 416,512 |
| Events in quadrant C | 3,704,211 | 392,083 |
| Events in quadrant D | 5,224,013 | 378,573 |
| Mode SS | |||
|---|---|---|---|
| Quadrant | BADHDUFLAG | Total packets | Discarded packets |
| A | 0 | 134 | 0 |
| B | 0 | 134 | 0 |
| C | 0 | 134 | 0 |
| D | 0 | 134 | 0 |
| Mode M9 | |||
|---|---|---|---|
| Quadrant | BADHDUFLAG | Total packets | Discarded packets |
| A | 0 | 12 | 0 |
| B | 0 | 12 | 0 |
| C | 0 | 12 | 0 |
| D | 0 | 12 | 0 |
| Mode M0 | |||
|---|---|---|---|
| Quadrant | BADHDUFLAG | Total packets | Discarded packets |
| A | 0 | 14922 | 2 |
| B | 0 | 20145 | 2 |
| C | 0 | 14820 | 2 |
| D | 0 | 19999 | 2 |
| Quadrant | Total seconds | Saturated seconds | Saturation percentage |
|---|---|---|---|
| A | 6481 | 97 | 1.496683% |
| B | 6481 | 134 | 2.067582% |
| C | 6481 | 143 | 2.206450% |
| D | 6481 | 177 | 2.731060% |
Noise dominated data is calculated using 1-second bins in cleaned event files. If a bin has >2000 counts, and if more than 50% of those come from <1% of pixels, then it is considered to be noise-dominated and hence unusable.
| Quadrant | # 1 sec bins | Bins with >0 counts | Bins with >2000 counts | High rate bins dominated by noise | Noise dominated (total time) | Noise dominated (detector-on time) | Marked lightcurve |
|---|---|---|---|---|---|---|---|
| A | 7756 | 6481 | 19 | 19 | 0.24% | 0.29% | 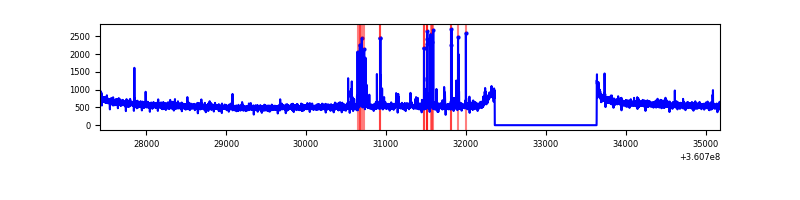 |
| B | 7756 | 6481 | 7 | 7 | 0.09% | 0.11% | 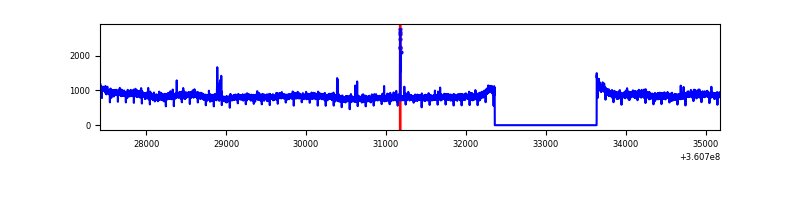 |
| C | 7756 | 6481 | 7 | 7 | 0.09% | 0.11% | 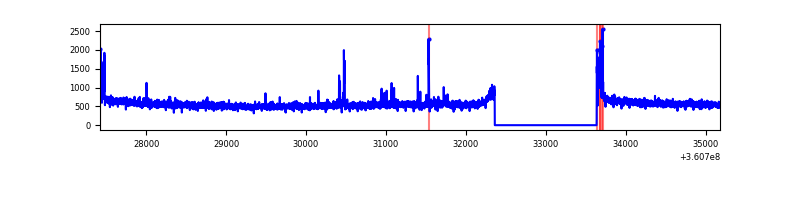 |
| D | 7756 | 6481 | 132 | 132 | 1.70% | 2.04% | 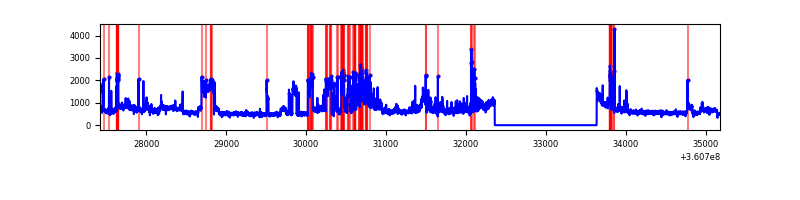 |
Top three noisy pixels from each quadrant. If the there are fewer than three noisy pixels in the level2.evt file, extra rows are filled as -1
| Pixel properties | Quadrant properties | ||||||
|---|---|---|---|---|---|---|---|
| Quadrant | DetID | PixID | Counts | Sigma | Mean | Median | Sigma |
| A | 0 | 13 | 155973 | 846.92 | 928 | 914 | 183.1 |
| A | 13 | 254 | 11253 | 56.47 | 928 | 914 | 183.1 |
| A | 3 | 137 | 8425 | 41.02 | 928 | 914 | 183.1 |
| B | 6 | 159 | 1802038 | 10571.74 | 921 | 903 | 170.4 |
| B | 12 | 111 | 20429 | 114.61 | 921 | 903 | 170.4 |
| B | 0 | 230 | 19449 | 108.86 | 921 | 903 | 170.4 |
| C | 14 | 238 | 143983 | 716.41 | 866 | 874 | 199.8 |
| C | 3 | 233 | 112258 | 557.59 | 866 | 874 | 199.8 |
| C | 0 | 10 | 55675 | 274.34 | 866 | 874 | 199.8 |
| D | 8 | 195 | 1366181 | 6204.55 | 863 | 844 | 220.1 |
| D | 10 | 253 | 342156 | 1551.04 | 863 | 844 | 220.1 |
| D | 2 | 250 | 103388 | 465.99 | 863 | 844 | 220.1 |
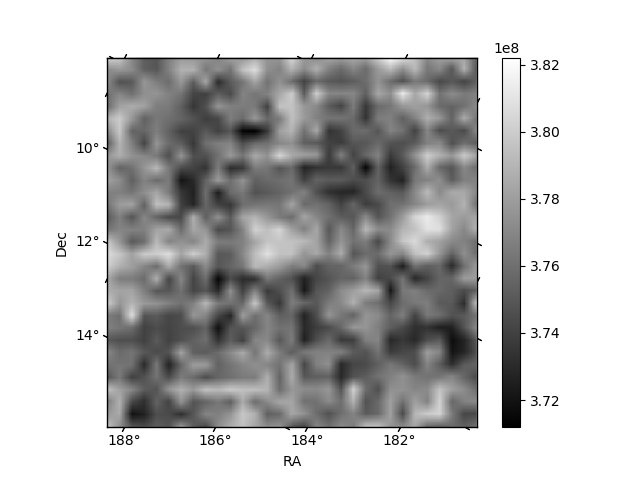
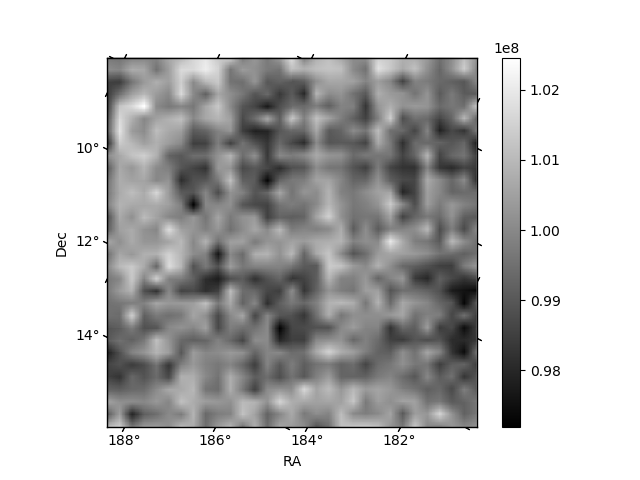
Histogram calculated using DETX and DETY for each event in the final _common_clean file
| Quadrant A | 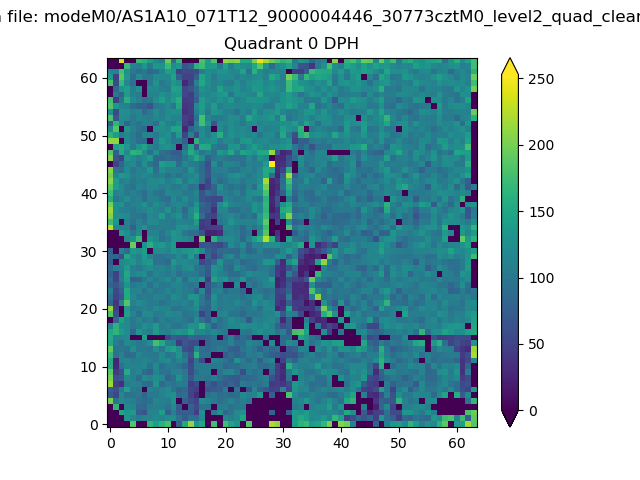 |
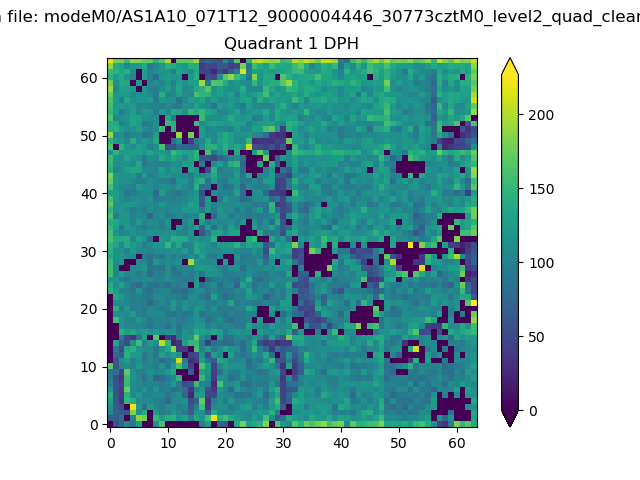 |
Quadrant B |
|---|---|---|---|
| Quadrant D | 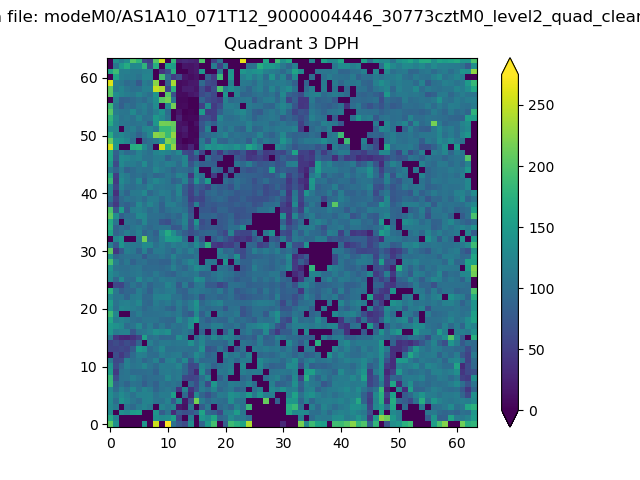 |
 |
Quadrant C |
| Plot type | Count rate plots | Images |
|---|---|---|
| Comparison with Poisson distribution Blue bars denote a histogram of data divided into 1 sec bins. Red curve is a Poisson curve with rate = median count rate of data. |
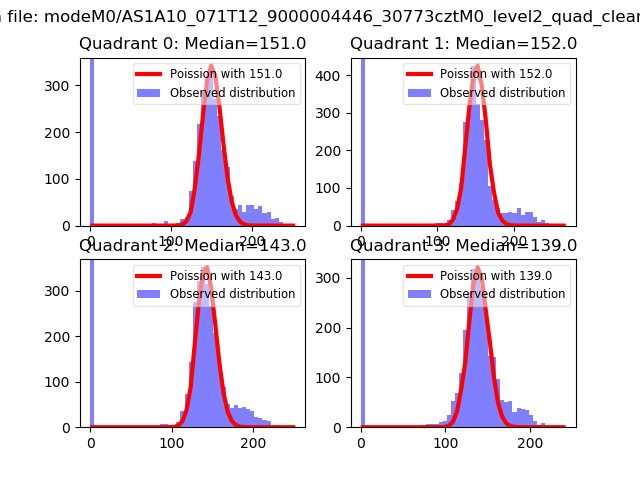 |
 |
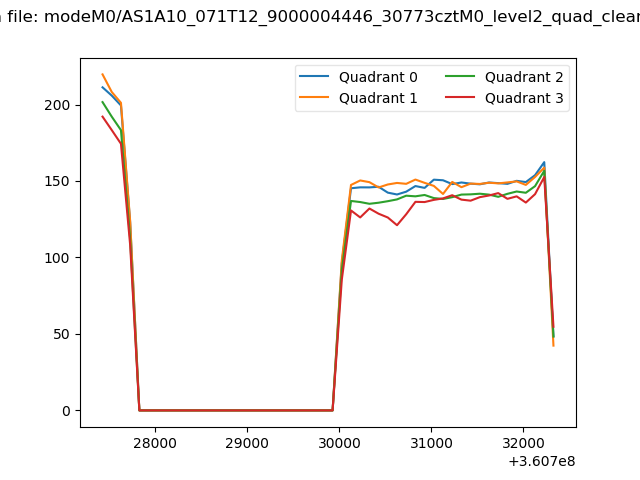
| Quadrant-wise count rates Data is divided into 100 sec bins |
 |
|
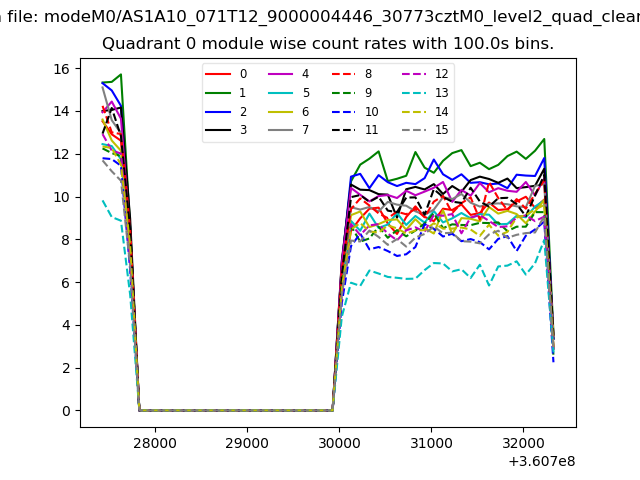
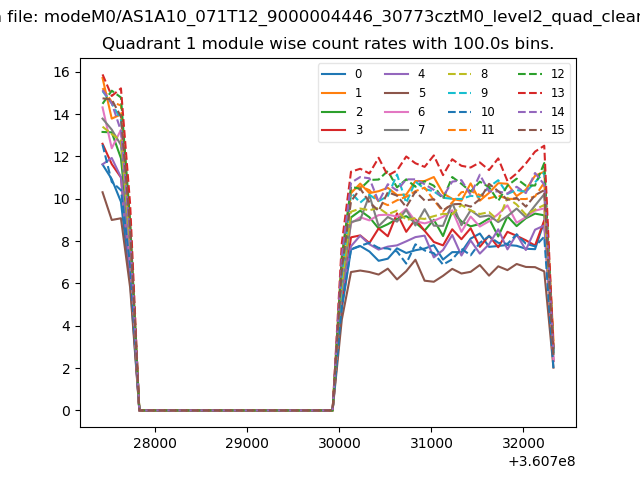
| Module-wise count rates for Quadrant A Data is divided into 100 sec bins |
 |
 |
| Module-wise count rates for Quadrant B Data is divided into 100 sec bins |
 |
 |
| Module-wise count rates for Quadrant C Data is divided into 100 sec bins |
 |
 |
| Module-wise count rates for Quadrant D Data is divided into 100 sec bins |
 |
 |
| Parameter | Plot |
|---|---|
| CZT HV Monitor |  |
| D_VDD | 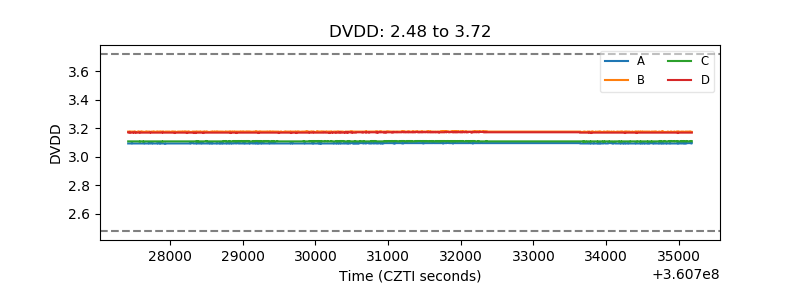 |
| Temperature 1 | 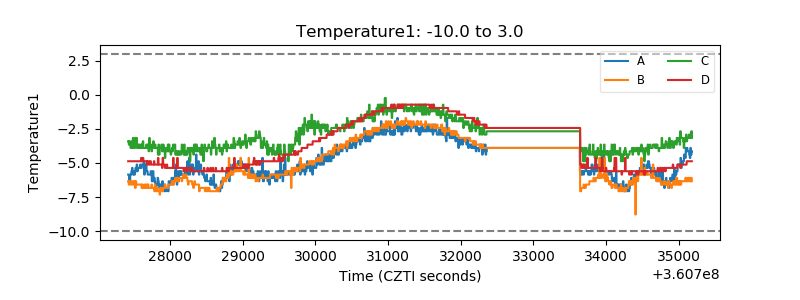 |
| Veto HV Monitor | 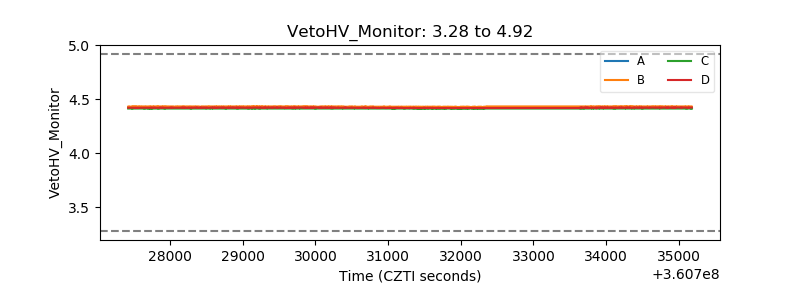 |
| Veto LLD | 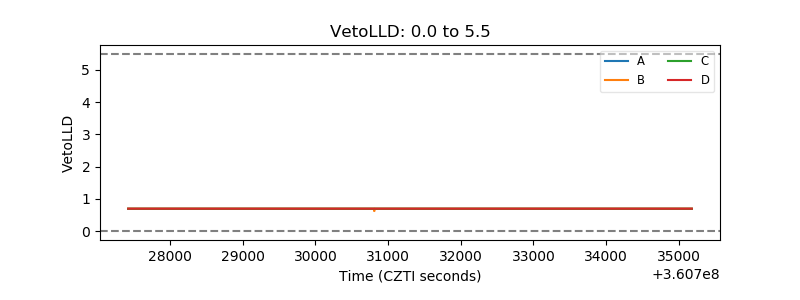 |
| Alpha Counter | 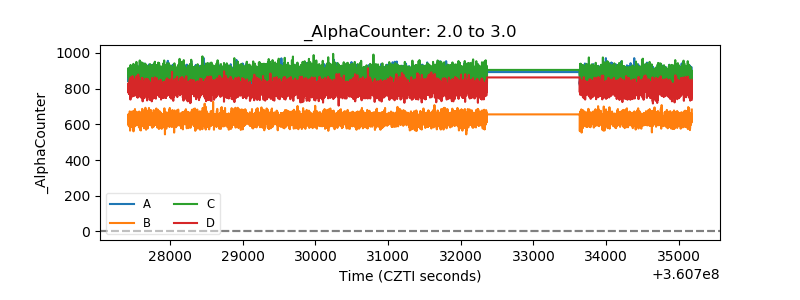 |
| _CPM_Rate | 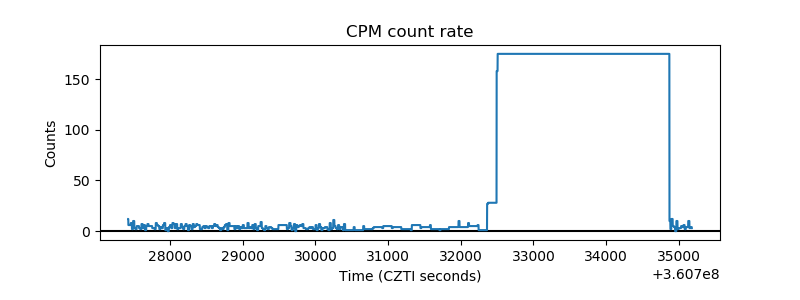 |
| CZT Counter | 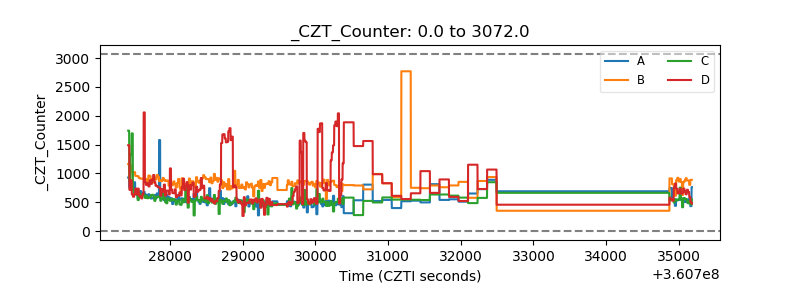 |
| +2.5 Volts monitor | 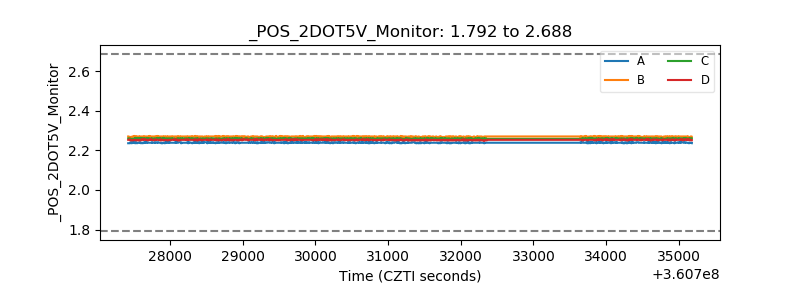 |
| +5 Volts monitor | 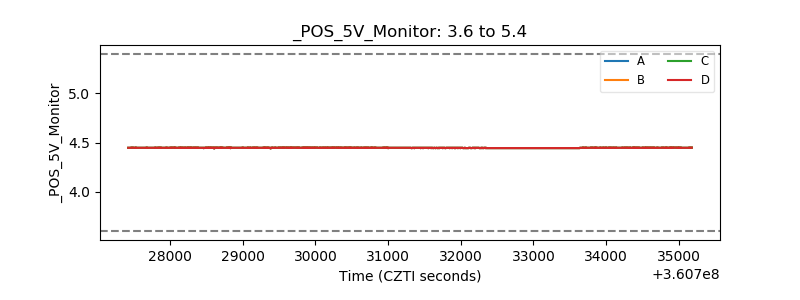 |
| _ROLL_ROT | 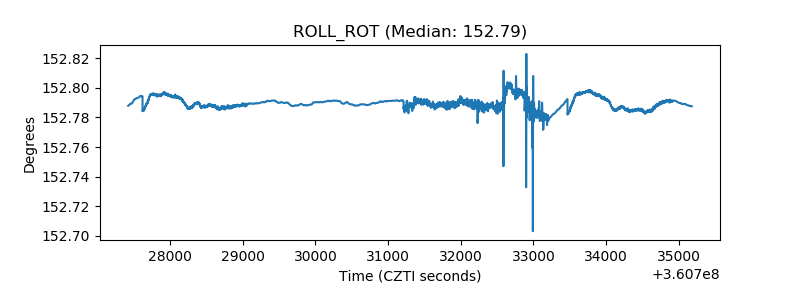 |
| _Roll_DEC | 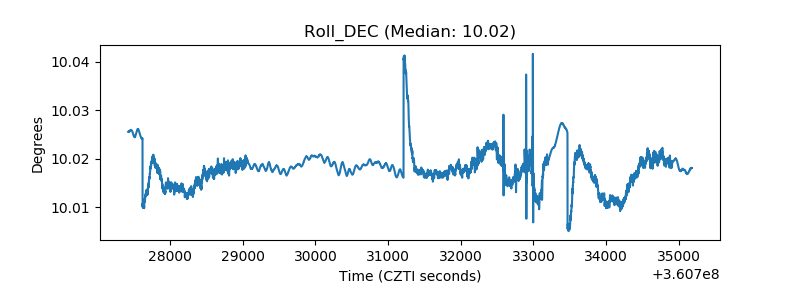 |
| _Roll_RA | 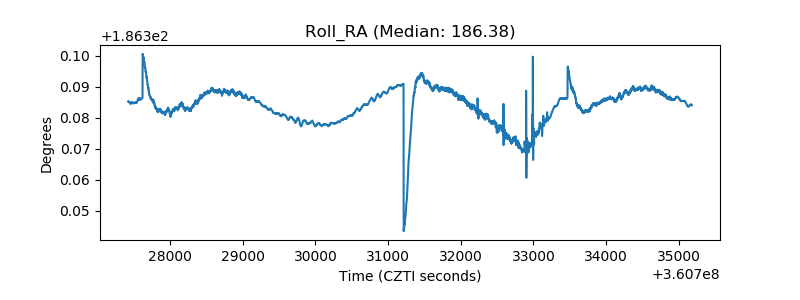 |
| Veto Counter | 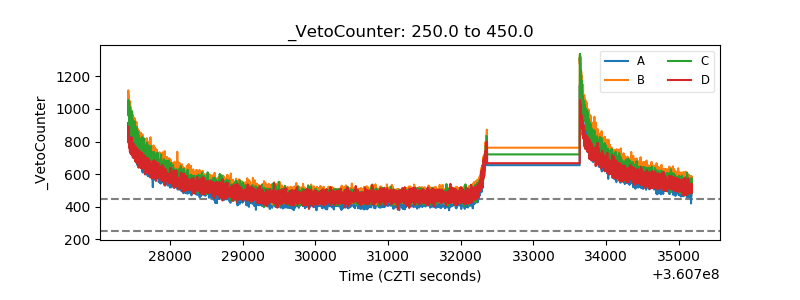 |