| Param | Original file | Final file |
|---|---|---|
| Filename | modeM0/AS1A10_071T12_9000004446_30774cztM0_level2.evt | modeM0/AS1A10_071T12_9000004446_30774cztM0_level2_quad_clean.evt |
| Size (bytes) | 605,897,280 | 65,609,280 |
| Size | 577.8 MB | 62.6 MB |
| Events in quadrant A | 3,571,787 | 406,951 |
| Events in quadrant B | 5,332,197 | 405,627 |
| Events in quadrant C | 3,959,086 | 379,041 |
| Events in quadrant D | 5,060,815 | 355,084 |
| Mode SS | |||
|---|---|---|---|
| Quadrant | BADHDUFLAG | Total packets | Discarded packets |
| A | 0 | 128 | 0 |
| B | 0 | 128 | 0 |
| C | 0 | 128 | 0 |
| D | 0 | 128 | 0 |
| Mode M9 | |||
|---|---|---|---|
| Quadrant | BADHDUFLAG | Total packets | Discarded packets |
| A | 0 | 20 | 0 |
| B | 0 | 21 | 0 |
| C | 0 | 21 | 0 |
| D | 0 | 21 | 0 |
| Mode M0 | |||
|---|---|---|---|
| Quadrant | BADHDUFLAG | Total packets | Discarded packets |
| A | 0 | 14259 | 2 |
| B | 0 | 19635 | 2 |
| C | 0 | 15575 | 2 |
| D | 0 | 19107 | 2 |
| Quadrant | Total seconds | Saturated seconds | Saturation percentage |
|---|---|---|---|
| A | 6300 | 60 | 0.952381% |
| B | 6300 | 151 | 2.396825% |
| C | 6300 | 267 | 4.238095% |
| D | 6300 | 349 | 5.539683% |
Noise dominated data is calculated using 1-second bins in cleaned event files. If a bin has >2000 counts, and if more than 50% of those come from <1% of pixels, then it is considered to be noise-dominated and hence unusable.
| Quadrant | # 1 sec bins | Bins with >0 counts | Bins with >2000 counts | High rate bins dominated by noise | Noise dominated (total time) | Noise dominated (detector-on time) | Marked lightcurve |
|---|---|---|---|---|---|---|---|
| A | 7655 | 6300 | 0 | 0 | 0.00% | 0.00% | 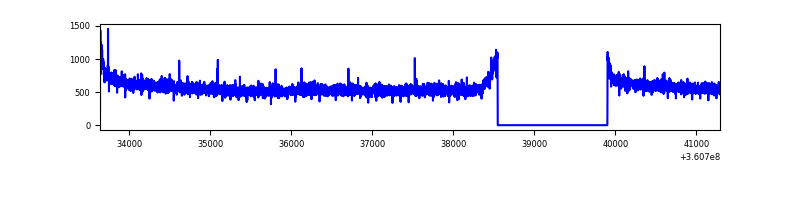 |
| B | 7655 | 6300 | 1 | 1 | 0.01% | 0.02% | 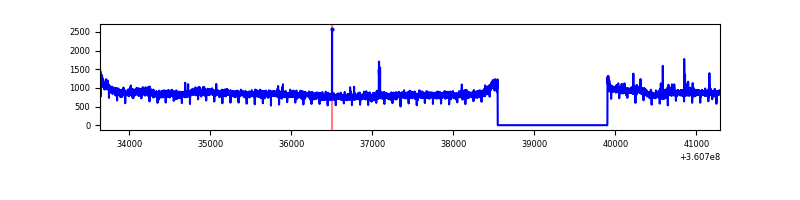 |
| C | 7655 | 6300 | 103 | 103 | 1.35% | 1.63% | 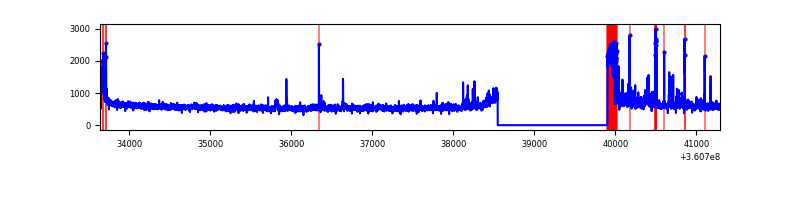 |
| D | 7655 | 6301 | 300 | 300 | 3.92% | 4.76% | 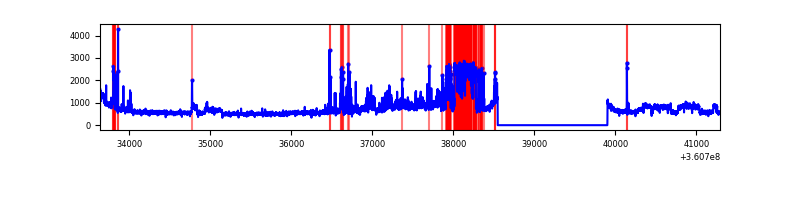 |
Top three noisy pixels from each quadrant. If the there are fewer than three noisy pixels in the level2.evt file, extra rows are filled as -1
| Pixel properties | Quadrant properties | ||||||
|---|---|---|---|---|---|---|---|
| Quadrant | DetID | PixID | Counts | Sigma | Mean | Median | Sigma |
| A | 0 | 13 | 11174 | 55.9 | 924 | 912 | 183.6 |
| A | 13 | 254 | 10152 | 50.33 | 924 | 912 | 183.6 |
| A | 3 | 137 | 8229 | 39.86 | 924 | 912 | 183.6 |
| B | 6 | 159 | 1715971 | 10143.13 | 911 | 894 | 169.1 |
| B | 0 | 230 | 25296 | 144.32 | 911 | 894 | 169.1 |
| B | 12 | 111 | 20244 | 114.44 | 911 | 894 | 169.1 |
| C | 0 | 10 | 418162 | 2165.49 | 841 | 850 | 192.7 |
| C | 14 | 238 | 139977 | 721.95 | 841 | 850 | 192.7 |
| C | 3 | 233 | 104404 | 537.36 | 841 | 850 | 192.7 |
| D | 8 | 195 | 1157843 | 5477.66 | 848 | 831 | 211.2 |
| D | 13 | 249 | 406857 | 1922.25 | 848 | 831 | 211.2 |
| D | 10 | 253 | 120282 | 565.52 | 848 | 831 | 211.2 |
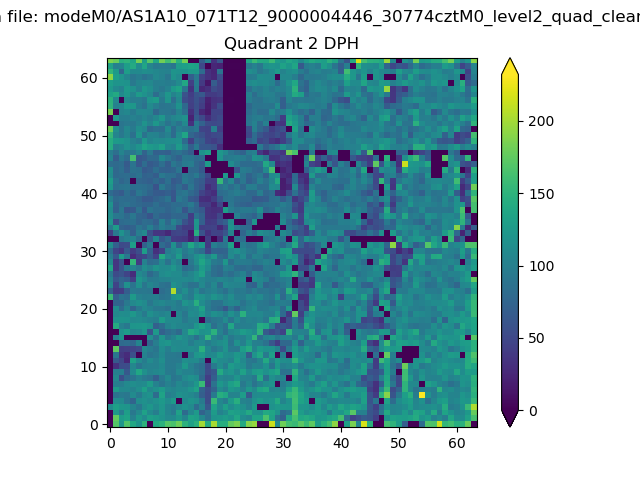
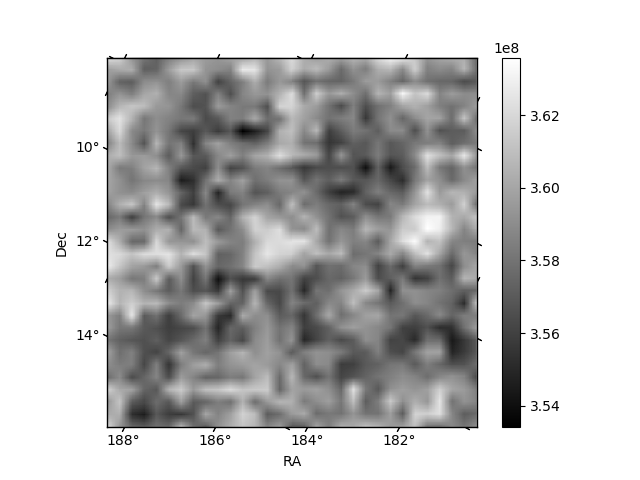
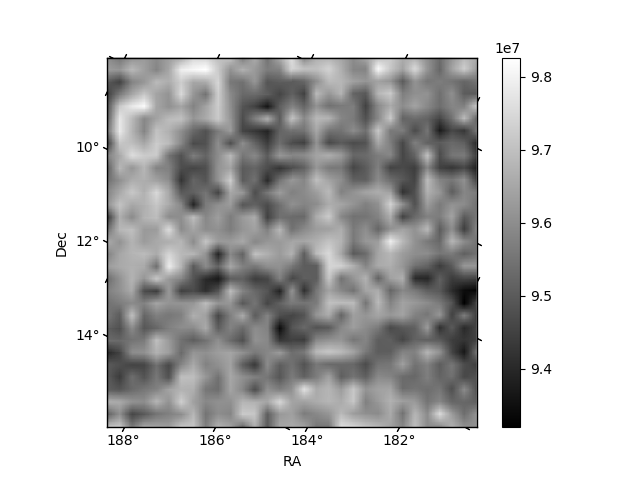
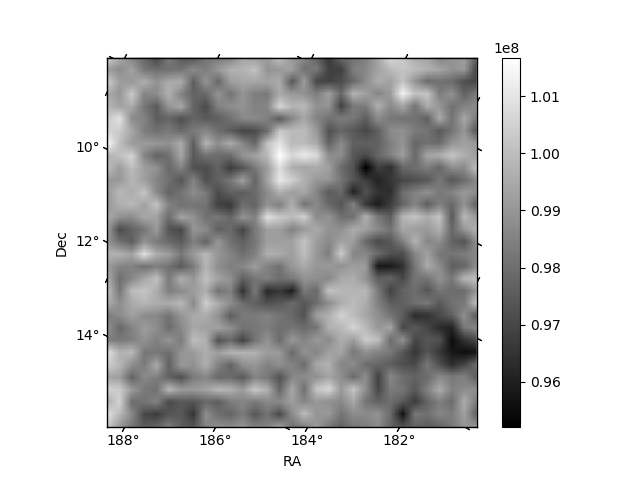
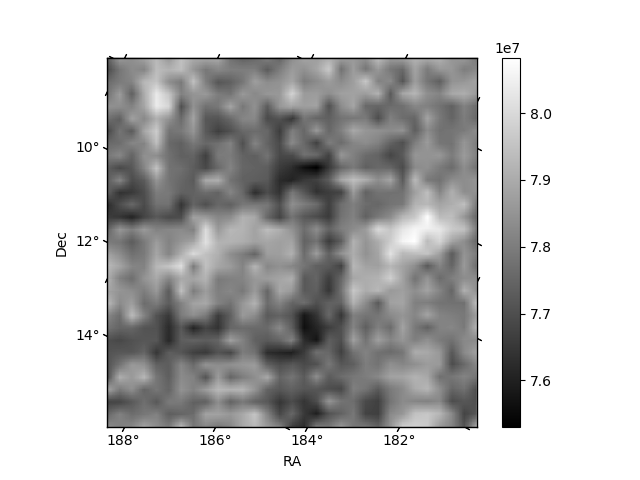
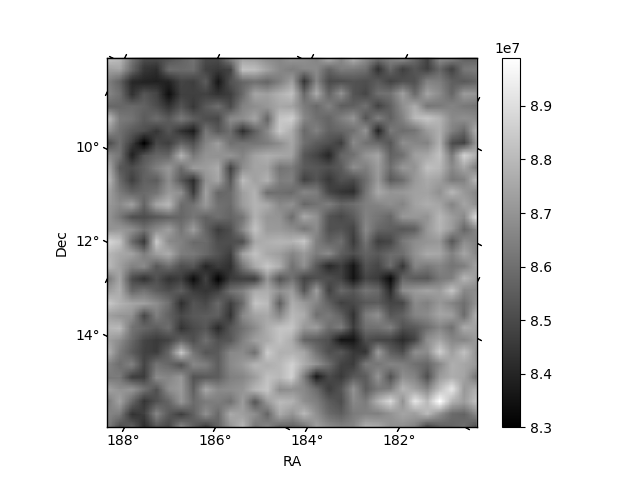
Histogram calculated using DETX and DETY for each event in the final _common_clean file
| Quadrant A | 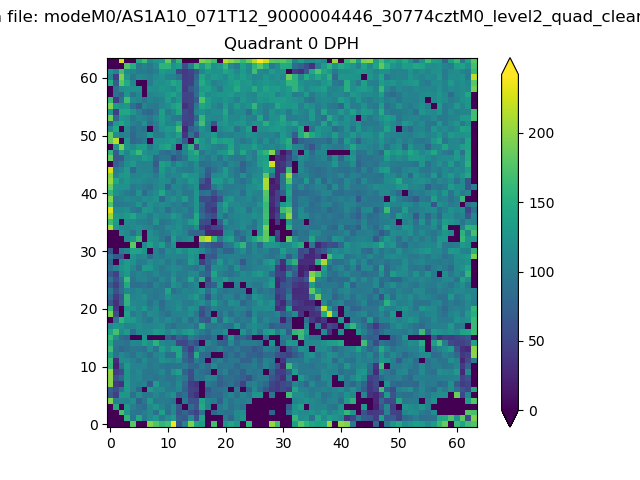 |
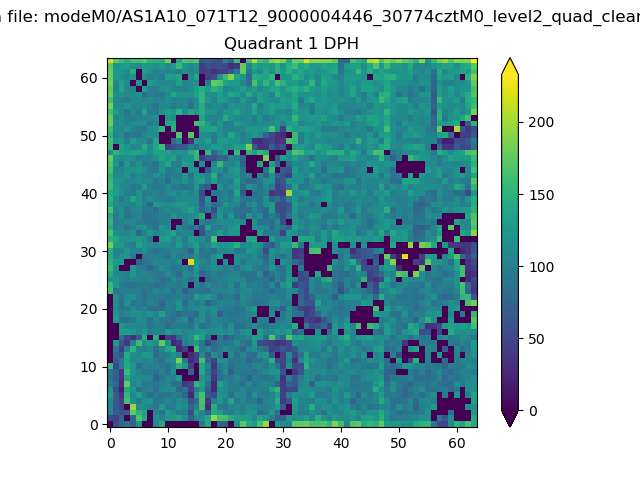 |
Quadrant B |
|---|---|---|---|
| Quadrant D | 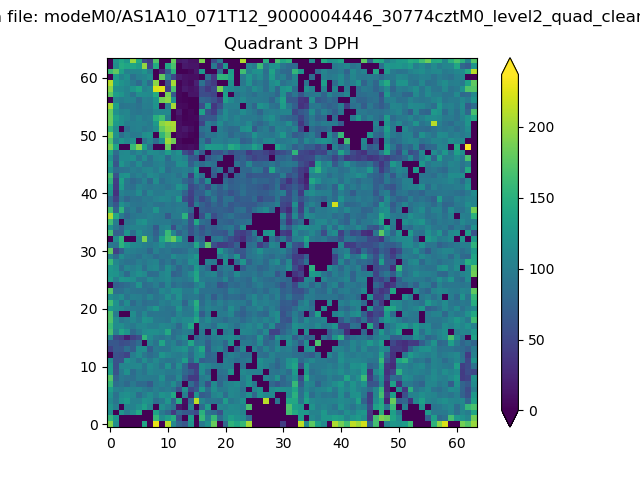 |
 |
Quadrant C |
| Plot type | Count rate plots | Images |
|---|---|---|
| Comparison with Poisson distribution Blue bars denote a histogram of data divided into 1 sec bins. Red curve is a Poisson curve with rate = median count rate of data. |
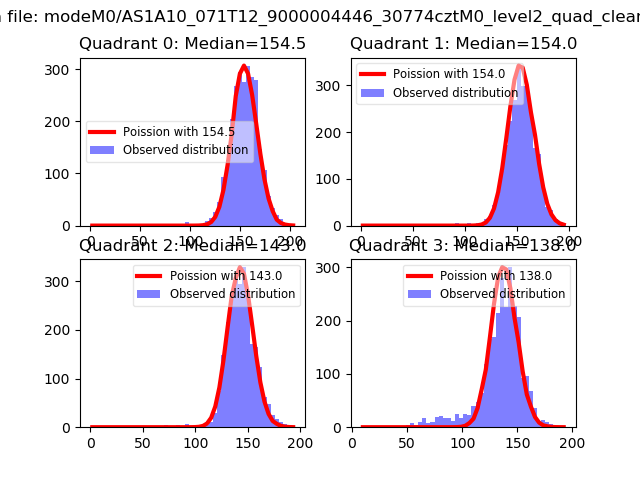 |
 |
| Quadrant-wise count rates Data is divided into 100 sec bins |
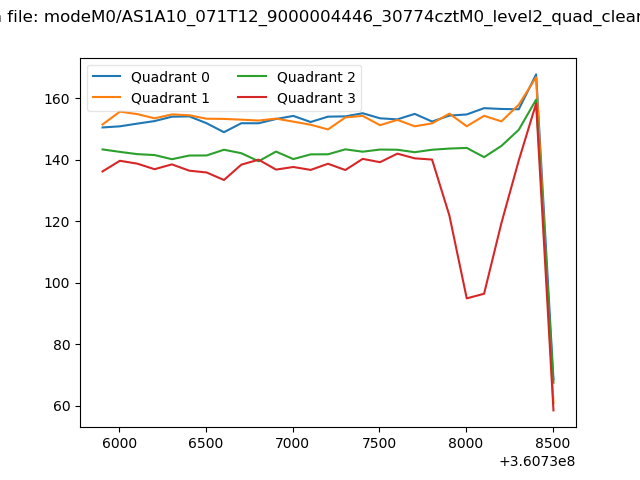 |
|
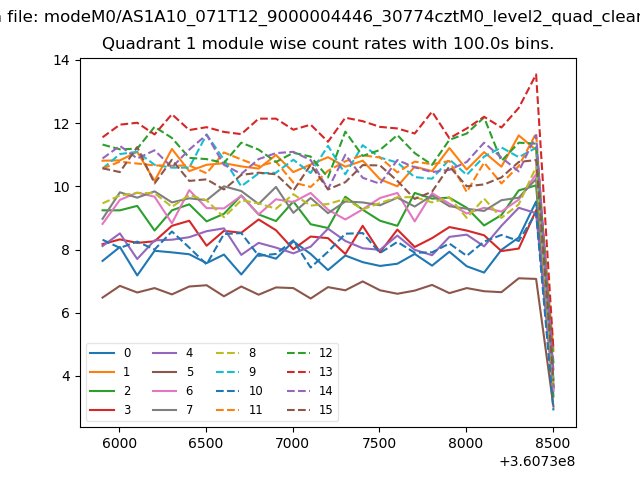
| Module-wise count rates for Quadrant A Data is divided into 100 sec bins |
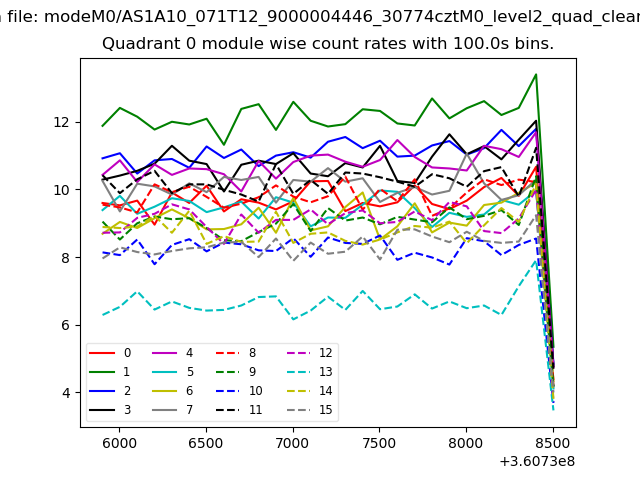 |
 |
| Module-wise count rates for Quadrant B Data is divided into 100 sec bins |
 |
 |
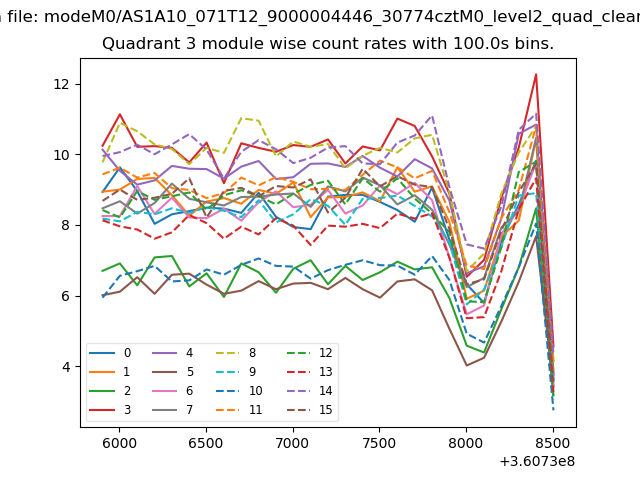
| Module-wise count rates for Quadrant C Data is divided into 100 sec bins |
 |
 |
| Module-wise count rates for Quadrant D Data is divided into 100 sec bins |
 |
 |
| Parameter | Plot |
|---|---|
| CZT HV Monitor |  |
| D_VDD | 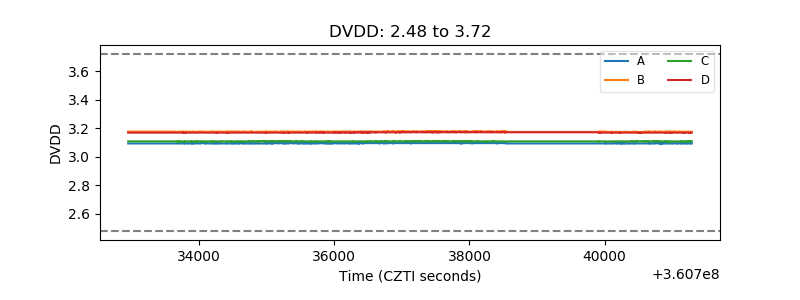 |
| Temperature 1 | 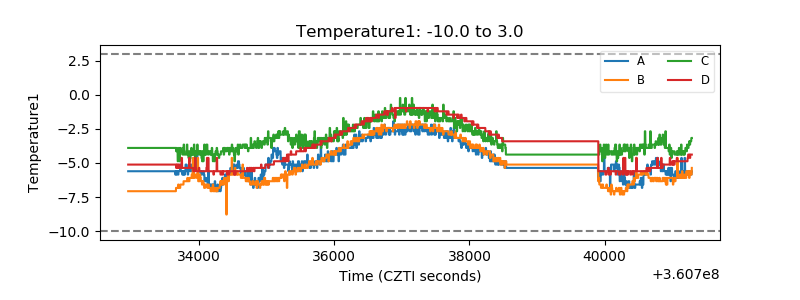 |
| Veto HV Monitor | 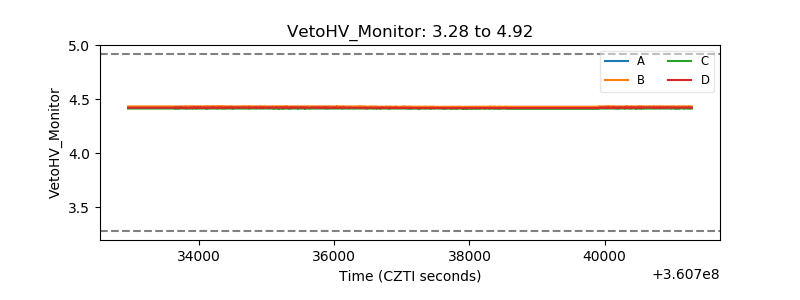 |
| Veto LLD | 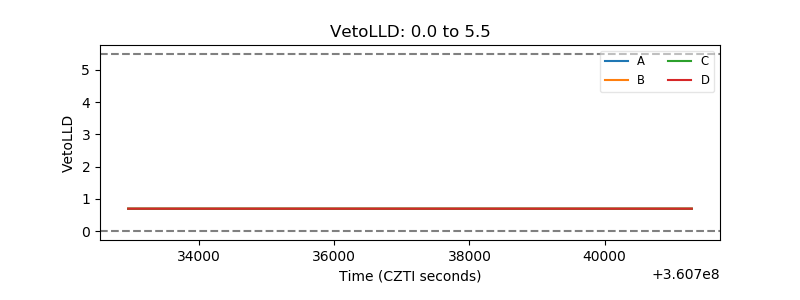 |
| Alpha Counter | 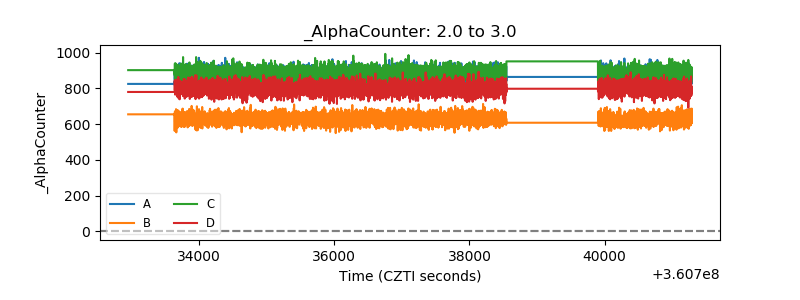 |
| _CPM_Rate | 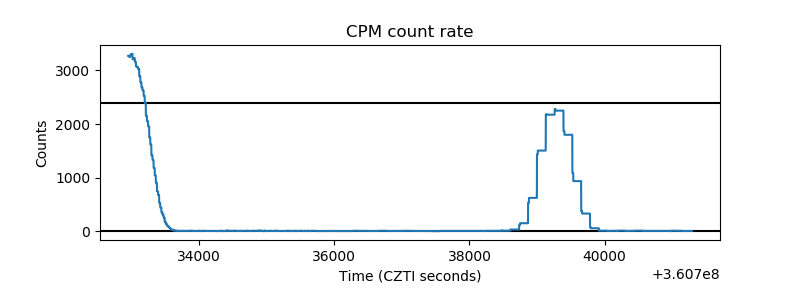 |
| CZT Counter | 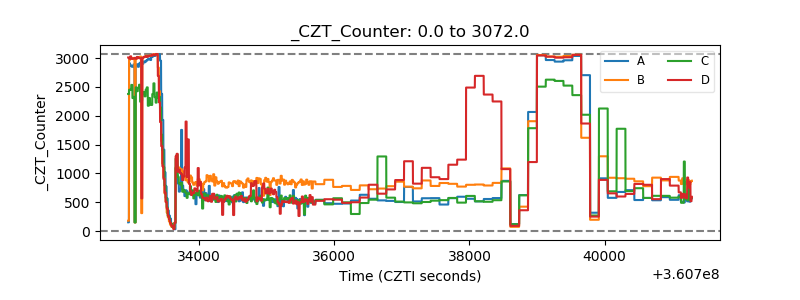 |
| +2.5 Volts monitor |  |
| +5 Volts monitor |  |
| _ROLL_ROT | 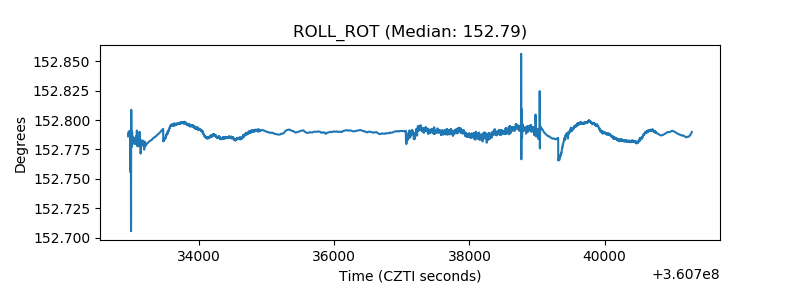 |
| _Roll_DEC |  |
| _Roll_RA | 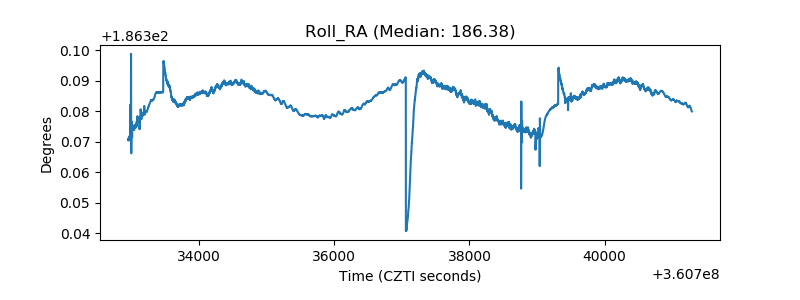 |
| Veto Counter | 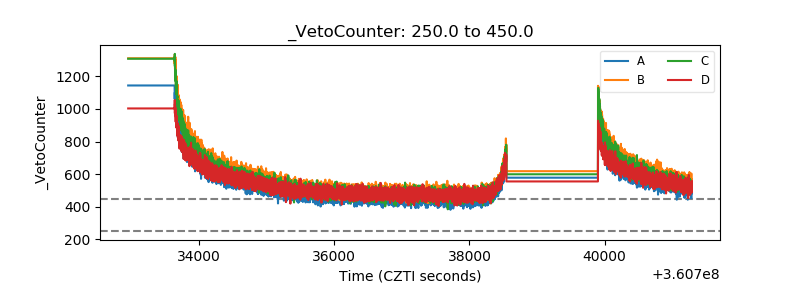 |