| Param | Original file | Final file |
|---|---|---|
| Filename | modeM0/AS1A10_071T12_9000004446_30775cztM0_level2.evt | modeM0/AS1A10_071T12_9000004446_30775cztM0_level2_quad_clean.evt |
| Size (bytes) | 604,241,280 | 74,200,320 |
| Size | 576.2 MB | 70.8 MB |
| Events in quadrant A | 3,473,051 | 472,309 |
| Events in quadrant B | 5,213,487 | 471,432 |
| Events in quadrant C | 4,279,385 | 440,167 |
| Events in quadrant D | 4,909,271 | 424,635 |
| Mode SS | |||
|---|---|---|---|
| Quadrant | BADHDUFLAG | Total packets | Discarded packets |
| A | 0 | 128 | 0 |
| B | 0 | 128 | 0 |
| C | 0 | 128 | 0 |
| D | 0 | 128 | 0 |
| Mode M9 | |||
|---|---|---|---|
| Quadrant | BADHDUFLAG | Total packets | Discarded packets |
| A | 0 | 14 | 0 |
| B | 0 | 15 | 0 |
| C | 0 | 15 | 0 |
| D | 0 | 15 | 0 |
| Mode M0 | |||
|---|---|---|---|
| Quadrant | BADHDUFLAG | Total packets | Discarded packets |
| A | 0 | 13863 | 2 |
| B | 0 | 19453 | 2 |
| C | 0 | 16756 | 2 |
| D | 0 | 18806 | 2 |
| Quadrant | Total seconds | Saturated seconds | Saturation percentage |
|---|---|---|---|
| A | 6276 | 84 | 1.338432% |
| B | 6276 | 172 | 2.740599% |
| C | 6276 | 339 | 5.401530% |
| D | 6276 | 228 | 3.632887% |
Noise dominated data is calculated using 1-second bins in cleaned event files. If a bin has >2000 counts, and if more than 50% of those come from <1% of pixels, then it is considered to be noise-dominated and hence unusable.
| Quadrant | # 1 sec bins | Bins with >0 counts | Bins with >2000 counts | High rate bins dominated by noise | Noise dominated (total time) | Noise dominated (detector-on time) | Marked lightcurve |
|---|---|---|---|---|---|---|---|
| A | 7561 | 6276 | 0 | 0 | 0.00% | 0.00% | 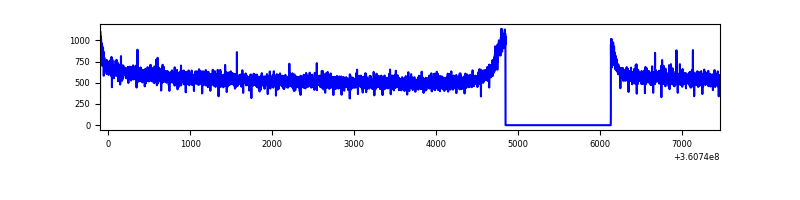 |
| B | 7561 | 6276 | 2 | 2 | 0.03% | 0.03% | 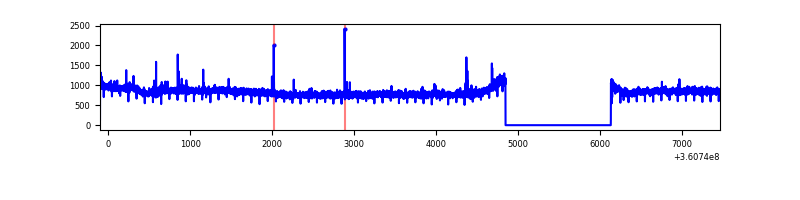 |
| C | 7561 | 6276 | 149 | 149 | 1.97% | 2.37% | 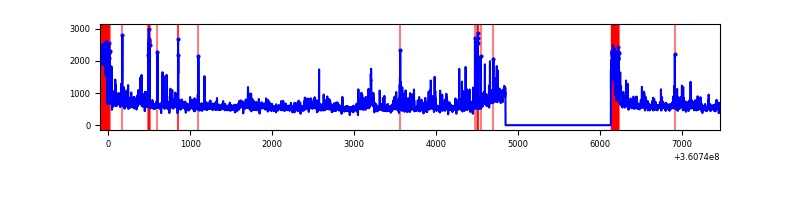 |
| D | 7561 | 6276 | 208 | 208 | 2.75% | 3.31% | 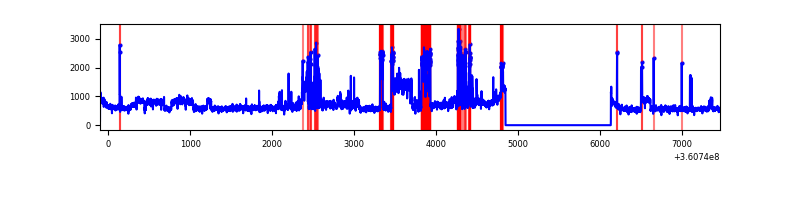 |
Top three noisy pixels from each quadrant. If the there are fewer than three noisy pixels in the level2.evt file, extra rows are filled as -1
| Pixel properties | Quadrant properties | ||||||
|---|---|---|---|---|---|---|---|
| Quadrant | DetID | PixID | Counts | Sigma | Mean | Median | Sigma |
| A | 13 | 254 | 10686 | 54.85 | 901 | 887 | 178.7 |
| A | 3 | 137 | 8445 | 42.3 | 901 | 887 | 178.7 |
| A | 0 | 226 | 7627 | 37.72 | 901 | 887 | 178.7 |
| B | 6 | 159 | 1700618 | 10220.69 | 886 | 869 | 166.3 |
| B | 12 | 111 | 19839 | 114.07 | 886 | 869 | 166.3 |
| B | 11 | 111 | 18219 | 104.33 | 886 | 869 | 166.3 |
| C | 0 | 10 | 790177 | 4187.28 | 815 | 821 | 188.5 |
| C | 3 | 233 | 154531 | 815.38 | 815 | 821 | 188.5 |
| C | 14 | 238 | 134615 | 709.73 | 815 | 821 | 188.5 |
| D | 8 | 195 | 1419826 | 6707.05 | 840 | 823 | 211.6 |
| D | 13 | 249 | 146641 | 689.22 | 840 | 823 | 211.6 |
| D | 2 | 250 | 101880 | 477.66 | 840 | 823 | 211.6 |
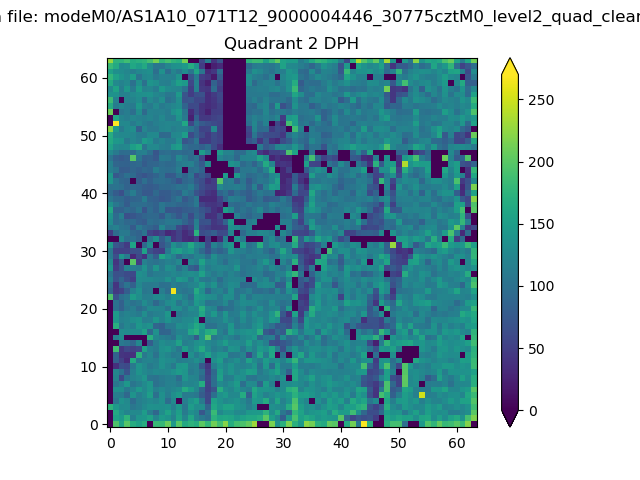
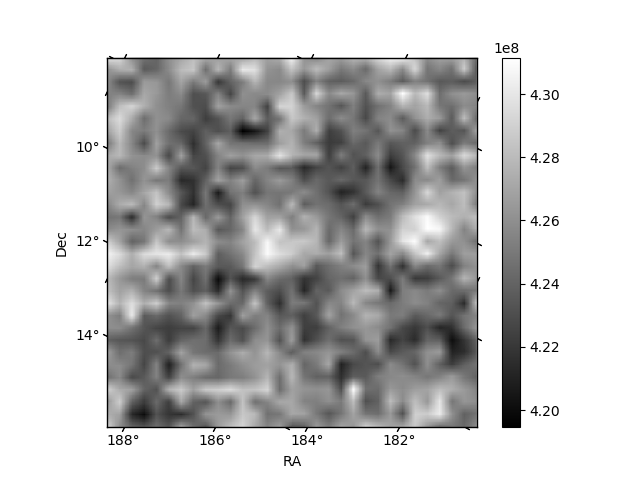
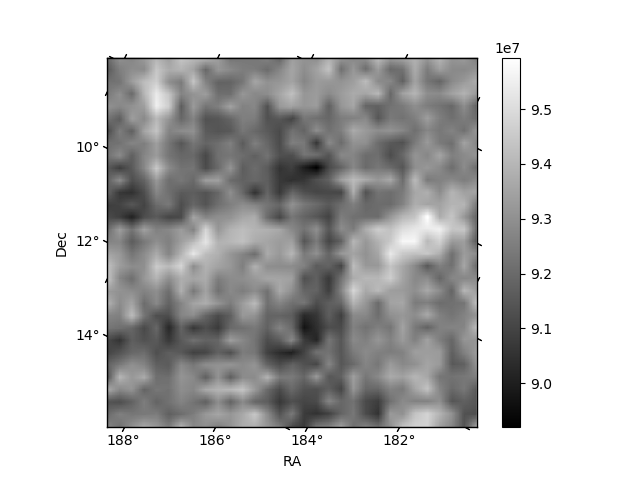
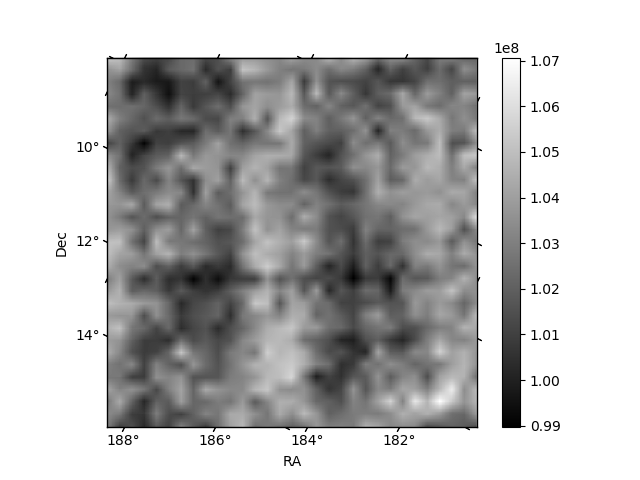
Histogram calculated using DETX and DETY for each event in the final _common_clean file
| Quadrant A | 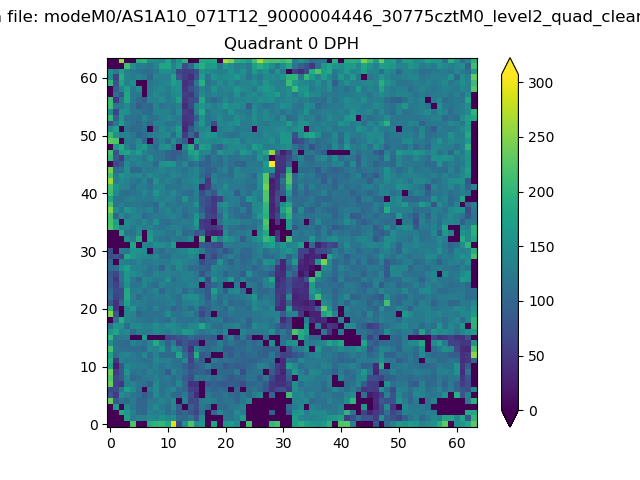 |
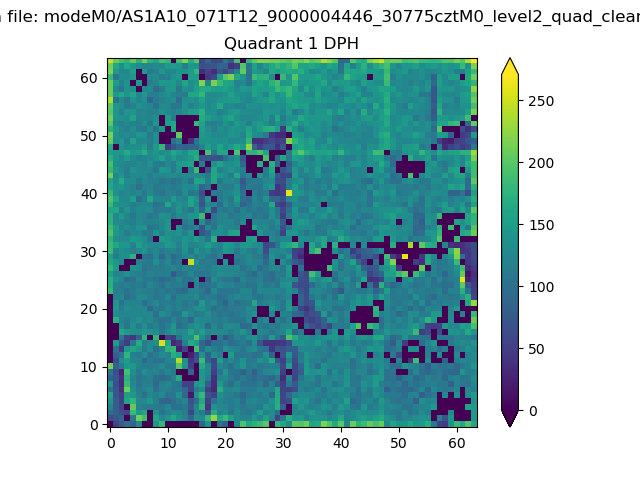 |
Quadrant B |
|---|---|---|---|
| Quadrant D | 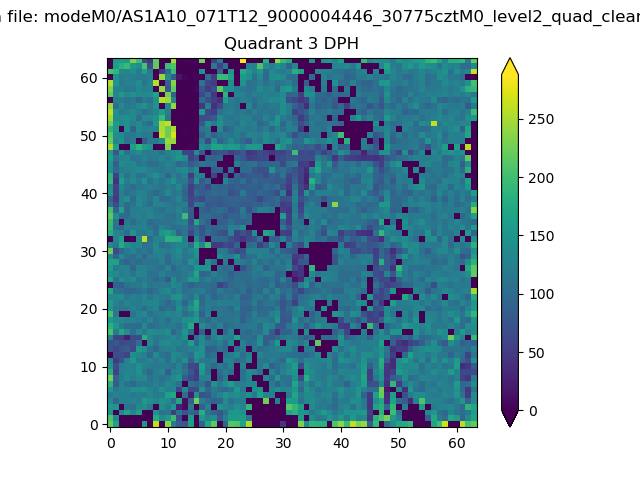 |
 |
Quadrant C |
| Plot type | Count rate plots | Images |
|---|---|---|
| Comparison with Poisson distribution Blue bars denote a histogram of data divided into 1 sec bins. Red curve is a Poisson curve with rate = median count rate of data. |
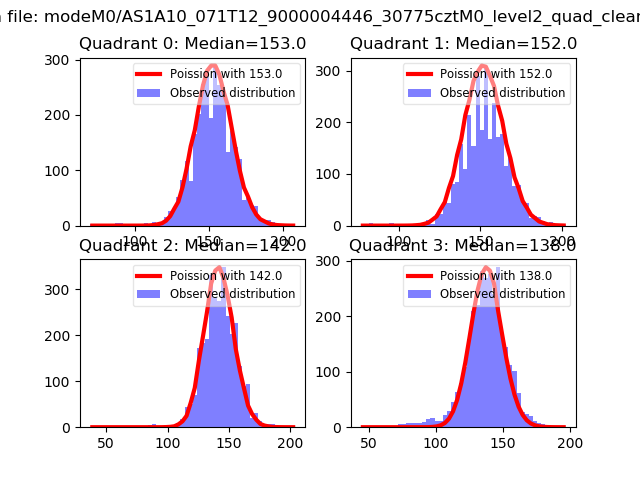 |
 |
| Quadrant-wise count rates Data is divided into 100 sec bins |
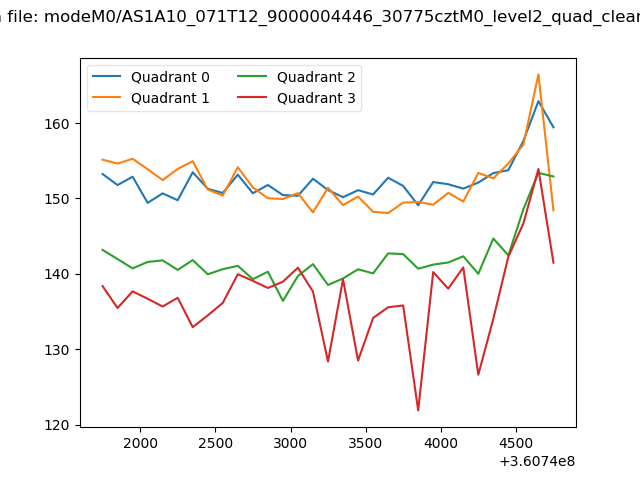 |
|
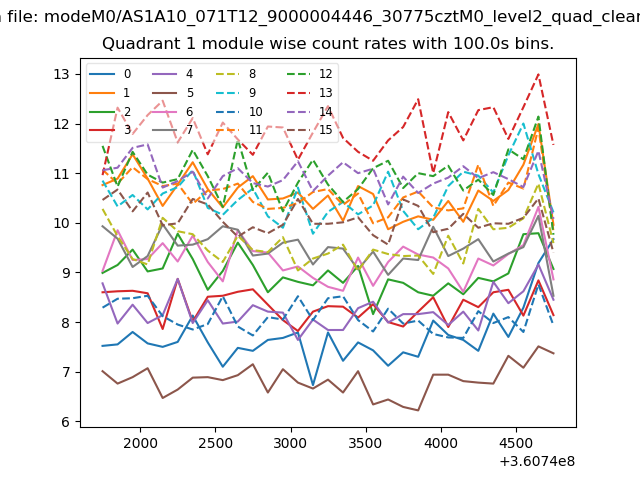
| Module-wise count rates for Quadrant A Data is divided into 100 sec bins |
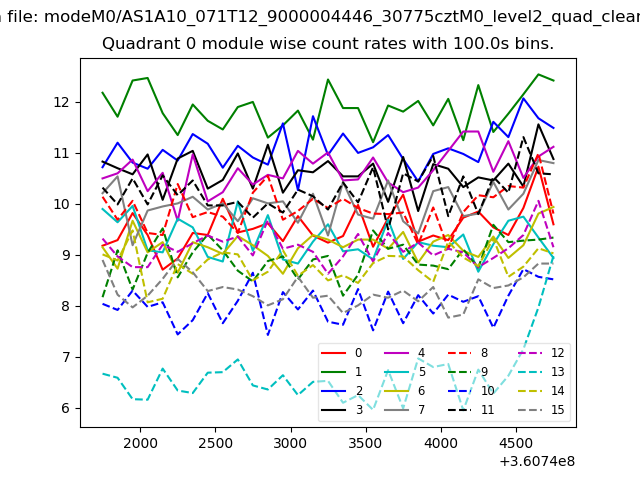 |
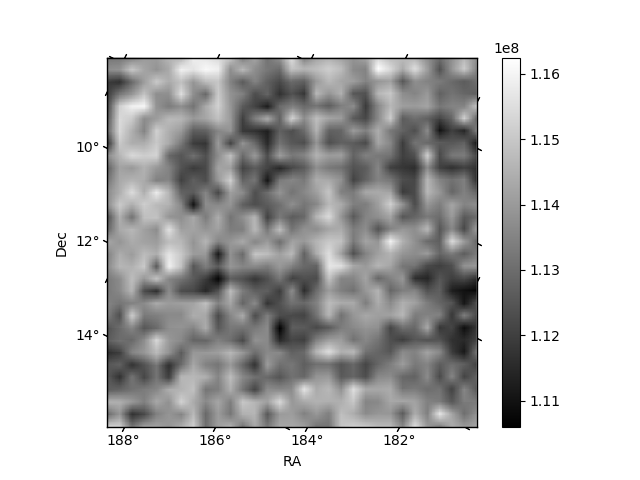 |
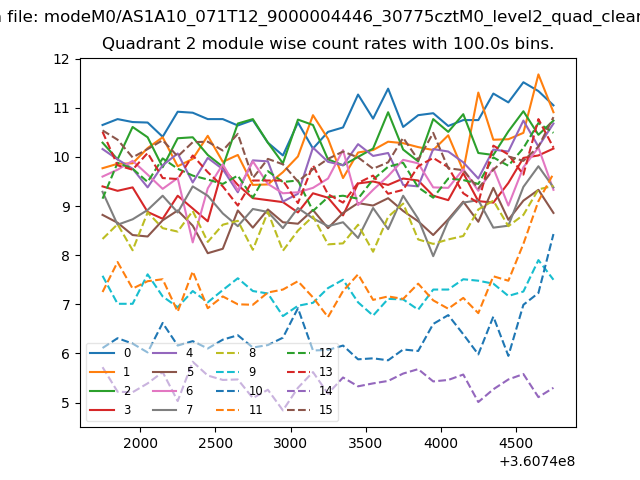
| Module-wise count rates for Quadrant B Data is divided into 100 sec bins |
 |
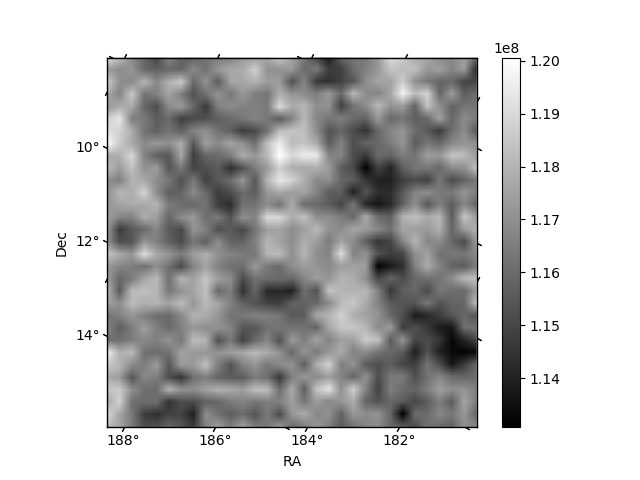 |
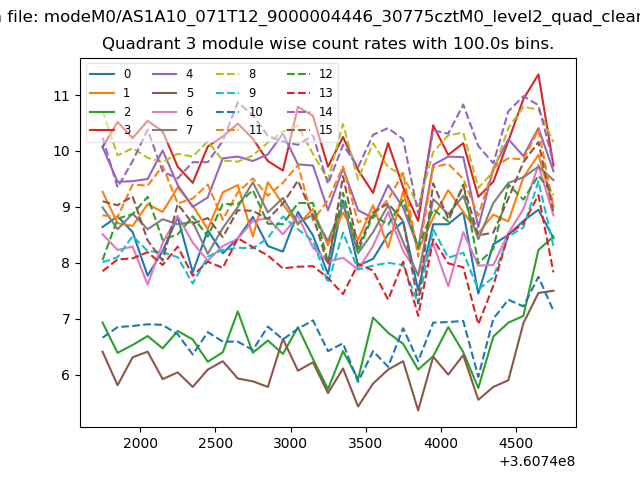
| Module-wise count rates for Quadrant C Data is divided into 100 sec bins |
 |
 |
| Module-wise count rates for Quadrant D Data is divided into 100 sec bins |
 |
 |
| Parameter | Plot |
|---|---|
| CZT HV Monitor | 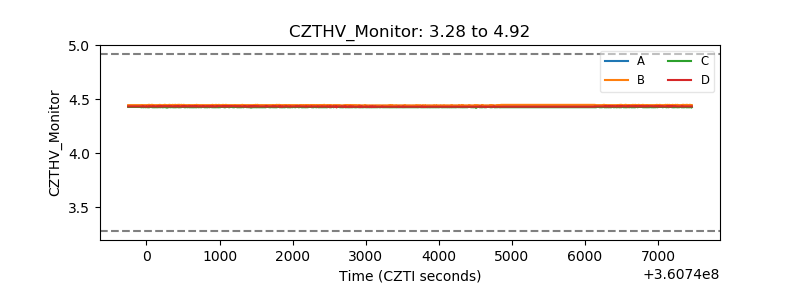 |
| D_VDD | 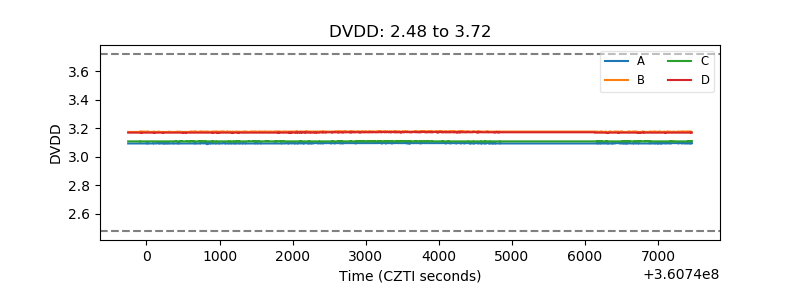 |
| Temperature 1 | 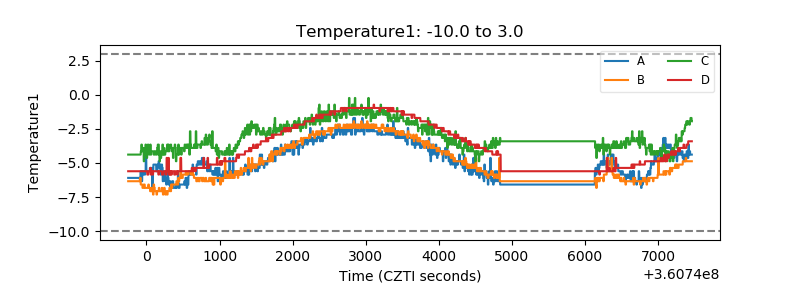 |
| Veto HV Monitor | 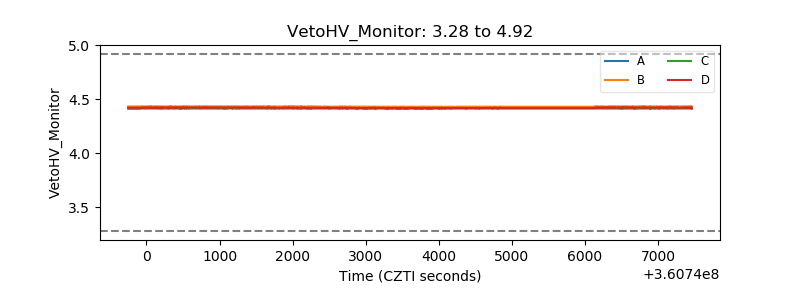 |
| Veto LLD | 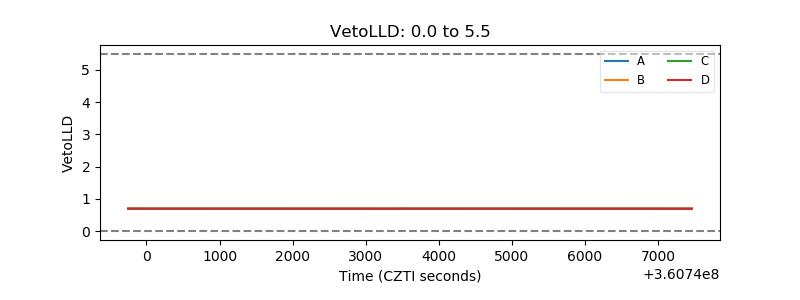 |
| Alpha Counter | 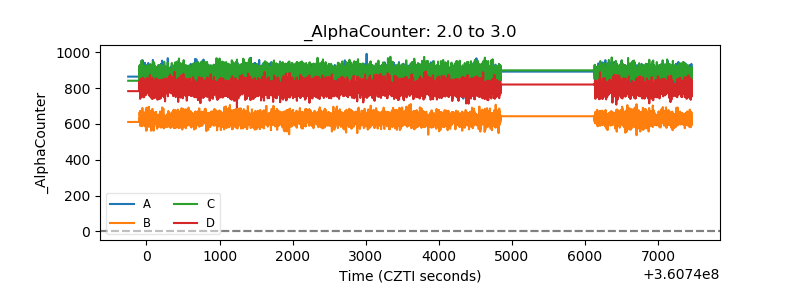 |
| _CPM_Rate | 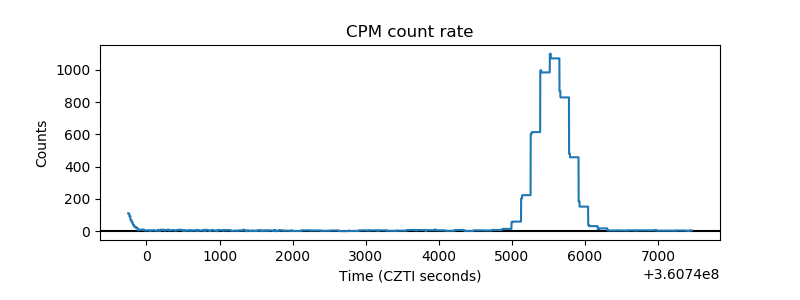 |
| CZT Counter | 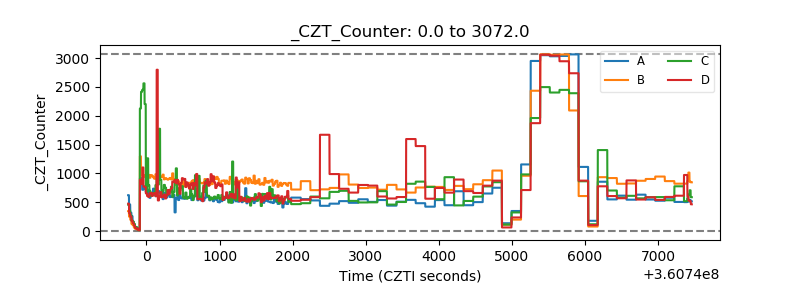 |
| +2.5 Volts monitor |  |
| +5 Volts monitor |  |
| _ROLL_ROT | 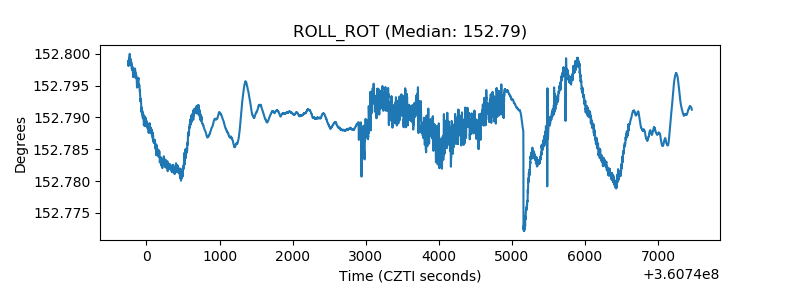 |
| _Roll_DEC | 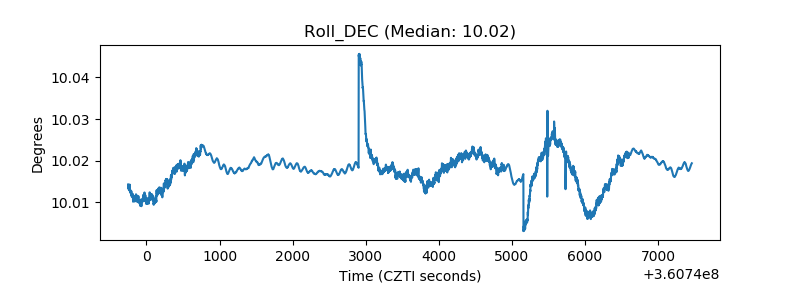 |
| _Roll_RA | 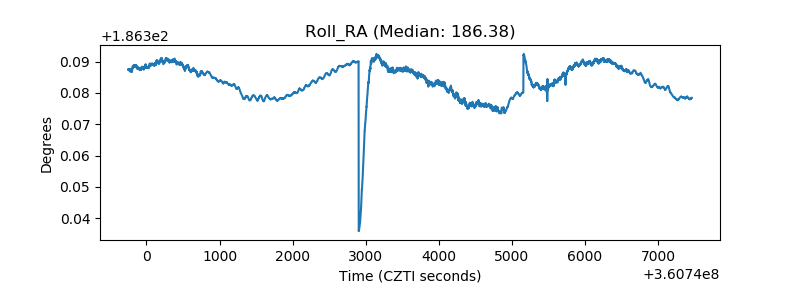 |
| Veto Counter | 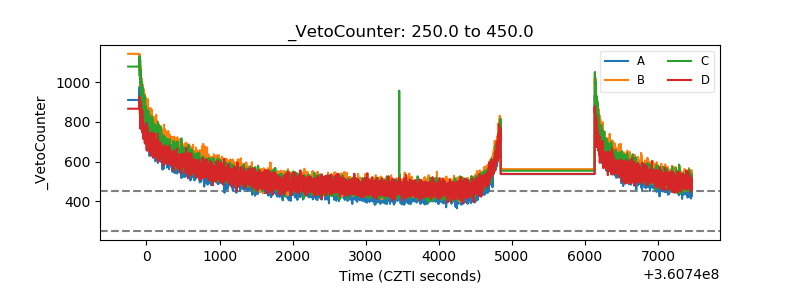 |