| Param | Original file | Final file |
|---|---|---|
| Filename | modeM0/AS1A10_071T12_9000004446_30777cztM0_level2.evt | modeM0/AS1A10_071T12_9000004446_30777cztM0_level2_quad_clean.evt |
| Size (bytes) | 726,192,000 | 92,041,920 |
| Size | 692.6 MB | 87.8 MB |
| Events in quadrant A | 4,672,275 | 584,321 |
| Events in quadrant B | 5,697,965 | 596,715 |
| Events in quadrant C | 4,506,696 | 564,147 |
| Events in quadrant D | 6,629,734 | 540,757 |
| Mode SS | |||
|---|---|---|---|
| Quadrant | BADHDUFLAG | Total packets | Discarded packets |
| A | 0 | 146 | 0 |
| B | 0 | 146 | 0 |
| C | 0 | 146 | 0 |
| D | 0 | 146 | 0 |
| Mode M9 | |||
|---|---|---|---|
| Quadrant | BADHDUFLAG | Total packets | Discarded packets |
| A | 0 | 18 | 0 |
| B | 0 | 18 | 0 |
| C | 0 | 18 | 0 |
| D | 0 | 18 | 0 |
| Mode M0 | |||
|---|---|---|---|
| Quadrant | BADHDUFLAG | Total packets | Discarded packets |
| A | 0 | 18296 | 2 |
| B | 0 | 22084 | 2 |
| C | 0 | 17794 | 2 |
| D | 0 | 24451 | 2 |
| Quadrant | Total seconds | Saturated seconds | Saturation percentage |
|---|---|---|---|
| A | 7204 | 483 | 6.704609% |
| B | 7205 | 348 | 4.829979% |
| C | 7205 | 485 | 6.731437% |
| D | 7204 | 582 | 8.078845% |
Noise dominated data is calculated using 1-second bins in cleaned event files. If a bin has >2000 counts, and if more than 50% of those come from <1% of pixels, then it is considered to be noise-dominated and hence unusable.
| Quadrant | # 1 sec bins | Bins with >0 counts | Bins with >2000 counts | High rate bins dominated by noise | Noise dominated (total time) | Noise dominated (detector-on time) | Marked lightcurve |
|---|---|---|---|---|---|---|---|
| A | 8929 | 7204 | 232 | 232 | 2.60% | 3.22% | 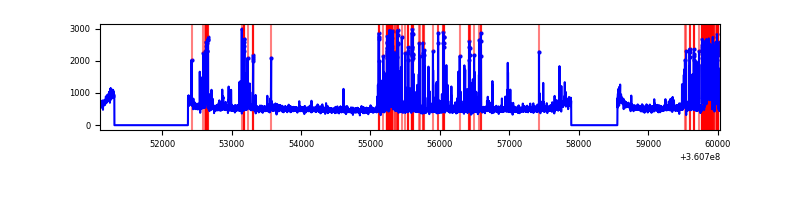 |
| B | 8930 | 7205 | 2 | 2 | 0.02% | 0.03% | 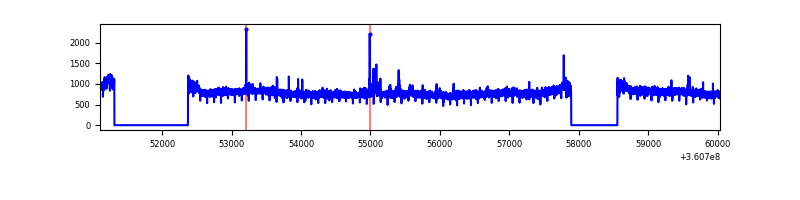 |
| C | 8930 | 7205 | 90 | 90 | 1.01% | 1.25% | 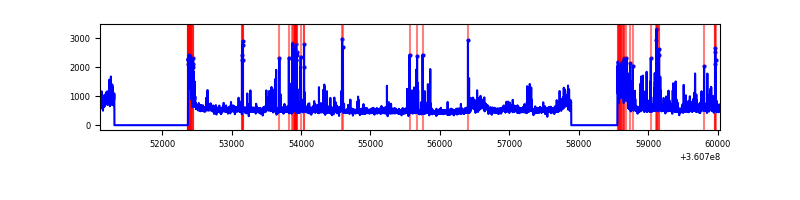 |
| D | 8929 | 7204 | 445 | 445 | 4.98% | 6.18% | 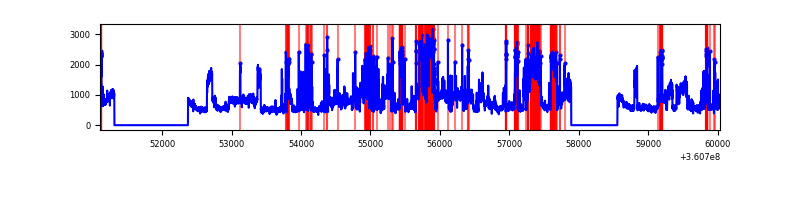 |
Top three noisy pixels from each quadrant. If the there are fewer than three noisy pixels in the level2.evt file, extra rows are filled as -1
| Pixel properties | Quadrant properties | ||||||
|---|---|---|---|---|---|---|---|
| Quadrant | DetID | PixID | Counts | Sigma | Mean | Median | Sigma |
| A | 0 | 13 | 1050073 | 5580.64 | 939 | 922 | 188.0 |
| A | 13 | 254 | 12911 | 63.77 | 939 | 922 | 188.0 |
| A | 3 | 137 | 9280 | 44.46 | 939 | 922 | 188.0 |
| B | 6 | 159 | 1979605 | 11004.33 | 928 | 902 | 179.8 |
| B | 12 | 111 | 22168 | 118.27 | 928 | 902 | 179.8 |
| B | 5 | 172 | 21056 | 112.08 | 928 | 902 | 179.8 |
| C | 0 | 10 | 716416 | 3441.67 | 882 | 887 | 207.9 |
| C | 3 | 233 | 178538 | 854.49 | 882 | 887 | 207.9 |
| C | 14 | 238 | 139906 | 668.67 | 882 | 887 | 207.9 |
| D | 8 | 195 | 1916974 | 8122.53 | 893 | 877 | 235.9 |
| D | 10 | 253 | 642489 | 2719.86 | 893 | 877 | 235.9 |
| D | 13 | 249 | 507826 | 2149.01 | 893 | 877 | 235.9 |
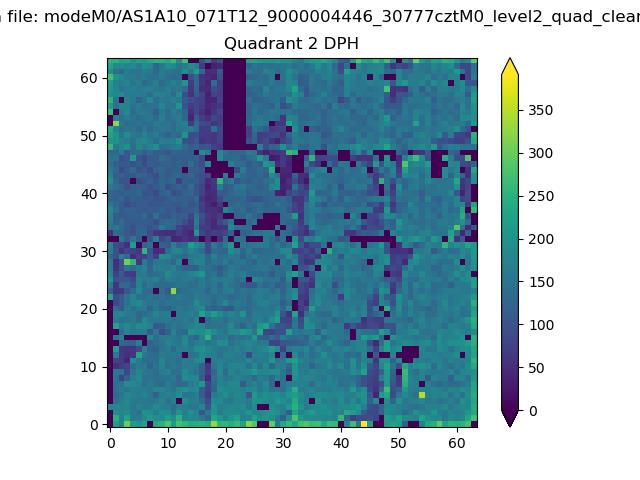
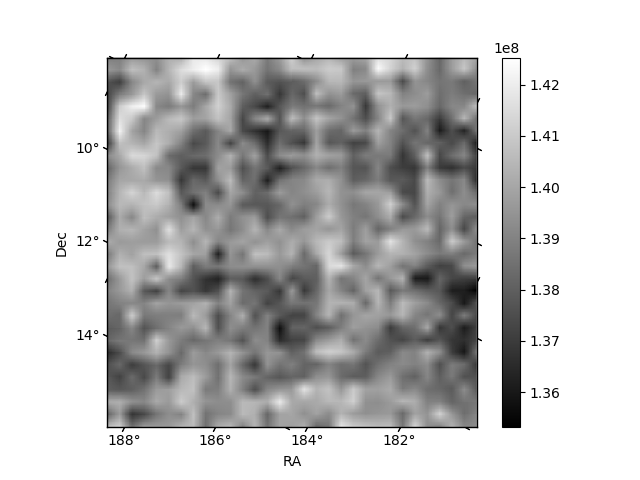
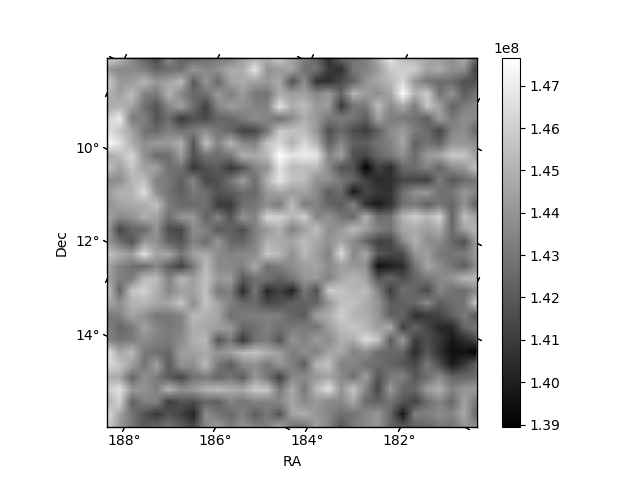
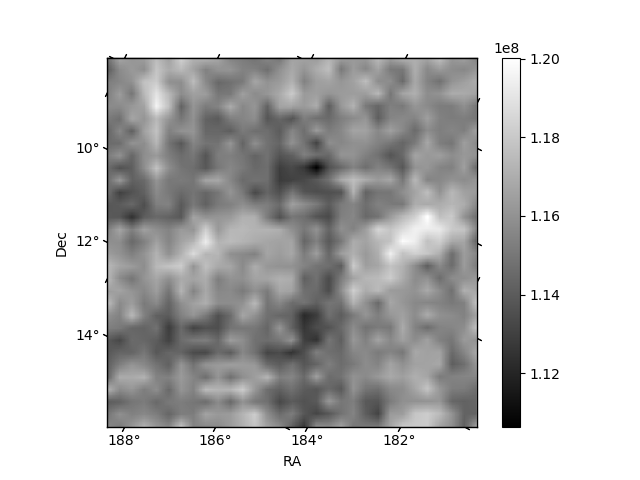
Histogram calculated using DETX and DETY for each event in the final _common_clean file
| Quadrant A | 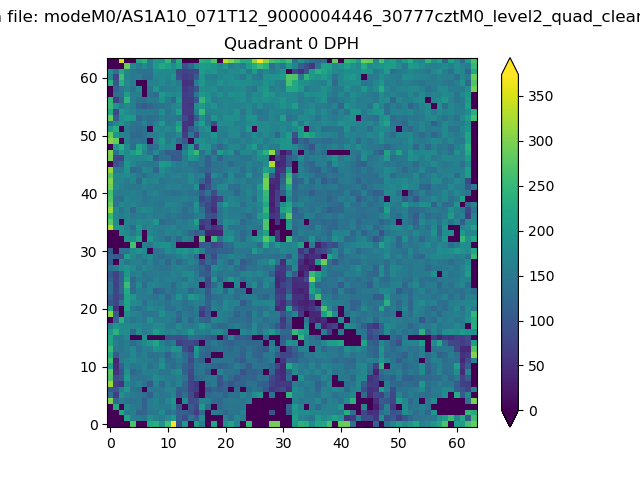 |
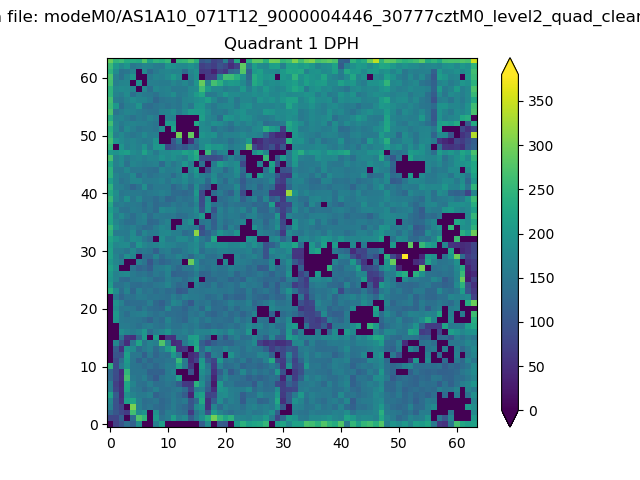 |
Quadrant B |
|---|---|---|---|
| Quadrant D | 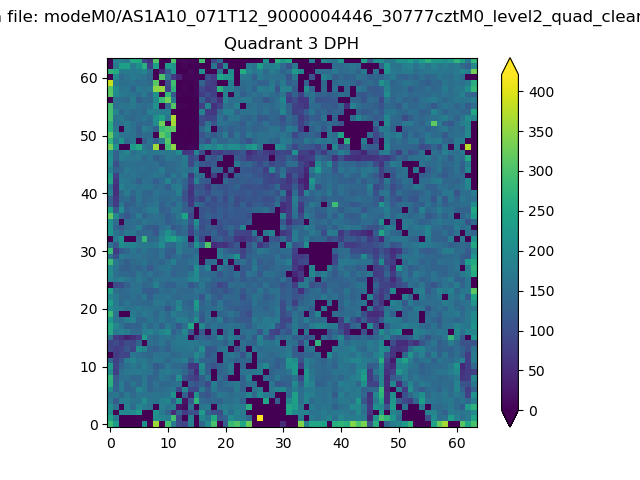 |
 |
Quadrant C |
| Plot type | Count rate plots | Images |
|---|---|---|
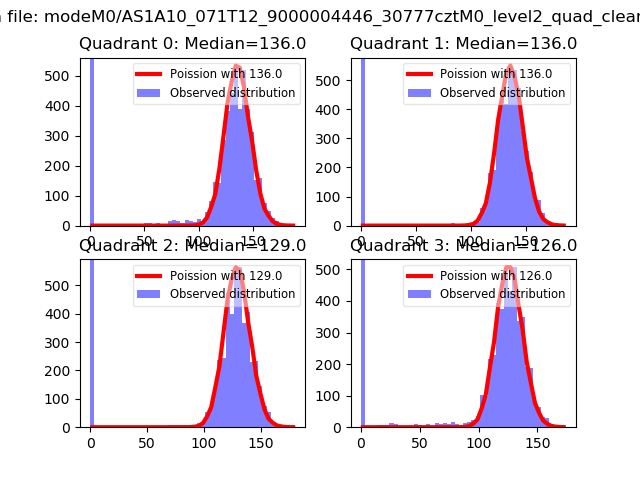
| Comparison with Poisson distribution Blue bars denote a histogram of data divided into 1 sec bins. Red curve is a Poisson curve with rate = median count rate of data. |
 |
 |
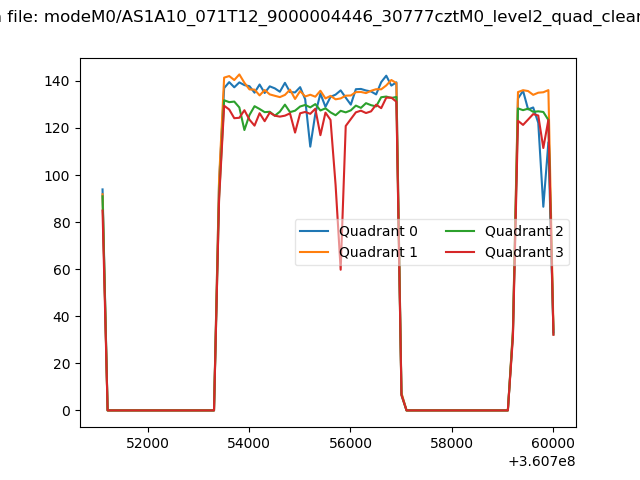
| Quadrant-wise count rates Data is divided into 100 sec bins |
 |
|
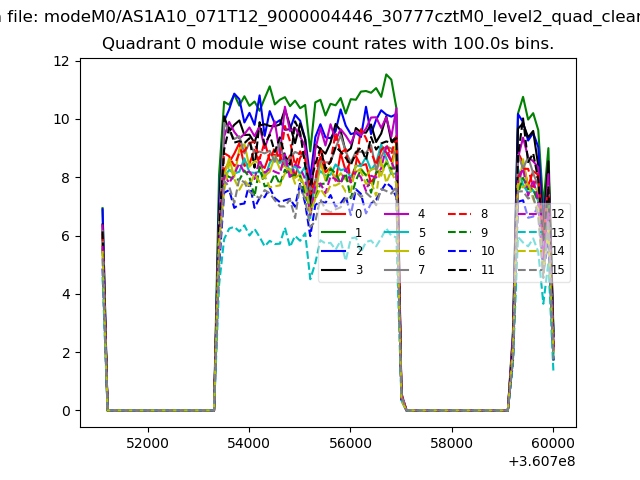
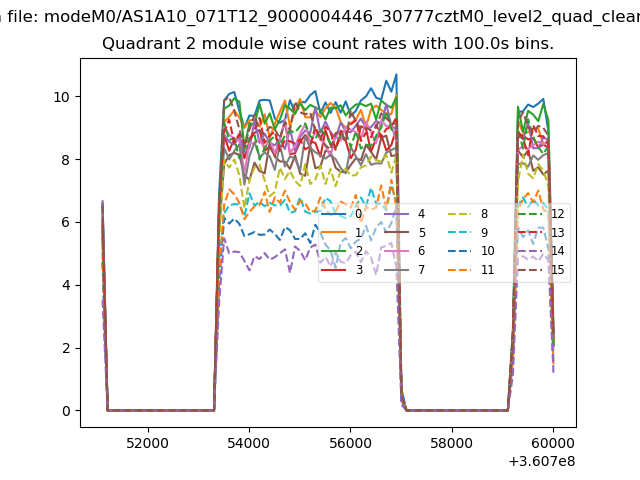
| Module-wise count rates for Quadrant A Data is divided into 100 sec bins |
 |
 |
| Module-wise count rates for Quadrant B Data is divided into 100 sec bins |
 |
 |
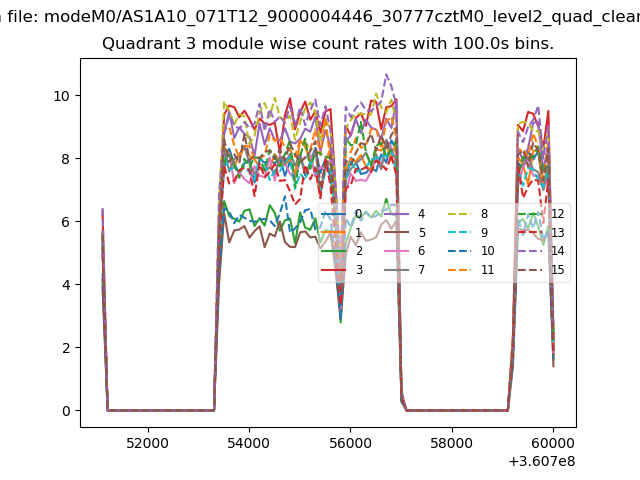
| Module-wise count rates for Quadrant C Data is divided into 100 sec bins |
 |
 |
| Module-wise count rates for Quadrant D Data is divided into 100 sec bins |
 |
 |
| Parameter | Plot |
|---|---|
| CZT HV Monitor | 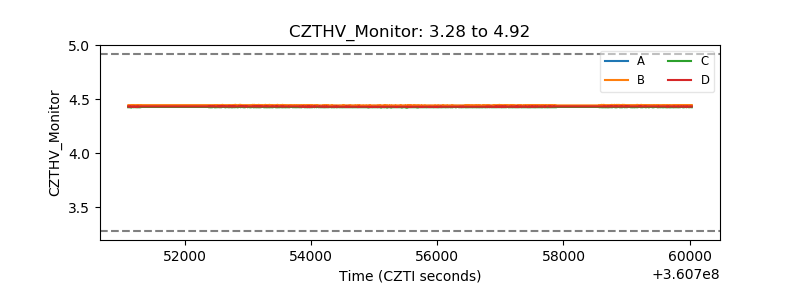 |
| D_VDD | 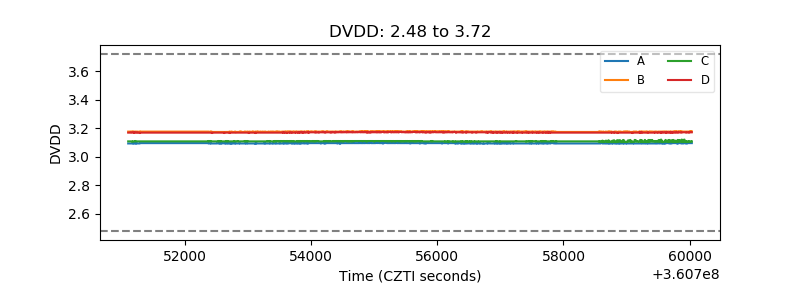 |
| Temperature 1 | 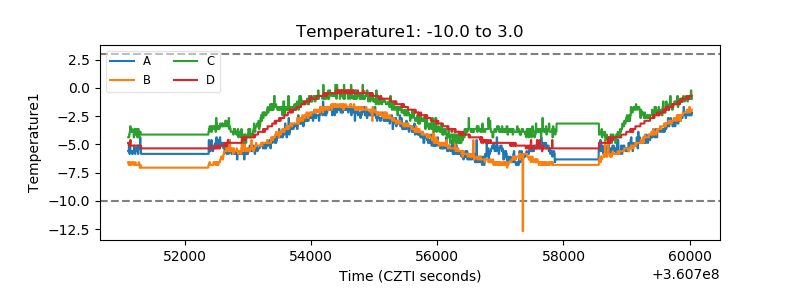 |
| Veto HV Monitor | 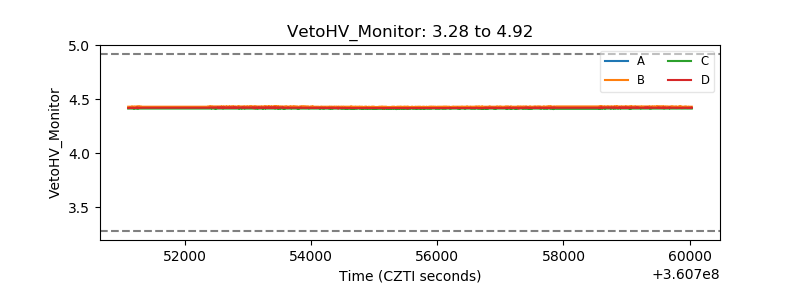 |
| Veto LLD | 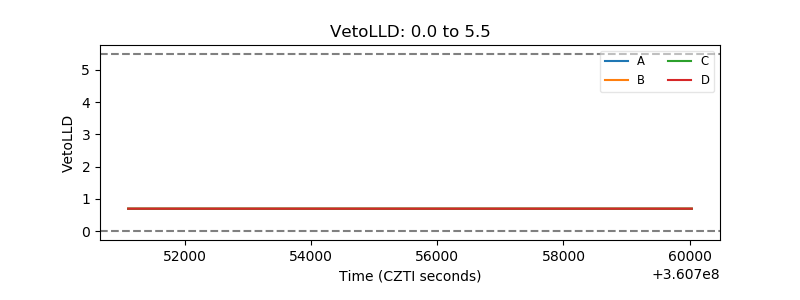 |
| Alpha Counter | 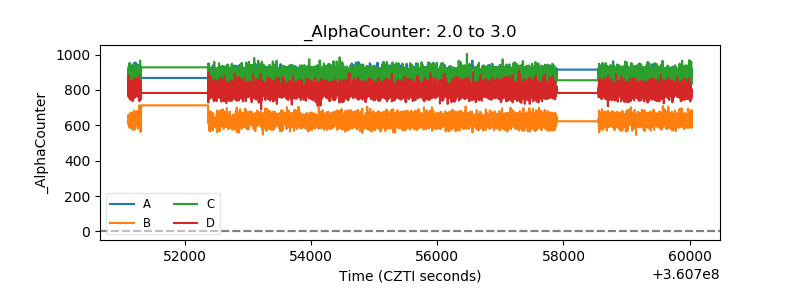 |
| _CPM_Rate | 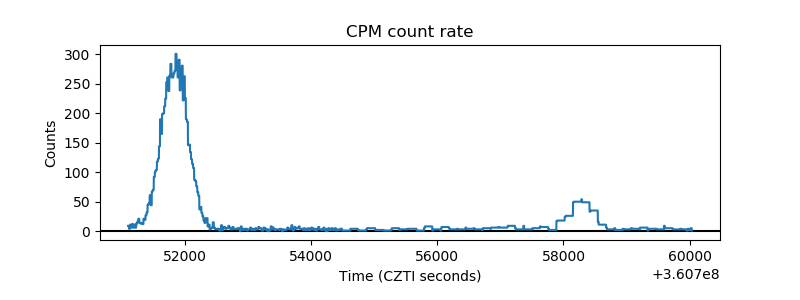 |
| CZT Counter | 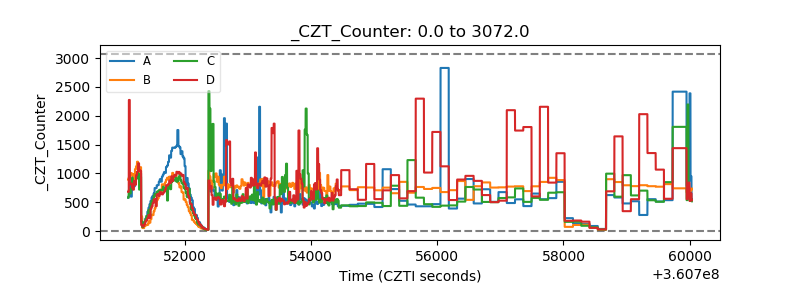 |
| +2.5 Volts monitor | 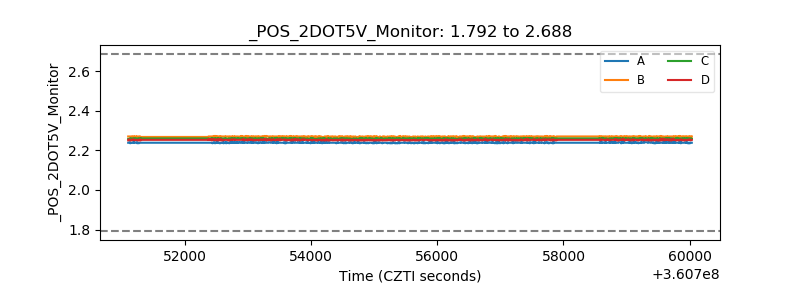 |
| +5 Volts monitor |  |
| _ROLL_ROT |  |
| _Roll_DEC | 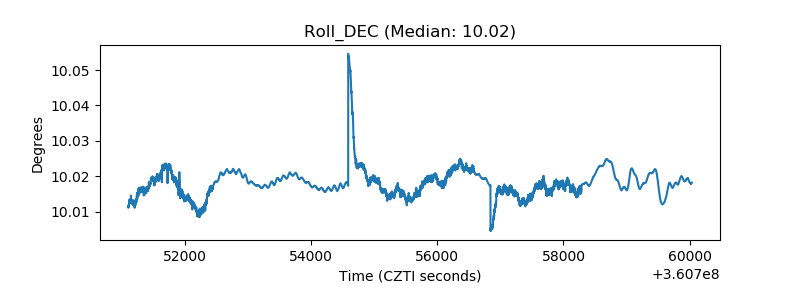 |
| _Roll_RA | 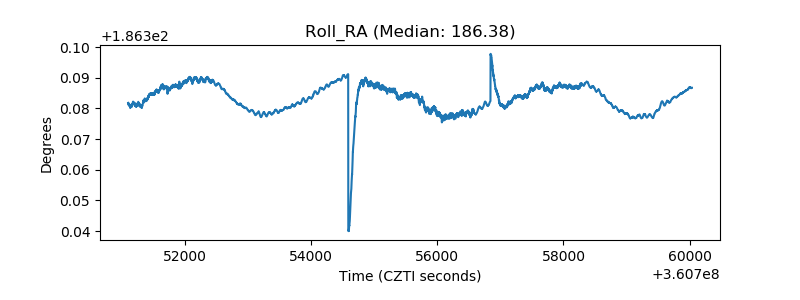 |
| Veto Counter | 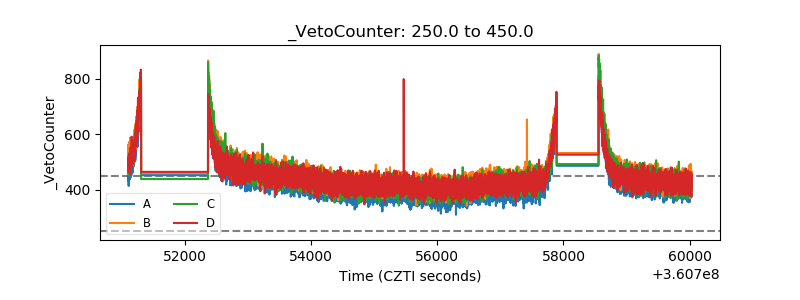 |