| Param | Original file | Final file |
|---|---|---|
| Filename | modeM0/AS1A10_071T18_9000004448cztM0_level2.fits | modeM0/AS1A10_071T18_9000004448cztM0_level2_quad_clean.evt |
| Size (bytes) | 708,122,880 | 535,559,040 |
| Size | 675.3 MB | 510.7 MB |
| Events in quadrant A | 4,517,194 | 3,095,298 |
| Events in quadrant B | 4,237,124 | 3,057,748 |
| Events in quadrant C | 4,228,120 | 2,838,057 |
| Events in quadrant D | 3,645,296 | 2,410,460 |
| Mode SS | |||
|---|---|---|---|
| Quadrant | BADHDUFLAG | Total packets | Discarded packets |
| A | 0 | 1426 | 0 |
| B | 0 | 1426 | 0 |
| C | 0 | 1426 | 0 |
| D | 0 | 1426 | 0 |
| Mode M9 | |||
|---|---|---|---|
| Quadrant | BADHDUFLAG | Total packets | Discarded packets |
| A | 0 | 116 | 0 |
| B | 0 | 116 | 0 |
| C | 0 | 116 | 0 |
| D | 0 | 116 | 0 |
| Mode M0 | |||
|---|---|---|---|
| Quadrant | BADHDUFLAG | Total packets | Discarded packets |
| A | 0 | 155252 | 0 |
| B | 0 | 214439 | 0 |
| C | 0 | 176228 | 0 |
| D | 0 | 267089 | 0 |
| Quadrant | Total seconds | Saturated seconds | Saturation percentage |
|---|---|---|---|
| A | 70226 | 1353 | 1.926637% |
| B | 70226 | 1655 | 2.356677% |
| C | 70226 | 2768 | 3.941560% |
| D | 70226 | 5689 | 8.100988% |
Noise dominated data is calculated using 1-second bins in cleaned event files. If a bin has >2000 counts, and if more than 50% of those come from <1% of pixels, then it is considered to be noise-dominated and hence unusable.
| Quadrant | # 1 sec bins | Bins with >0 counts | Bins with >2000 counts | High rate bins dominated by noise | Noise dominated (total time) | Noise dominated (detector-on time) | Marked lightcurve |
|---|---|---|---|---|---|---|---|
| A | 81641 | 70196 | 0 | 0 | 0.00% | 0.00% | 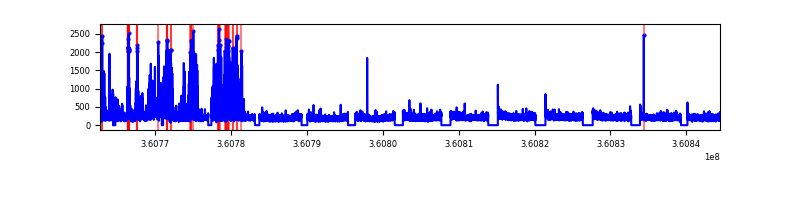 |
| B | 81641 | 70213 | 0 | 0 | 0.00% | 0.00% |  |
| C | 81641 | 70214 | 0 | 0 | 0.00% | 0.00% |  |
| D | 81641 | 70208 | 0 | 0 | 0.00% | 0.00% | 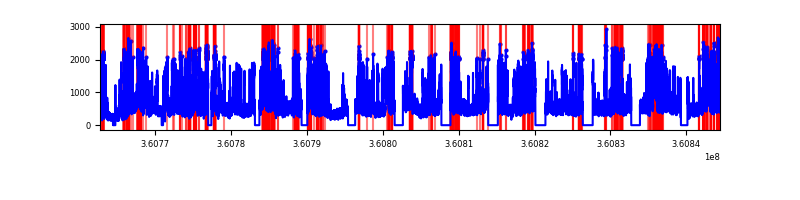 |
Top three noisy pixels from each quadrant. If the there are fewer than three noisy pixels in the level2.evt file, extra rows are filled as -1
| Pixel properties | Quadrant properties | ||||||
|---|---|---|---|---|---|---|---|
| Quadrant | DetID | PixID | Counts | Sigma | Mean | Median | Sigma |
| A | 0 | 29 | 3672 | 8.98 | 1177 | 1107 | 285.7 |
| A | 7 | 110 | 3570 | 8.62 | 1177 | 1107 | 285.7 |
| A | 9 | 19 | 3218 | 7.39 | 1177 | 1107 | 285.7 |
| B | 2 | 9 | 3282 | 10.04 | 1120 | 1071 | 220.1 |
| B | 5 | 232 | 2908 | 8.34 | 1120 | 1071 | 220.1 |
| B | 3 | 80 | 2811 | 7.9 | 1120 | 1071 | 220.1 |
| C | 3 | 202 | 3211 | 7.57 | 1118 | 1045 | 286.1 |
| C | 3 | 203 | 3050 | 7.01 | 1118 | 1045 | 286.1 |
| C | 12 | 241 | 2916 | 6.54 | 1118 | 1045 | 286.1 |
| D | 15 | 46 | 2775 | 6.54 | 1041 | 947 | 279.6 |
| D | 6 | 67 | 2587 | 5.86 | 1041 | 947 | 279.6 |
| D | 7 | 3 | 2538 | 5.69 | 1041 | 947 | 279.6 |
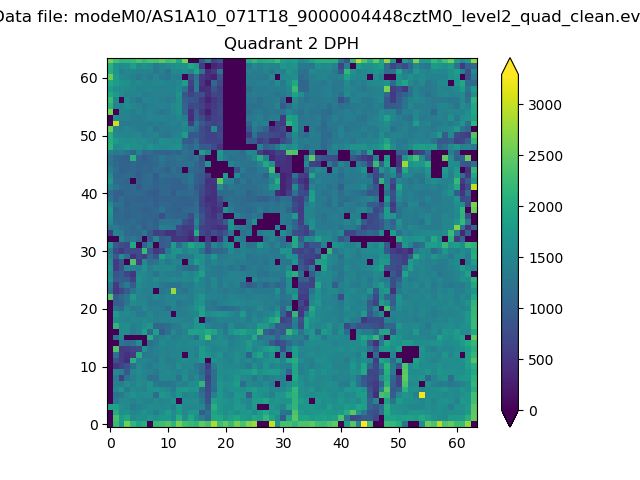
Histogram calculated using DETX and DETY for each event in the final _common_clean file
| Quadrant A | 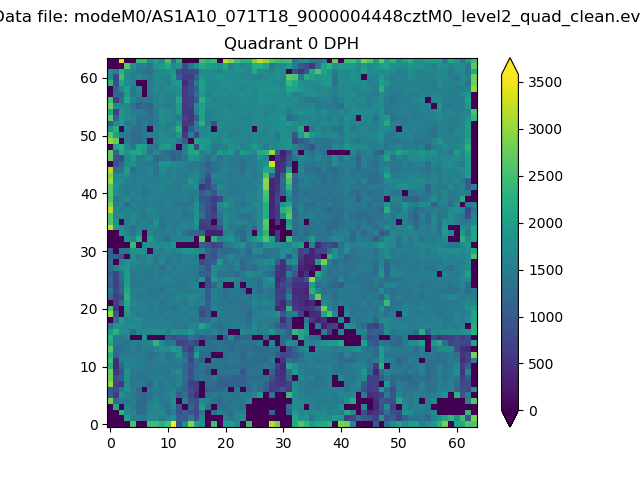 |
 |
Quadrant B |
|---|---|---|---|
| Quadrant D | 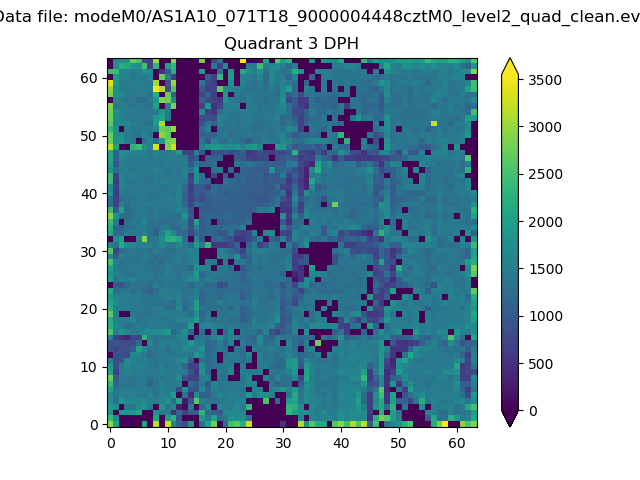 |
 |
Quadrant C |
| Plot type | Count rate plots | Images |
|---|---|---|
| Comparison with Poisson distribution Blue bars denote a histogram of data divided into 1 sec bins. Red curve is a Poisson curve with rate = median count rate of data. |
 |
 |
| Quadrant-wise count rates Data is divided into 100 sec bins |
 |
|
| Module-wise count rates for Quadrant A Data is divided into 100 sec bins |
 |
 |
| Module-wise count rates for Quadrant B Data is divided into 100 sec bins |
 |
 |
| Module-wise count rates for Quadrant C Data is divided into 100 sec bins |
 |
 |
| Module-wise count rates for Quadrant D Data is divided into 100 sec bins |
 |
 |
| Parameter | Plot |
|---|---|
| CZT HV Monitor | 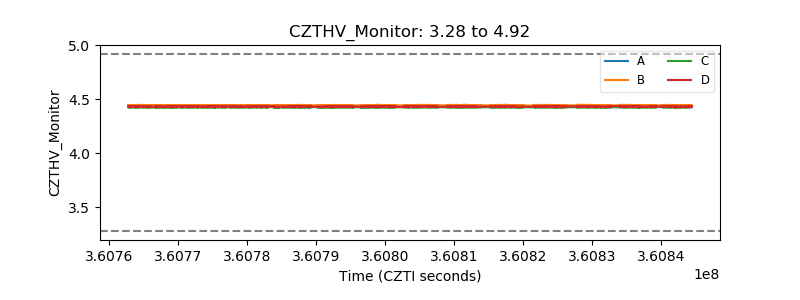 |
| D_VDD | 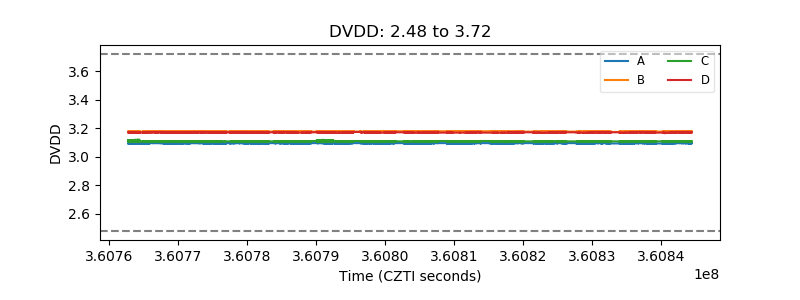 |
| Temperature 1 |  |
| Veto HV Monitor |  |
| Veto LLD | 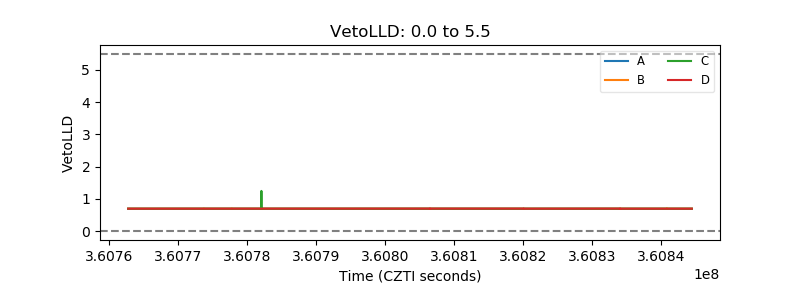 |
| Alpha Counter |  |
| _CPM_Rate | 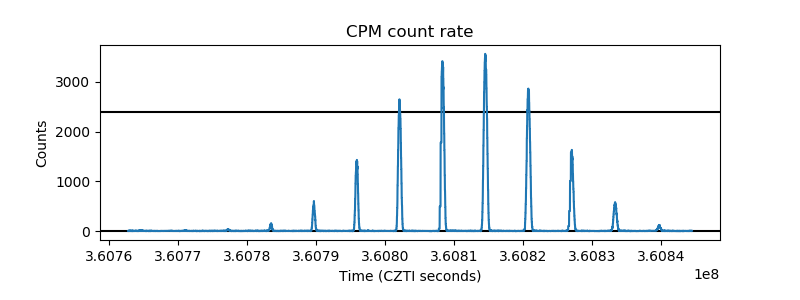 |
| CZT Counter |  |
| +2.5 Volts monitor |  |
| +5 Volts monitor |  |
| _ROLL_ROT |  |
| _Roll_DEC |  |
| _Roll_RA |  |
| Veto Counter | 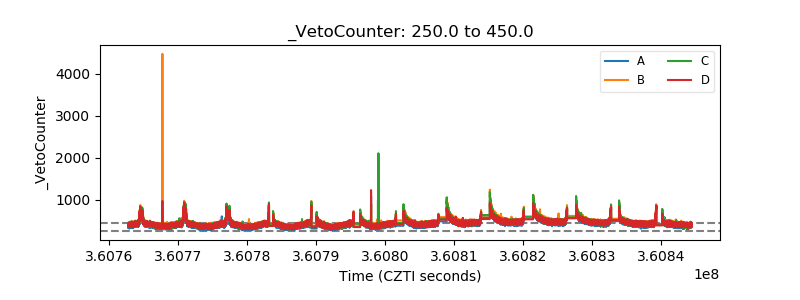 |