| Param | Original file | Final file |
|---|---|---|
| Filename | modeM0/AS1A10_071T18_9000004448_30778cztM0_level2.evt | modeM0/AS1A10_071T18_9000004448_30778cztM0_level2_quad_clean.evt |
| Size (bytes) | 316,756,800 | 30,985,920 |
| Size | 302.1 MB | 29.6 MB |
| Events in quadrant A | 1,896,508 | 181,095 |
| Events in quadrant B | 2,701,207 | 182,448 |
| Events in quadrant C | 2,055,169 | 172,214 |
| Events in quadrant D | 2,711,488 | 164,011 |
| Mode SS | |||
|---|---|---|---|
| Quadrant | BADHDUFLAG | Total packets | Discarded packets |
| A | 0 | 68 | 0 |
| B | 0 | 68 | 0 |
| C | 0 | 68 | 0 |
| D | 0 | 68 | 0 |
| Mode M9 | |||
|---|---|---|---|
| Quadrant | BADHDUFLAG | Total packets | Discarded packets |
| A | 0 | 3 | 0 |
| B | 0 | 3 | 0 |
| C | 0 | 3 | 0 |
| D | 0 | 3 | 0 |
| Mode M0 | |||
|---|---|---|---|
| Quadrant | BADHDUFLAG | Total packets | Discarded packets |
| A | 0 | 7641 | 1 |
| B | 0 | 10345 | 1 |
| C | 0 | 8142 | 1 |
| D | 0 | 10263 | 1 |
| Quadrant | Total seconds | Saturated seconds | Saturation percentage |
|---|---|---|---|
| A | 3354 | 174 | 5.187835% |
| B | 3354 | 251 | 7.483602% |
| C | 3354 | 218 | 6.499702% |
| D | 3354 | 298 | 8.884914% |
Noise dominated data is calculated using 1-second bins in cleaned event files. If a bin has >2000 counts, and if more than 50% of those come from <1% of pixels, then it is considered to be noise-dominated and hence unusable.
| Quadrant | # 1 sec bins | Bins with >0 counts | Bins with >2000 counts | High rate bins dominated by noise | Noise dominated (total time) | Noise dominated (detector-on time) | Marked lightcurve |
|---|---|---|---|---|---|---|---|
| A | 3639 | 3354 | 11 | 11 | 0.30% | 0.33% | 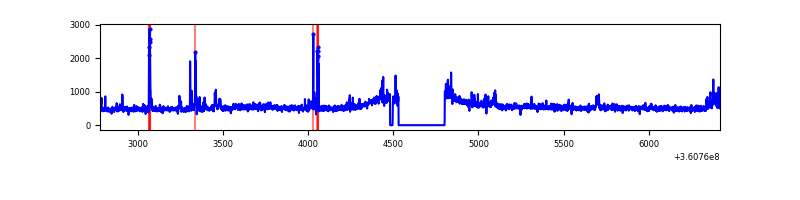 |
| B | 3639 | 3354 | 1 | 1 | 0.03% | 0.03% | 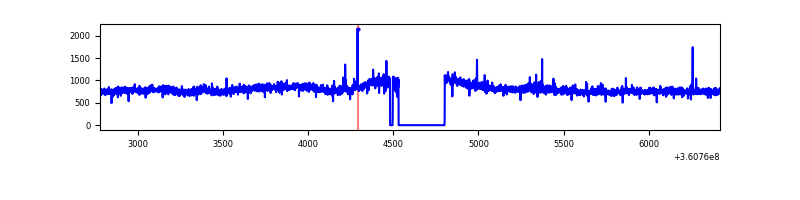 |
| C | 3639 | 3355 | 15 | 15 | 0.41% | 0.45% | 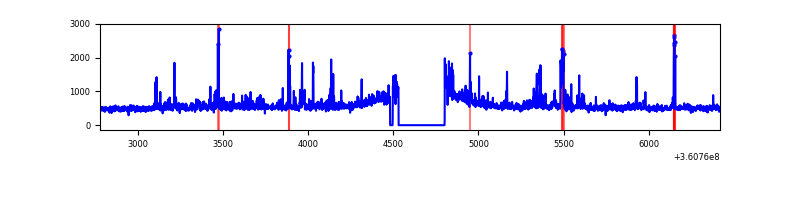 |
| D | 3639 | 3355 | 249 | 249 | 6.84% | 7.42% | 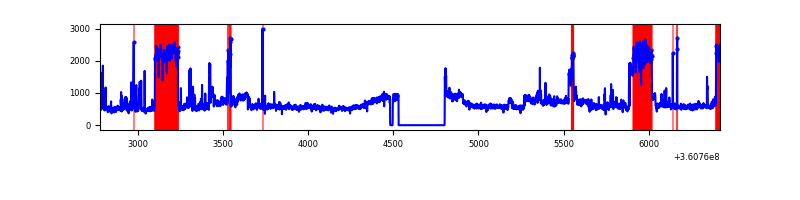 |
Top three noisy pixels from each quadrant. If the there are fewer than three noisy pixels in the level2.evt file, extra rows are filled as -1
| Pixel properties | Quadrant properties | ||||||
|---|---|---|---|---|---|---|---|
| Quadrant | DetID | PixID | Counts | Sigma | Mean | Median | Sigma |
| A | 0 | 13 | 146449 | 1548.13 | 453 | 443 | 94.3 |
| A | 13 | 254 | 5727 | 56.03 | 453 | 443 | 94.3 |
| A | 3 | 137 | 5025 | 48.58 | 453 | 443 | 94.3 |
| B | 6 | 159 | 911121 | 10194.68 | 446 | 433 | 89.3 |
| B | 0 | 190 | 14380 | 156.13 | 446 | 433 | 89.3 |
| B | 0 | 230 | 14028 | 152.19 | 446 | 433 | 89.3 |
| C | 0 | 10 | 254622 | 2468.22 | 429 | 431 | 103.0 |
| C | 14 | 238 | 67556 | 651.79 | 429 | 431 | 103.0 |
| C | 3 | 233 | 49733 | 478.73 | 429 | 431 | 103.0 |
| D | 8 | 195 | 912960 | 7795.81 | 434 | 424 | 117.1 |
| D | 13 | 249 | 60203 | 510.69 | 434 | 424 | 117.1 |
| D | 12 | 233 | 25405 | 213.41 | 434 | 424 | 117.1 |
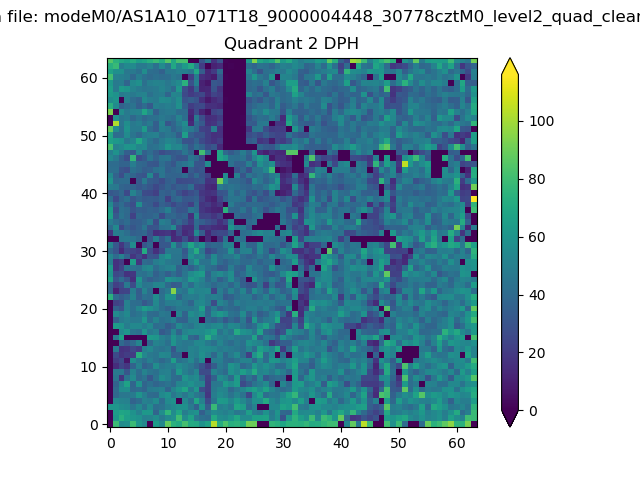
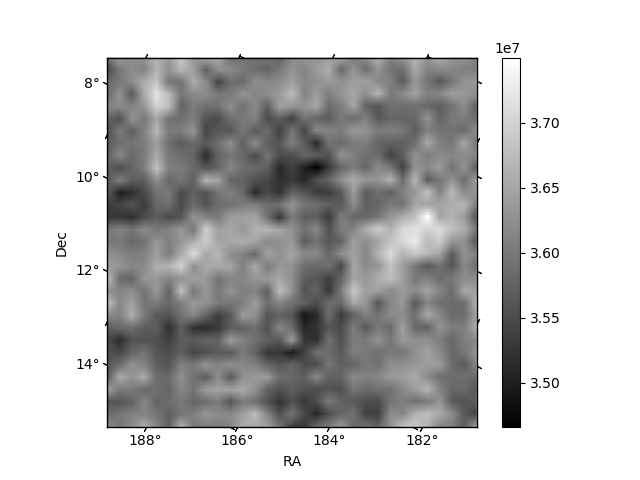
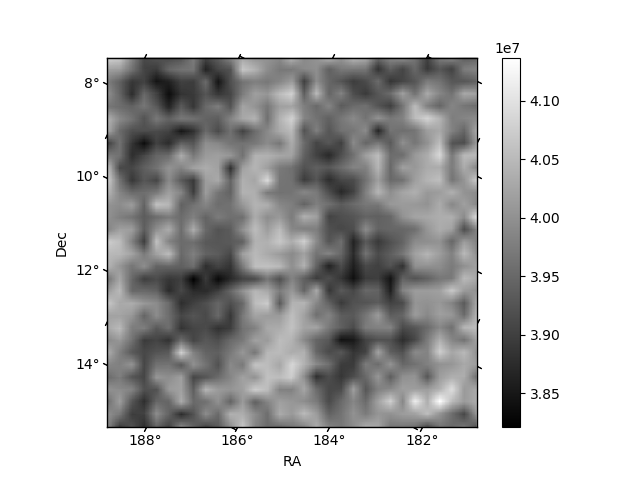
Histogram calculated using DETX and DETY for each event in the final _common_clean file
| Quadrant A | 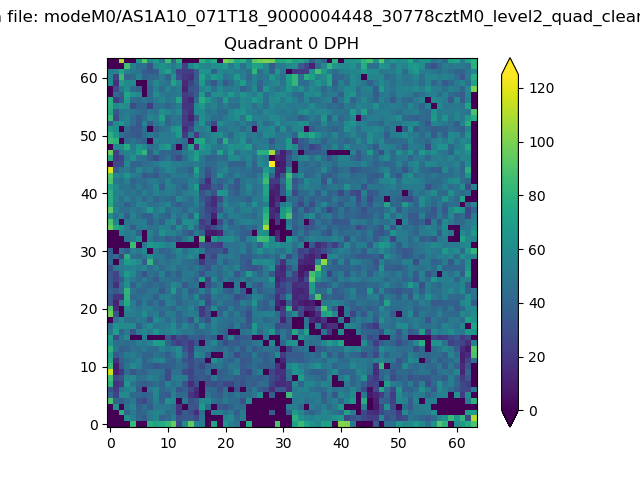 |
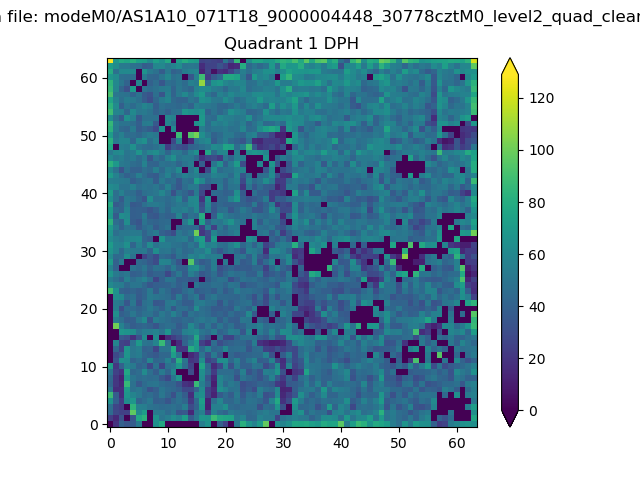 |
Quadrant B |
|---|---|---|---|
| Quadrant D | 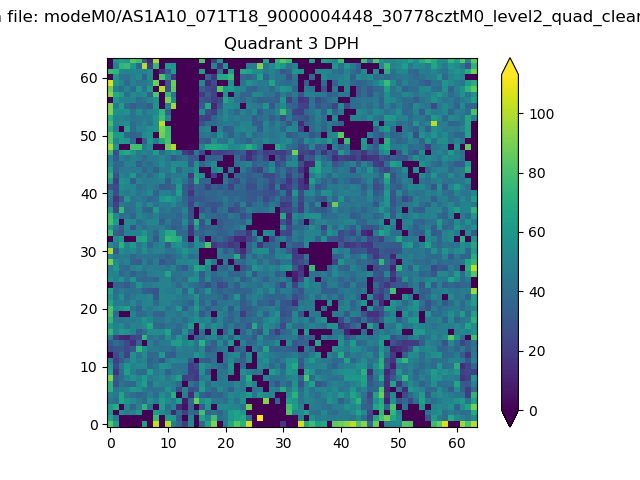 |
 |
Quadrant C |
| Plot type | Count rate plots | Images |
|---|---|---|
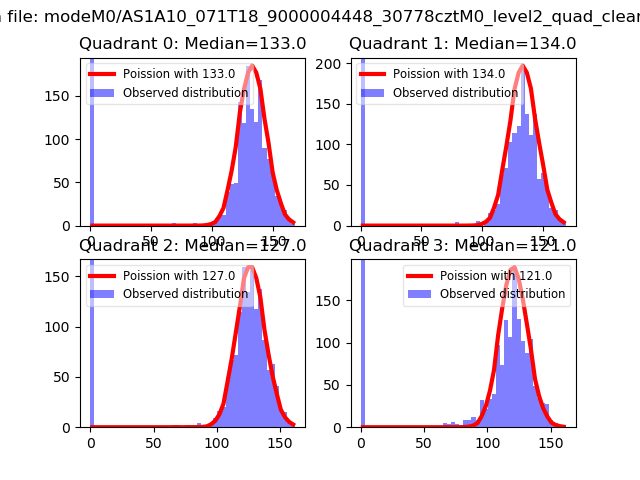
| Comparison with Poisson distribution Blue bars denote a histogram of data divided into 1 sec bins. Red curve is a Poisson curve with rate = median count rate of data. |
 |
 |
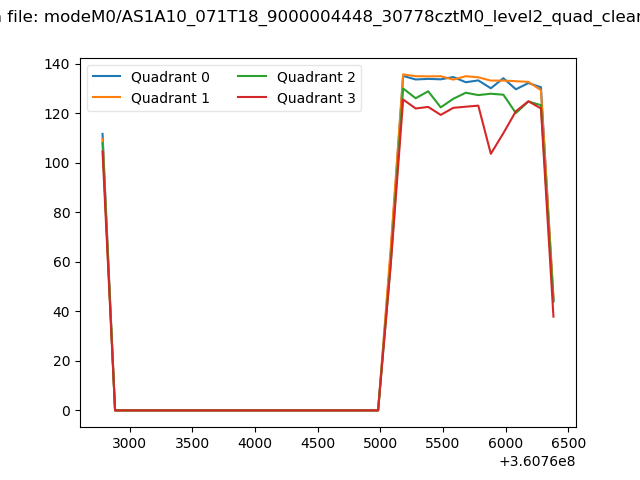
| Quadrant-wise count rates Data is divided into 100 sec bins |
 |
|
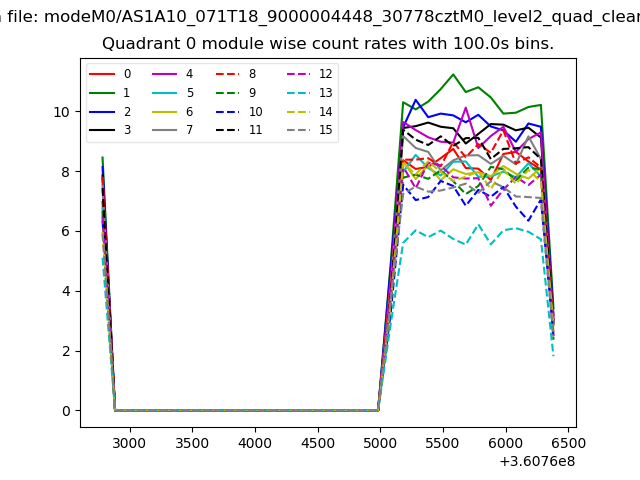
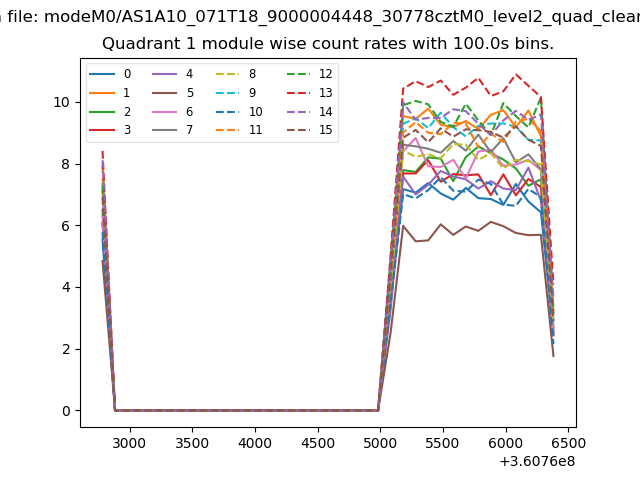
| Module-wise count rates for Quadrant A Data is divided into 100 sec bins |
 |
 |
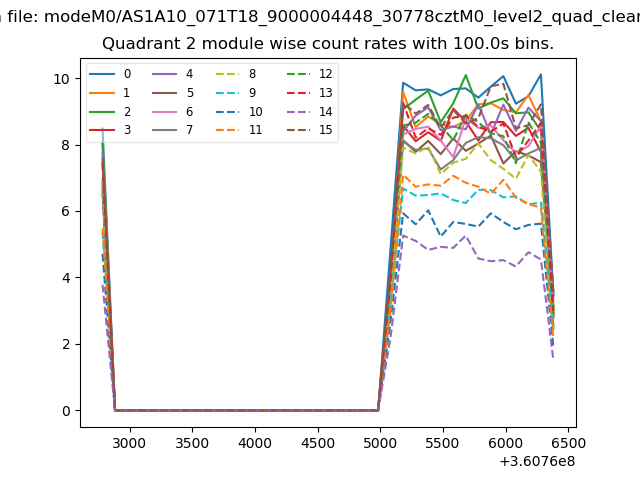
| Module-wise count rates for Quadrant B Data is divided into 100 sec bins |
 |
 |
| Module-wise count rates for Quadrant C Data is divided into 100 sec bins |
 |
 |
| Module-wise count rates for Quadrant D Data is divided into 100 sec bins |
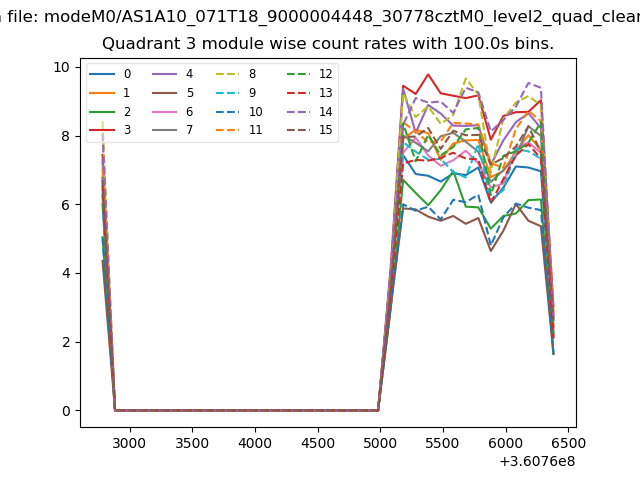 |
 |
| Parameter | Plot |
|---|---|
| CZT HV Monitor | 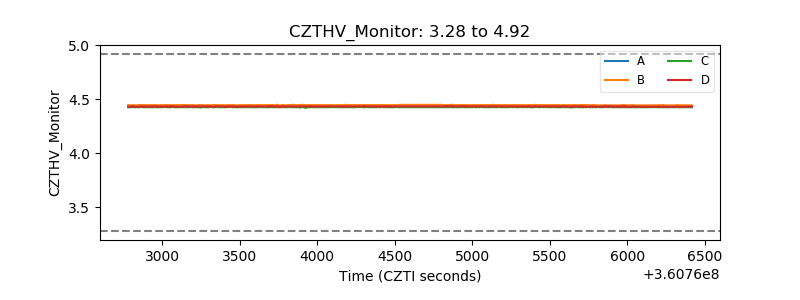 |
| D_VDD | 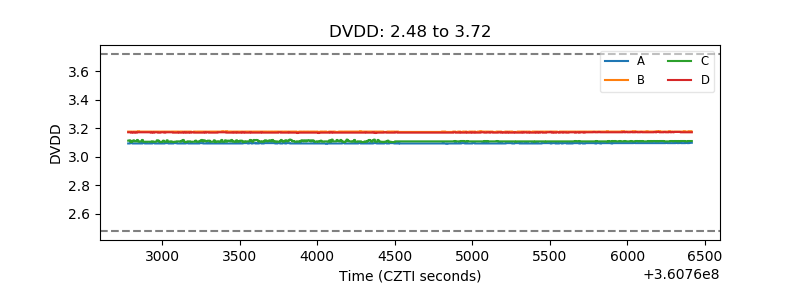 |
| Temperature 1 | 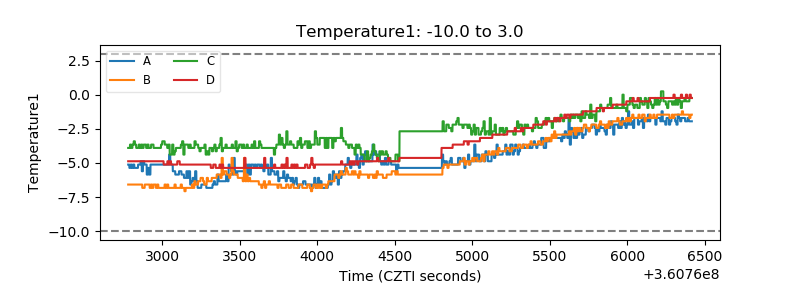 |
| Veto HV Monitor |  |
| Veto LLD | 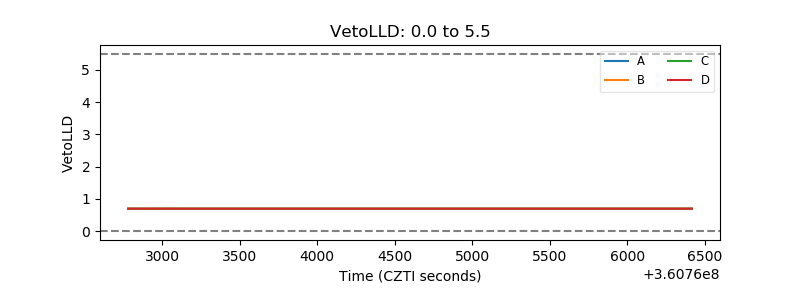 |
| Alpha Counter | 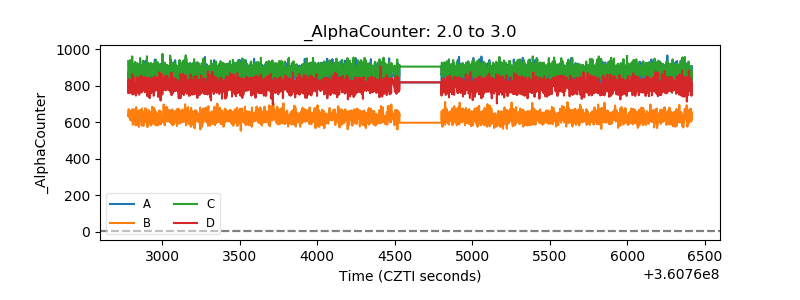 |
| _CPM_Rate | 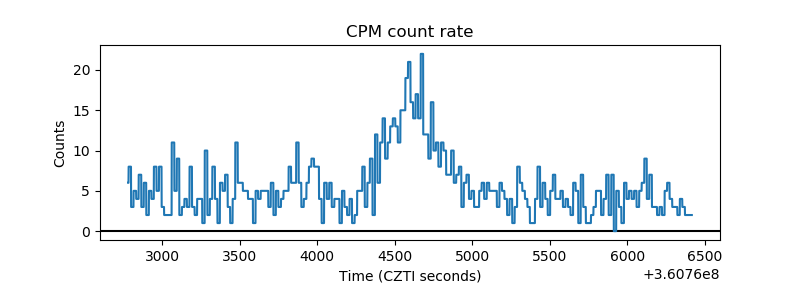 |
| CZT Counter | 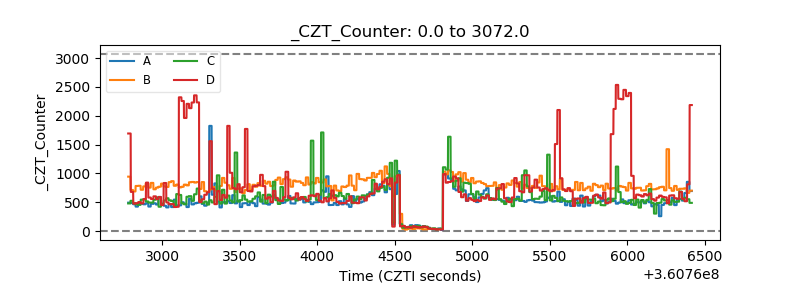 |
| +2.5 Volts monitor |  |
| +5 Volts monitor |  |
| _ROLL_ROT | 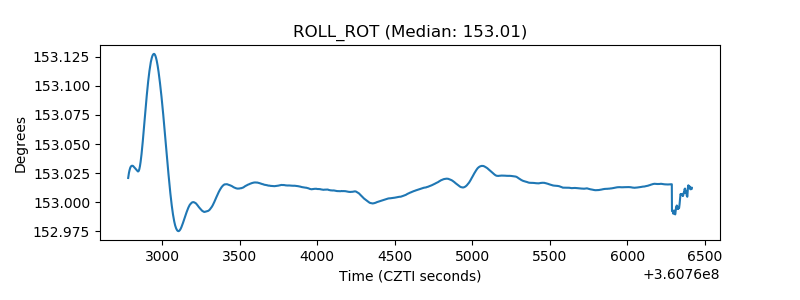 |
| _Roll_DEC |  |
| _Roll_RA | 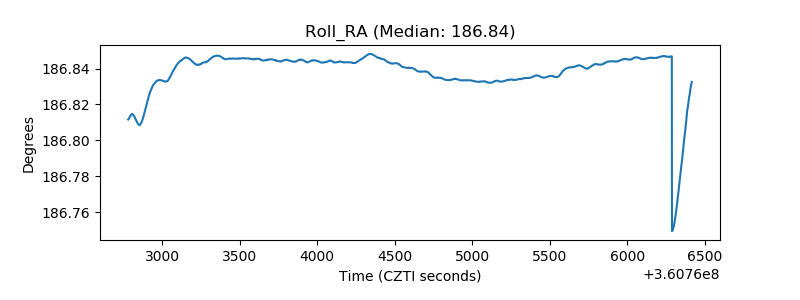 |
| Veto Counter | 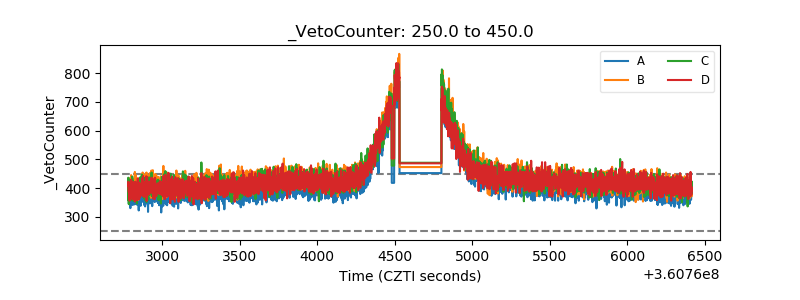 |