| Param | Original file | Final file |
|---|---|---|
| Filename | modeM0/AS1A10_071T18_9000004448_30779cztM0_level2.evt | modeM0/AS1A10_071T18_9000004448_30779cztM0_level2_quad_clean.evt |
| Size (bytes) | 744,903,360 | 96,742,080 |
| Size | 710.4 MB | 92.3 MB |
| Events in quadrant A | 4,520,729 | 628,902 |
| Events in quadrant B | 5,495,576 | 635,059 |
| Events in quadrant C | 4,337,895 | 603,311 |
| Events in quadrant D | 7,727,078 | 568,364 |
| Mode SS | |||
|---|---|---|---|
| Quadrant | BADHDUFLAG | Total packets | Discarded packets |
| A | 0 | 144 | 0 |
| B | 0 | 144 | 0 |
| C | 0 | 144 | 0 |
| D | 0 | 144 | 0 |
| Mode M9 | |||
|---|---|---|---|
| Quadrant | BADHDUFLAG | Total packets | Discarded packets |
| A | 0 | 2 | 0 |
| B | 0 | 2 | 0 |
| C | 0 | 2 | 0 |
| D | 0 | 2 | 0 |
| Mode M0 | |||
|---|---|---|---|
| Quadrant | BADHDUFLAG | Total packets | Discarded packets |
| A | 0 | 18102 | 1 |
| B | 0 | 21669 | 1 |
| C | 0 | 17298 | 1 |
| D | 0 | 27874 | 2 |
| Quadrant | Total seconds | Saturated seconds | Saturation percentage |
|---|---|---|---|
| A | 7089 | 365 | 5.148822% |
| B | 7089 | 286 | 4.034420% |
| C | 7089 | 335 | 4.725631% |
| D | 7088 | 755 | 10.651806% |
Noise dominated data is calculated using 1-second bins in cleaned event files. If a bin has >2000 counts, and if more than 50% of those come from <1% of pixels, then it is considered to be noise-dominated and hence unusable.
| Quadrant | # 1 sec bins | Bins with >0 counts | Bins with >2000 counts | High rate bins dominated by noise | Noise dominated (total time) | Noise dominated (detector-on time) | Marked lightcurve |
|---|---|---|---|---|---|---|---|
| A | 7269 | 7089 | 109 | 109 | 1.50% | 1.54% | 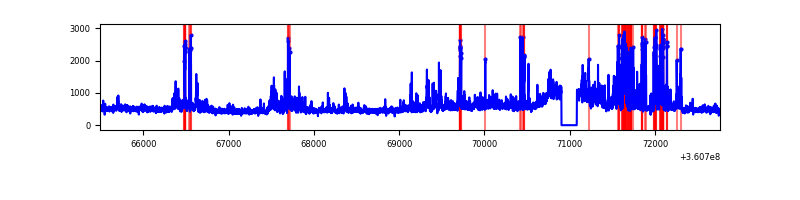 |
| B | 7269 | 7089 | 2 | 2 | 0.03% | 0.03% | 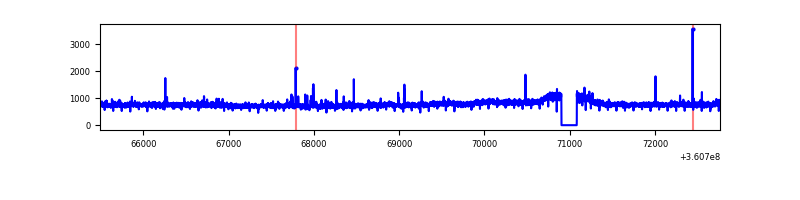 |
| C | 7269 | 7089 | 68 | 68 | 0.94% | 0.96% | 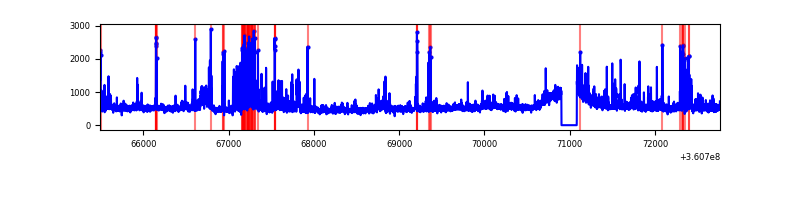 |
| D | 7268 | 7088 | 680 | 680 | 9.36% | 9.59% | 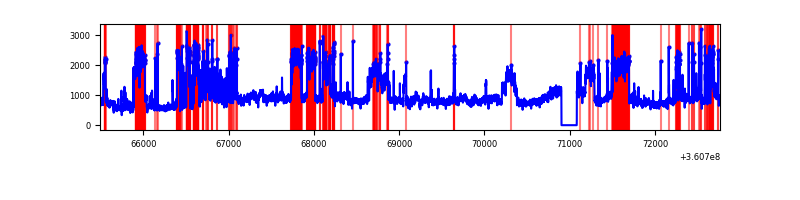 |
Top three noisy pixels from each quadrant. If the there are fewer than three noisy pixels in the level2.evt file, extra rows are filled as -1
| Pixel properties | Quadrant properties | ||||||
|---|---|---|---|---|---|---|---|
| Quadrant | DetID | PixID | Counts | Sigma | Mean | Median | Sigma |
| A | 0 | 13 | 1094480 | 6017.83 | 889 | 870 | 181.7 |
| A | 13 | 254 | 12026 | 61.39 | 889 | 870 | 181.7 |
| A | 3 | 137 | 9085 | 45.2 | 889 | 870 | 181.7 |
| B | 6 | 159 | 1940312 | 11277.75 | 880 | 857 | 172.0 |
| B | 0 | 190 | 44844 | 255.78 | 880 | 857 | 172.0 |
| B | 5 | 255 | 27841 | 156.91 | 880 | 857 | 172.0 |
| C | 3 | 233 | 485158 | 2408.41 | 847 | 852 | 201.1 |
| C | 0 | 10 | 401979 | 1994.77 | 847 | 852 | 201.1 |
| C | 14 | 238 | 134770 | 665.96 | 847 | 852 | 201.1 |
| D | 8 | 195 | 3833012 | 16859.38 | 846 | 831 | 227.3 |
| D | 13 | 249 | 410800 | 1803.63 | 846 | 831 | 227.3 |
| D | 12 | 233 | 110503 | 482.49 | 846 | 831 | 227.3 |
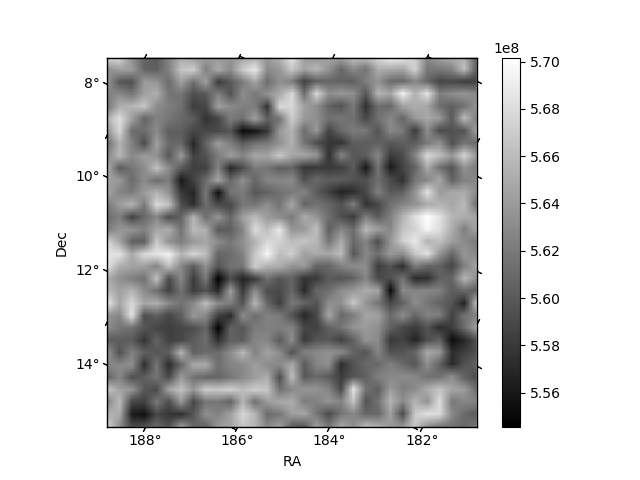
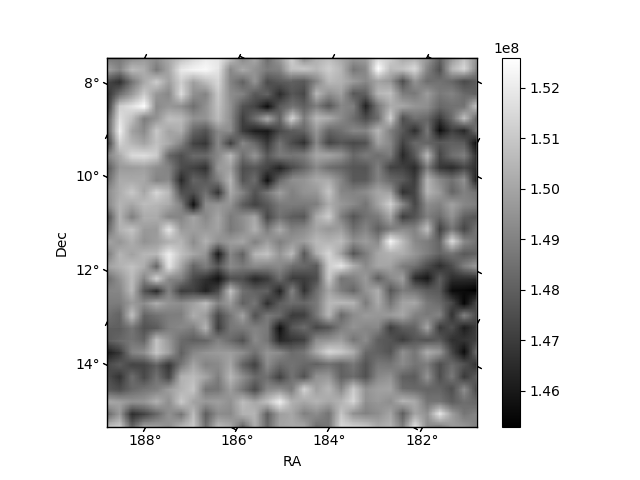
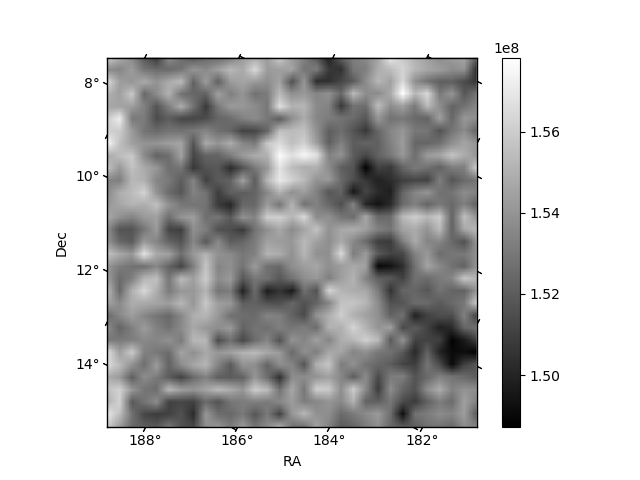
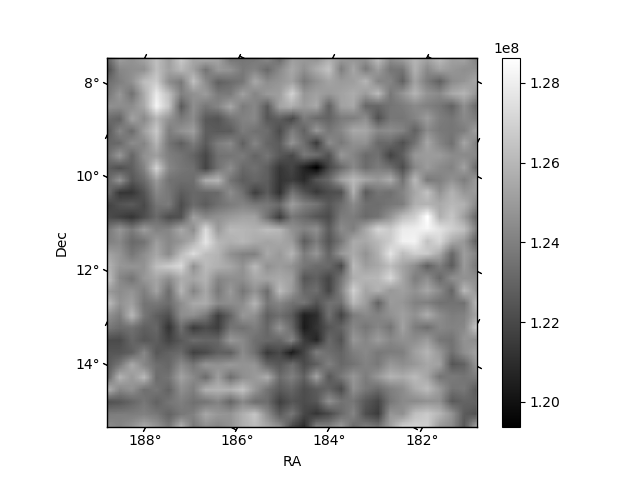
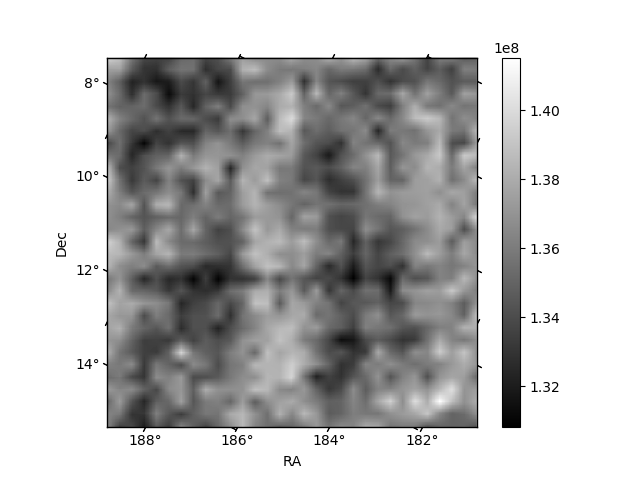
Histogram calculated using DETX and DETY for each event in the final _common_clean file
| Quadrant A | 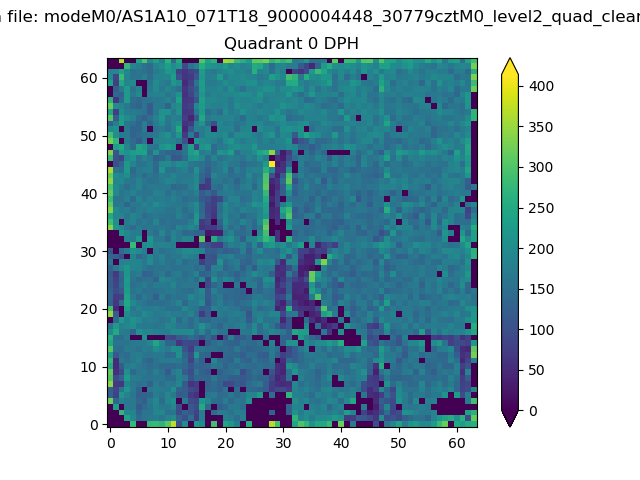 |
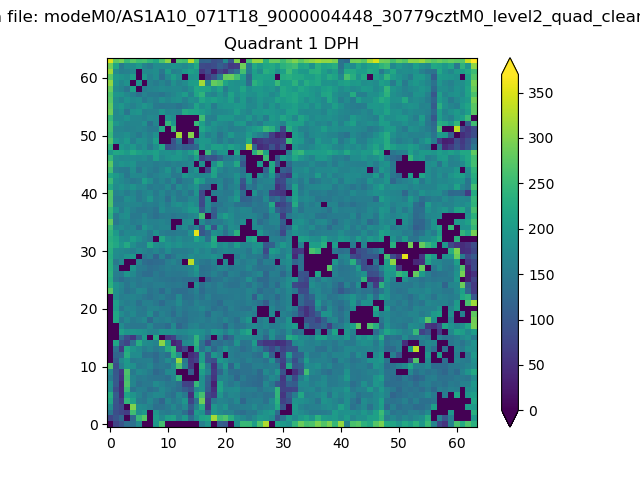 |
Quadrant B |
|---|---|---|---|
| Quadrant D | 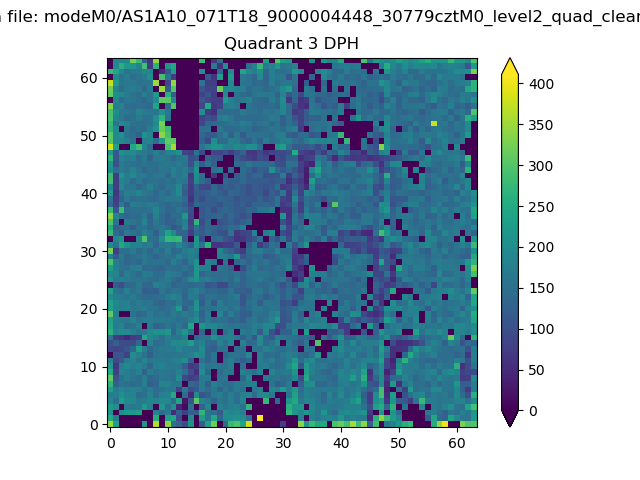 |
 |
Quadrant C |
| Plot type | Count rate plots | Images |
|---|---|---|
| Comparison with Poisson distribution Blue bars denote a histogram of data divided into 1 sec bins. Red curve is a Poisson curve with rate = median count rate of data. |
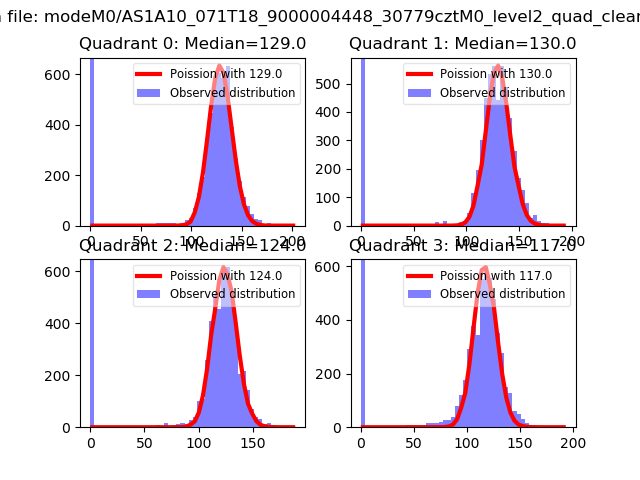 |
 |
| Quadrant-wise count rates Data is divided into 100 sec bins |
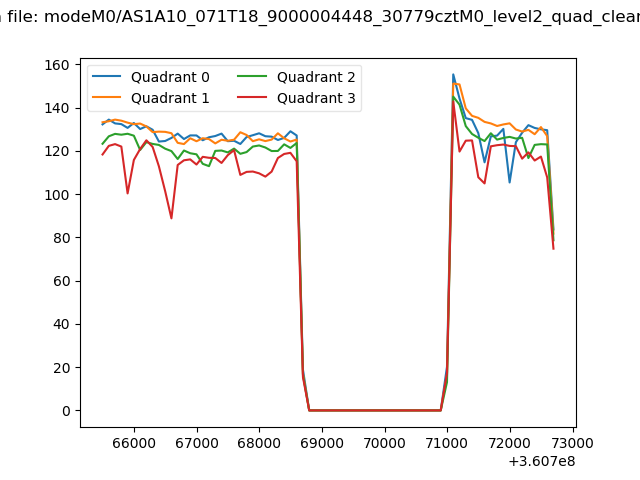 |
|
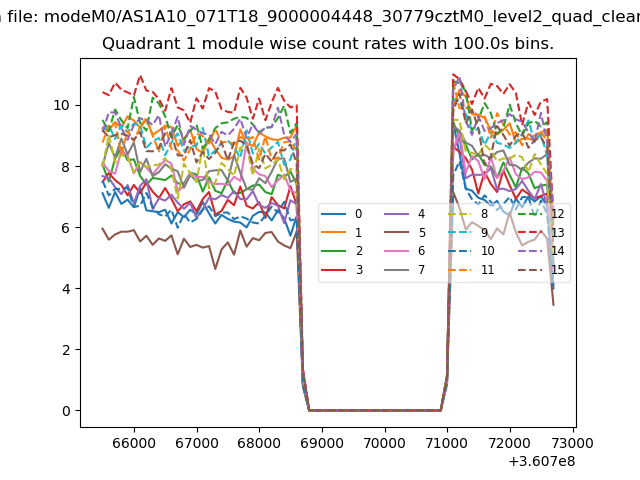
| Module-wise count rates for Quadrant A Data is divided into 100 sec bins |
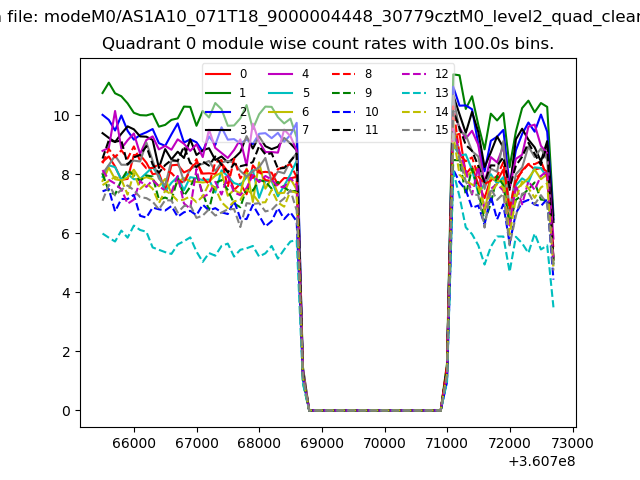 |
 |
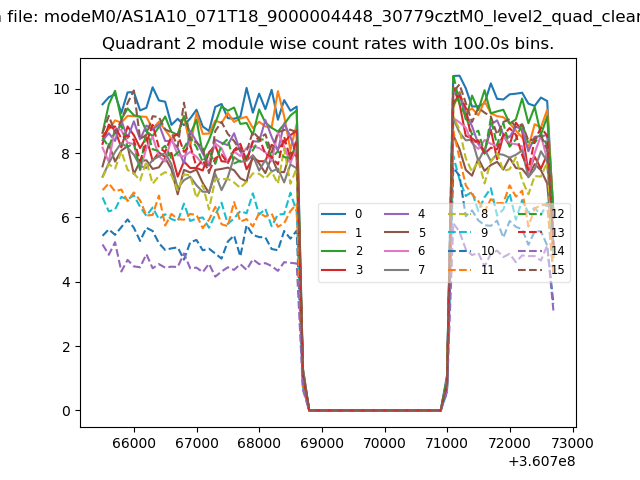
| Module-wise count rates for Quadrant B Data is divided into 100 sec bins |
 |
 |
| Module-wise count rates for Quadrant C Data is divided into 100 sec bins |
 |
 |
| Module-wise count rates for Quadrant D Data is divided into 100 sec bins |
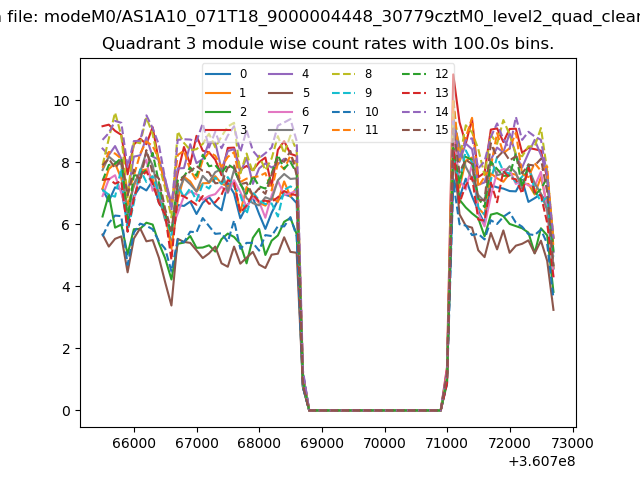 |
 |
| Parameter | Plot |
|---|---|
| CZT HV Monitor | 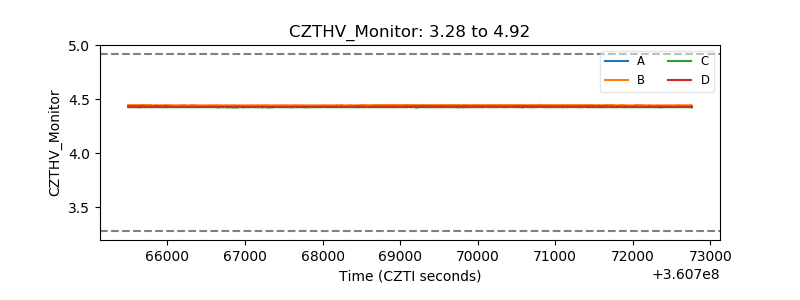 |
| D_VDD | 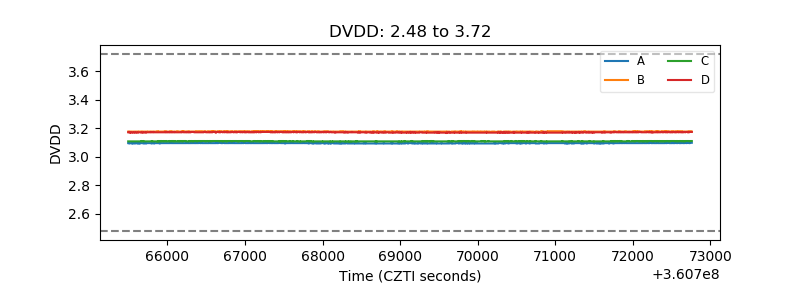 |
| Temperature 1 | 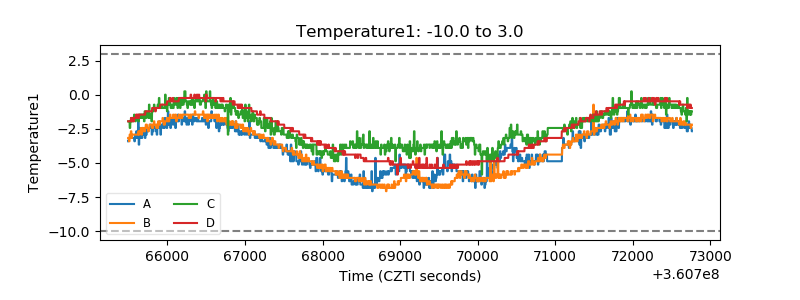 |
| Veto HV Monitor | 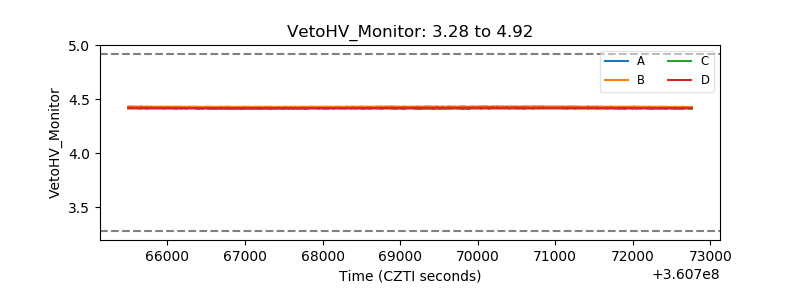 |
| Veto LLD | 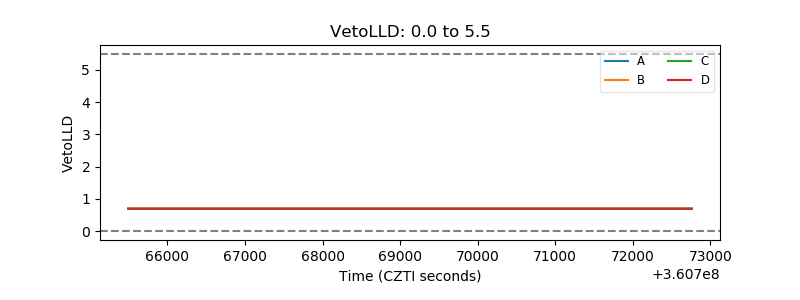 |
| Alpha Counter | 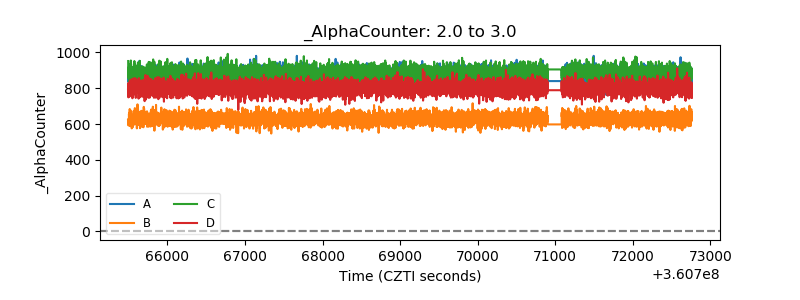 |
| _CPM_Rate | 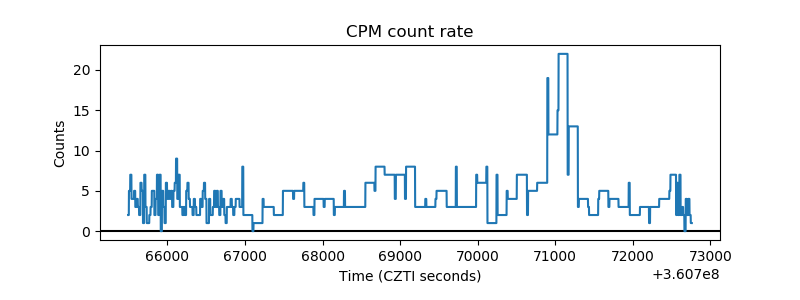 |
| CZT Counter | 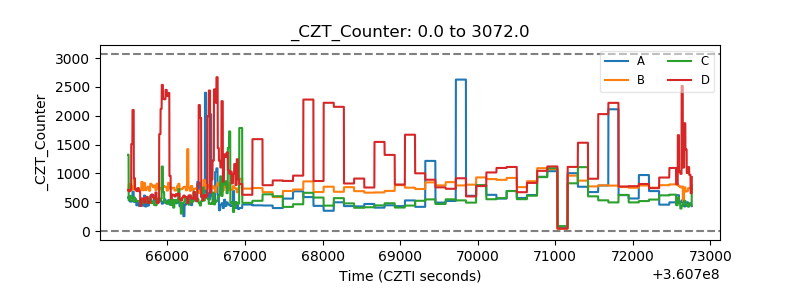 |
| +2.5 Volts monitor |  |
| +5 Volts monitor |  |
| _ROLL_ROT | 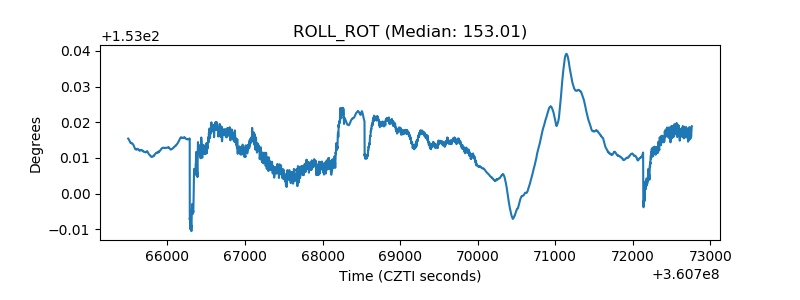 |
| _Roll_DEC |  |
| _Roll_RA | 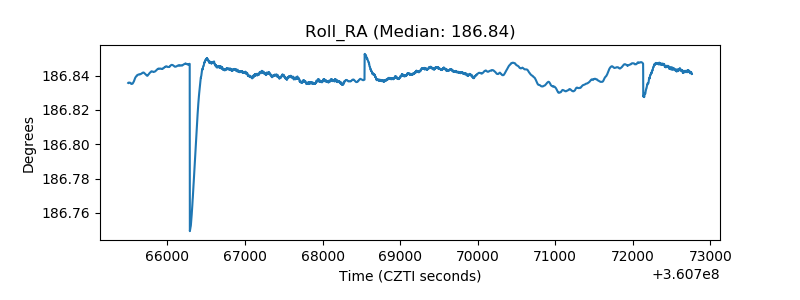 |
| Veto Counter | 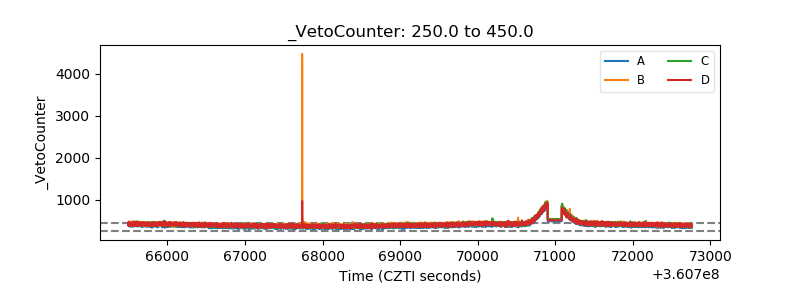 |