| Param | Original file | Final file |
|---|---|---|
| Filename | modeM0/AS1A10_071T18_9000004448_30782cztM0_level2.evt | modeM0/AS1A10_071T18_9000004448_30782cztM0_level2_quad_clean.evt |
| Size (bytes) | 1,833,531,840 | 223,908,480 |
| Size | 1.7 GB | 213.5 MB |
| Events in quadrant A | 10,334,740 | 1,437,409 |
| Events in quadrant B | 13,794,818 | 1,441,495 |
| Events in quadrant C | 10,734,796 | 1,362,273 |
| Events in quadrant D | 19,453,381 | 1,296,460 |
| Mode SS | |||
|---|---|---|---|
| Quadrant | BADHDUFLAG | Total packets | Discarded packets |
| A | 0 | 366 | 0 |
| B | 0 | 366 | 0 |
| C | 0 | 366 | 0 |
| D | 0 | 366 | 0 |
| Mode M9 | |||
|---|---|---|---|
| Quadrant | BADHDUFLAG | Total packets | Discarded packets |
| A | 0 | 18 | 0 |
| B | 0 | 18 | 0 |
| C | 0 | 18 | 0 |
| D | 0 | 18 | 0 |
| Mode M0 | |||
|---|---|---|---|
| Quadrant | BADHDUFLAG | Total packets | Discarded packets |
| A | 0 | 42430 | 3 |
| B | 0 | 54594 | 3 |
| C | 0 | 43544 | 3 |
| D | 0 | 70914 | 3 |
| Quadrant | Total seconds | Saturated seconds | Saturation percentage |
|---|---|---|---|
| A | 18033 | 482 | 2.672878% |
| B | 18034 | 325 | 1.802151% |
| C | 18034 | 692 | 3.837196% |
| D | 18034 | 2041 | 11.317511% |
Noise dominated data is calculated using 1-second bins in cleaned event files. If a bin has >2000 counts, and if more than 50% of those come from <1% of pixels, then it is considered to be noise-dominated and hence unusable.
| Quadrant | # 1 sec bins | Bins with >0 counts | Bins with >2000 counts | High rate bins dominated by noise | Noise dominated (total time) | Noise dominated (detector-on time) | Marked lightcurve |
|---|---|---|---|---|---|---|---|
| A | 19803 | 18033 | 279 | 279 | 1.41% | 1.55% |  |
| B | 19804 | 18034 | 4 | 4 | 0.02% | 0.02% |  |
| C | 19804 | 18034 | 255 | 255 | 1.29% | 1.41% |  |
| D | 19804 | 18034 | 1974 | 1974 | 9.97% | 10.95% |  |
Top three noisy pixels from each quadrant. If the there are fewer than three noisy pixels in the level2.evt file, extra rows are filled as -1
| Pixel properties | Quadrant properties | ||||||
|---|---|---|---|---|---|---|---|
| Quadrant | DetID | PixID | Counts | Sigma | Mean | Median | Sigma |
| A | 0 | 13 | 1902582 | 4347.44 | 2182 | 2135 | 437.1 |
| A | 13 | 254 | 33159 | 70.97 | 2182 | 2135 | 437.1 |
| A | 3 | 137 | 22134 | 45.75 | 2182 | 2135 | 437.1 |
| B | 6 | 159 | 5067285 | 12223.2 | 2165 | 2110 | 414.4 |
| B | 0 | 190 | 96390 | 227.51 | 2165 | 2110 | 414.4 |
| B | 12 | 111 | 53133 | 123.13 | 2165 | 2110 | 414.4 |
| C | 0 | 10 | 1986722 | 4051.65 | 2078 | 2090 | 489.8 |
| C | 14 | 238 | 335208 | 680.06 | 2078 | 2090 | 489.8 |
| C | 3 | 233 | 235166 | 475.83 | 2078 | 2090 | 489.8 |
| D | 8 | 195 | 9453753 | 17350.49 | 2046 | 2007 | 544.8 |
| D | 13 | 249 | 1108795 | 2031.72 | 2046 | 2007 | 544.8 |
| D | 12 | 233 | 552762 | 1011.02 | 2046 | 2007 | 544.8 |
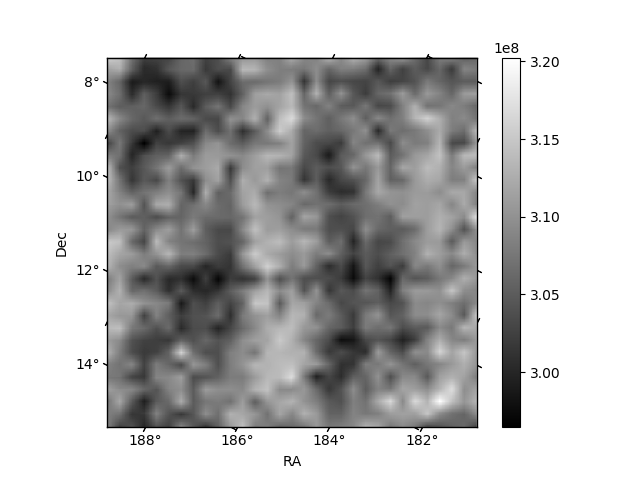
Histogram calculated using DETX and DETY for each event in the final _common_clean file
| Quadrant A |  |
 |
Quadrant B |
|---|---|---|---|
| Quadrant D |  |
 |
Quadrant C |
| Plot type | Count rate plots | Images |
|---|---|---|
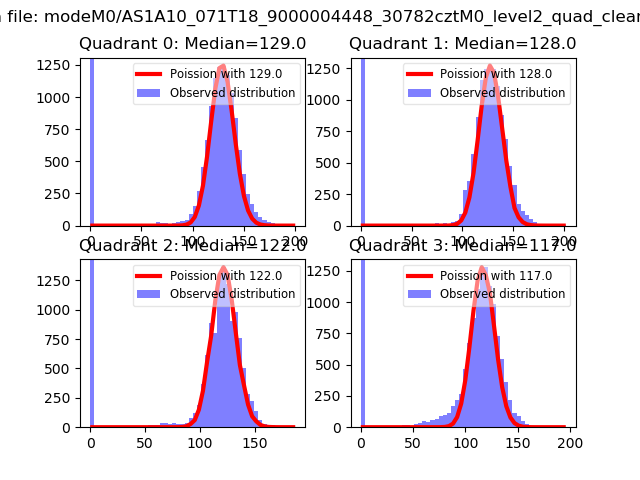
| Comparison with Poisson distribution Blue bars denote a histogram of data divided into 1 sec bins. Red curve is a Poisson curve with rate = median count rate of data. |
 |
 |
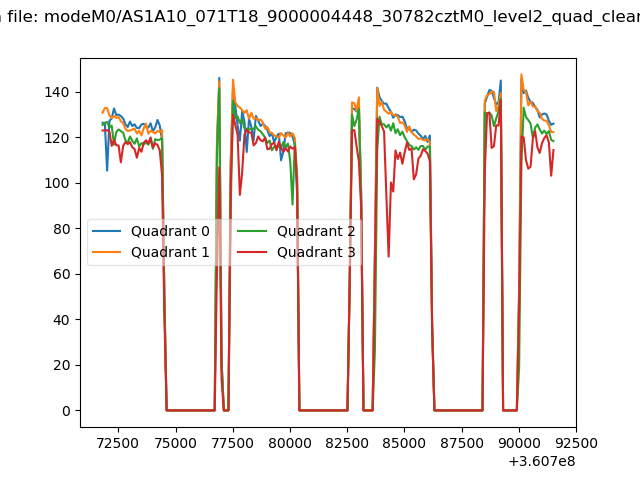
| Quadrant-wise count rates Data is divided into 100 sec bins |
 |
|
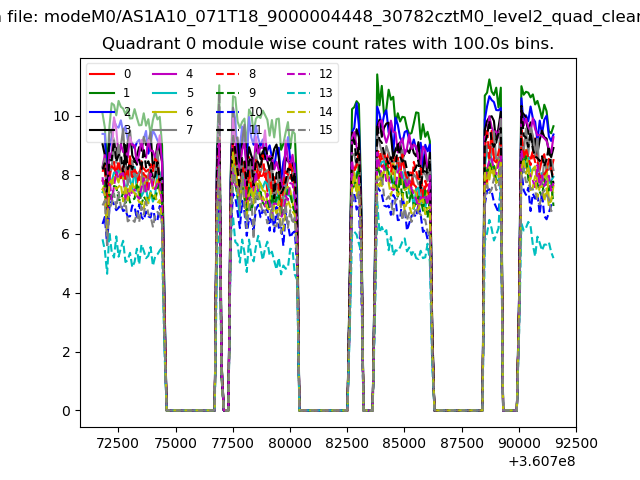
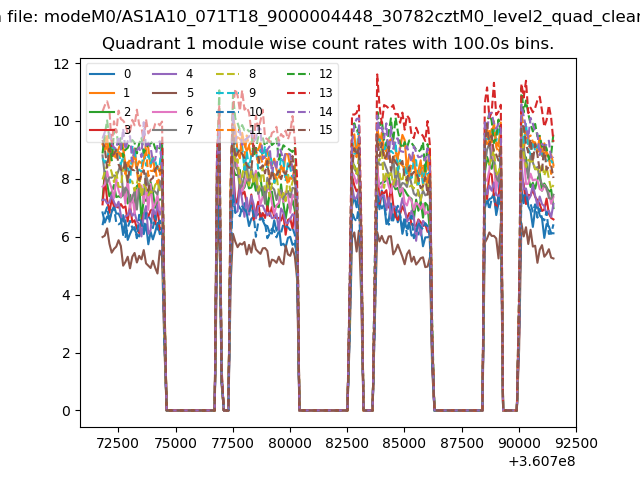
| Module-wise count rates for Quadrant A Data is divided into 100 sec bins |
 |
 |
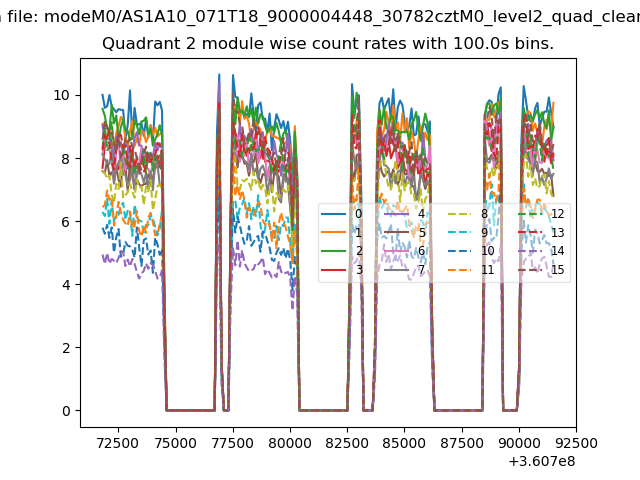
| Module-wise count rates for Quadrant B Data is divided into 100 sec bins |
 |
 |
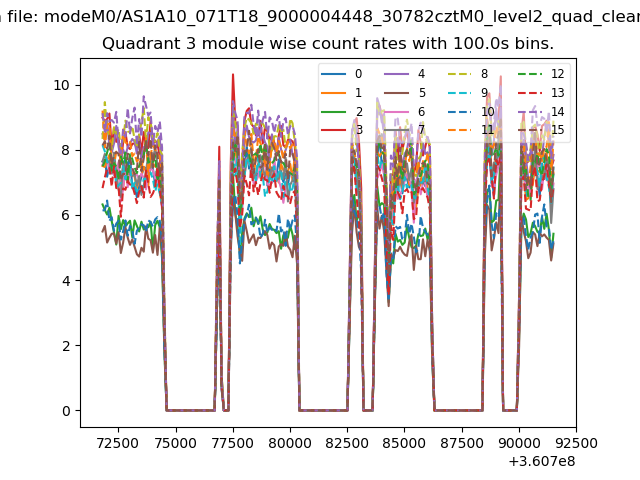
| Module-wise count rates for Quadrant C Data is divided into 100 sec bins |
 |
 |
| Module-wise count rates for Quadrant D Data is divided into 100 sec bins |
 |
 |
| Parameter | Plot |
|---|---|
| CZT HV Monitor | 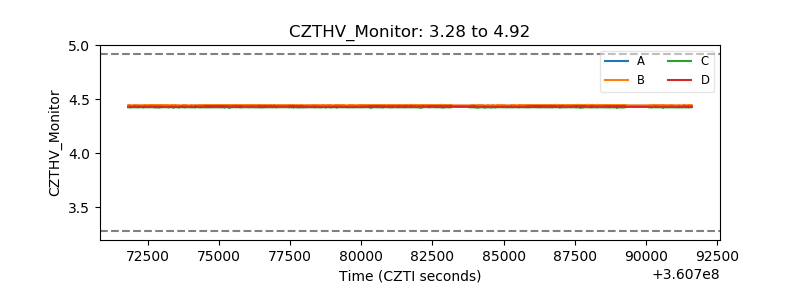 |
| D_VDD | 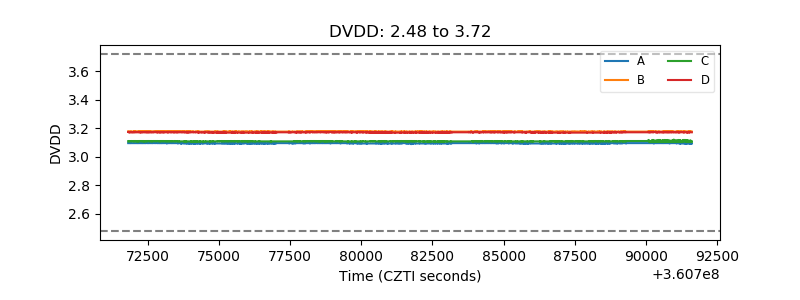 |
| Temperature 1 | 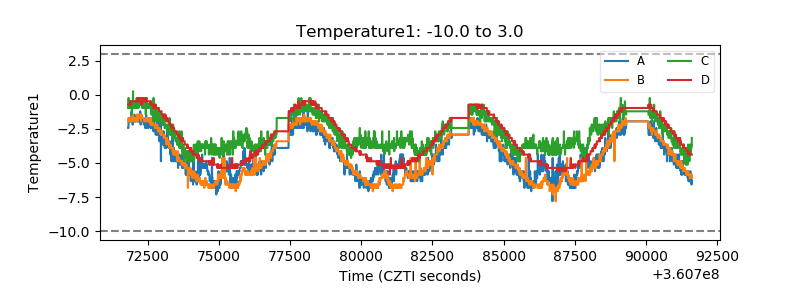 |
| Veto HV Monitor |  |
| Veto LLD | 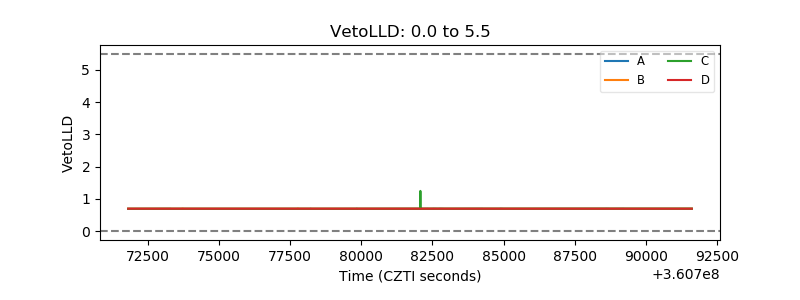 |
| Alpha Counter | 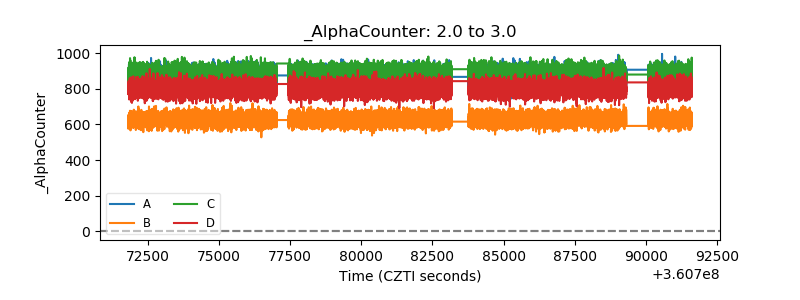 |
| _CPM_Rate | 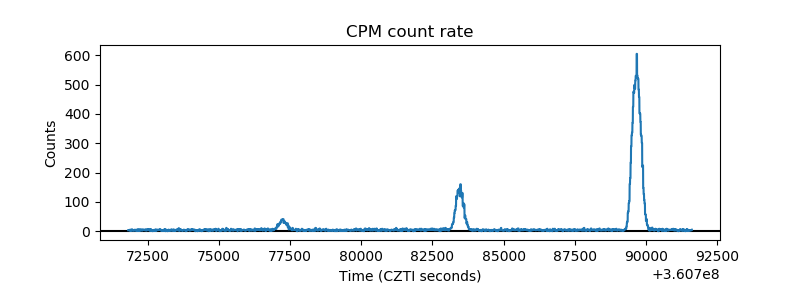 |
| CZT Counter |  |
| +2.5 Volts monitor |  |
| +5 Volts monitor | 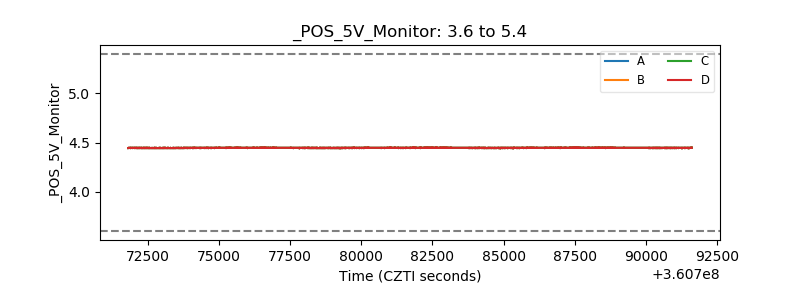 |
| _ROLL_ROT | 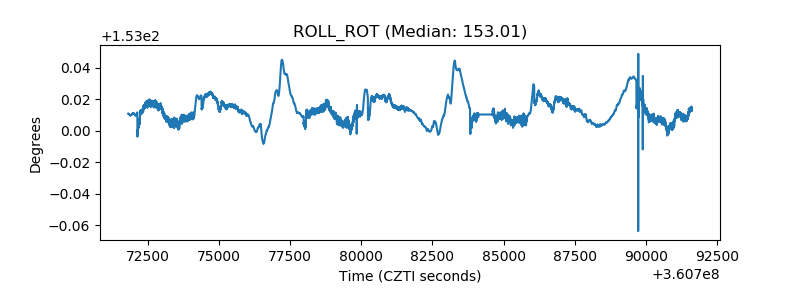 |
| _Roll_DEC | 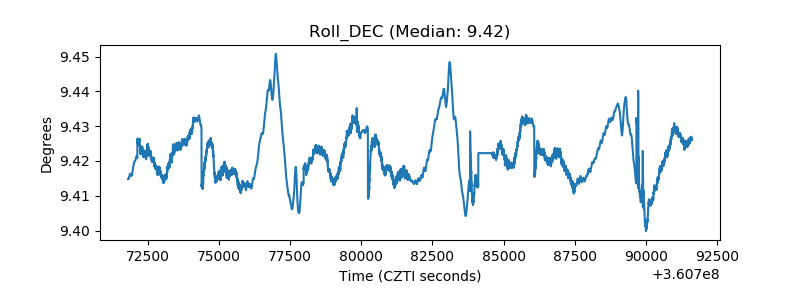 |
| _Roll_RA |  |
| Veto Counter | 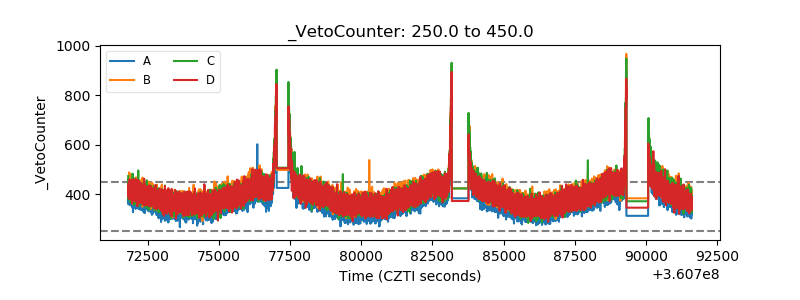 |