| Param | Original file | Final file |
|---|---|---|
| Filename | modeM0/AS1A10_071T18_9000004448_30784cztM0_level2.evt | modeM0/AS1A10_071T18_9000004448_30784cztM0_level2_quad_clean.evt |
| Size (bytes) | 646,418,880 | 90,532,800 |
| Size | 616.5 MB | 86.3 MB |
| Events in quadrant A | 3,175,174 | 603,322 |
| Events in quadrant B | 5,054,626 | 595,800 |
| Events in quadrant C | 3,626,492 | 556,384 |
| Events in quadrant D | 7,282,158 | 532,823 |
| Mode SS | |||
|---|---|---|---|
| Quadrant | BADHDUFLAG | Total packets | Discarded packets |
| A | 0 | 132 | 0 |
| B | 0 | 132 | 0 |
| C | 0 | 132 | 0 |
| D | 0 | 132 | 0 |
| Mode M9 | |||
|---|---|---|---|
| Quadrant | BADHDUFLAG | Total packets | Discarded packets |
| A | 0 | 21 | 0 |
| B | 0 | 21 | 0 |
| C | 0 | 21 | 0 |
| D | 0 | 21 | 0 |
| Mode M0 | |||
|---|---|---|---|
| Quadrant | BADHDUFLAG | Total packets | Discarded packets |
| A | 0 | 13521 | 2 |
| B | 0 | 19661 | 3 |
| C | 0 | 14708 | 2 |
| D | 0 | 26330 | 2 |
| Quadrant | Total seconds | Saturated seconds | Saturation percentage |
|---|---|---|---|
| A | 6502 | 22 | 0.338357% |
| B | 6501 | 56 | 0.861406% |
| C | 6501 | 200 | 3.076450% |
| D | 6502 | 441 | 6.782528% |
Noise dominated data is calculated using 1-second bins in cleaned event files. If a bin has >2000 counts, and if more than 50% of those come from <1% of pixels, then it is considered to be noise-dominated and hence unusable.
| Quadrant | # 1 sec bins | Bins with >0 counts | Bins with >2000 counts | High rate bins dominated by noise | Noise dominated (total time) | Noise dominated (detector-on time) | Marked lightcurve |
|---|---|---|---|---|---|---|---|
| A | 8537 | 6503 | 1 | 1 | 0.01% | 0.02% | 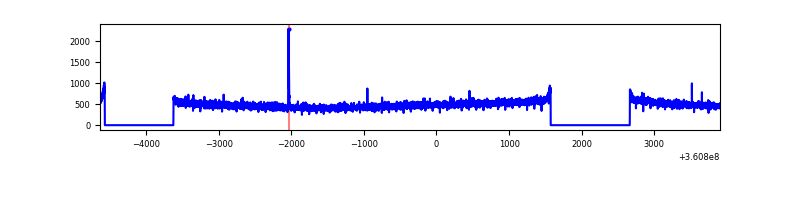 |
| B | 8536 | 6502 | 1 | 1 | 0.01% | 0.02% | 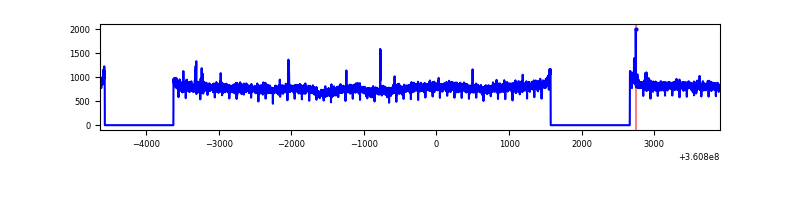 |
| C | 8536 | 6502 | 93 | 93 | 1.09% | 1.43% | 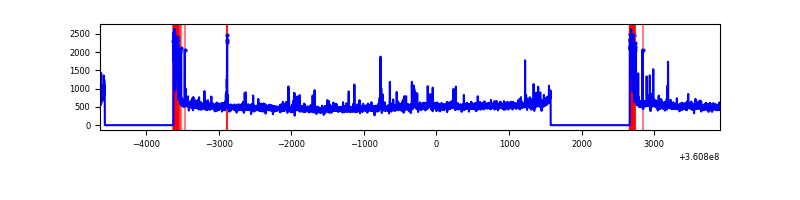 |
| D | 8537 | 6504 | 585 | 585 | 6.85% | 8.99% | 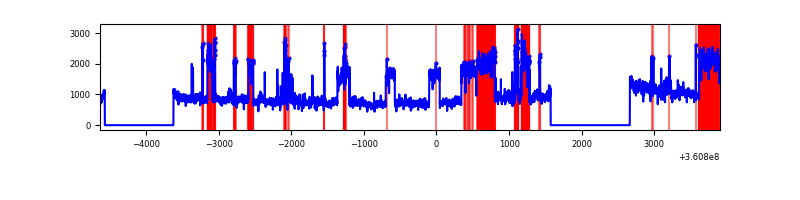 |
Top three noisy pixels from each quadrant. If the there are fewer than three noisy pixels in the level2.evt file, extra rows are filled as -1
| Pixel properties | Quadrant properties | ||||||
|---|---|---|---|---|---|---|---|
| Quadrant | DetID | PixID | Counts | Sigma | Mean | Median | Sigma |
| A | 13 | 254 | 12061 | 68.39 | 821 | 805 | 164.6 |
| A | 3 | 137 | 8100 | 44.32 | 821 | 805 | 164.6 |
| A | 0 | 226 | 6933 | 37.23 | 821 | 805 | 164.6 |
| B | 6 | 159 | 1834393 | 11863.36 | 810 | 791 | 154.6 |
| B | 12 | 111 | 19072 | 118.28 | 810 | 791 | 154.6 |
| B | 0 | 190 | 17367 | 107.25 | 810 | 791 | 154.6 |
| C | 0 | 10 | 358501 | 1963.79 | 772 | 779 | 182.2 |
| C | 14 | 238 | 124248 | 677.81 | 772 | 779 | 182.2 |
| C | 3 | 233 | 69839 | 379.12 | 772 | 779 | 182.2 |
| D | 8 | 195 | 4038699 | 19918.33 | 767 | 753 | 202.7 |
| D | 13 | 249 | 251349 | 1236.14 | 767 | 753 | 202.7 |
| D | 2 | 250 | 30366 | 146.07 | 767 | 753 | 202.7 |
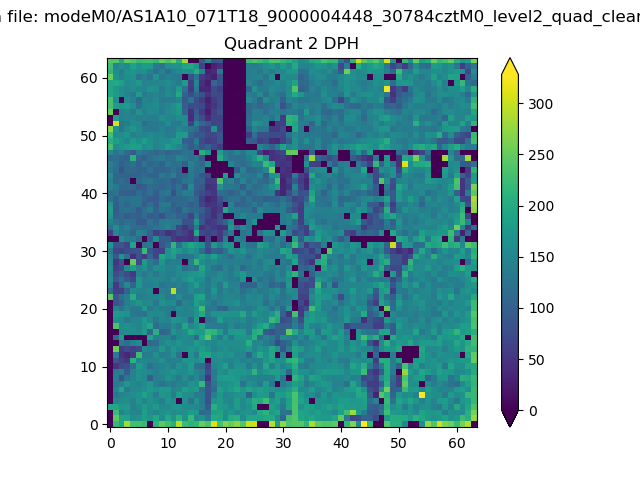
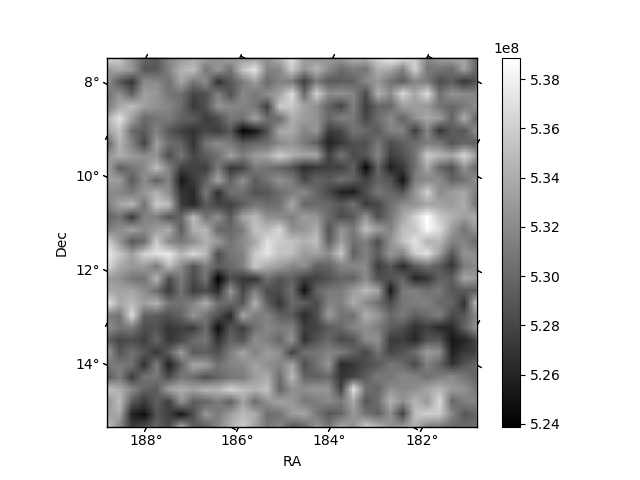
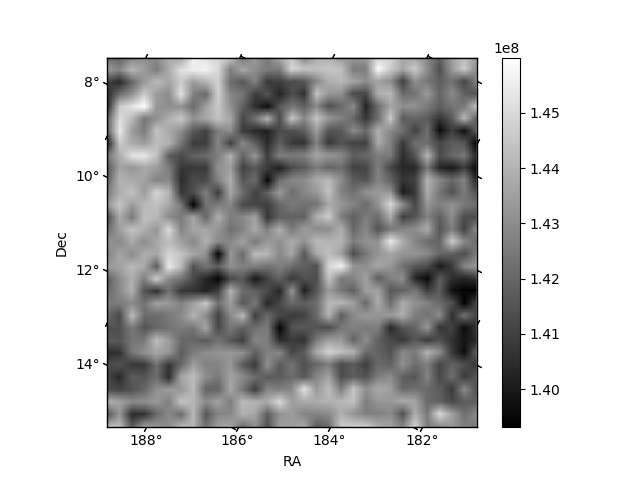
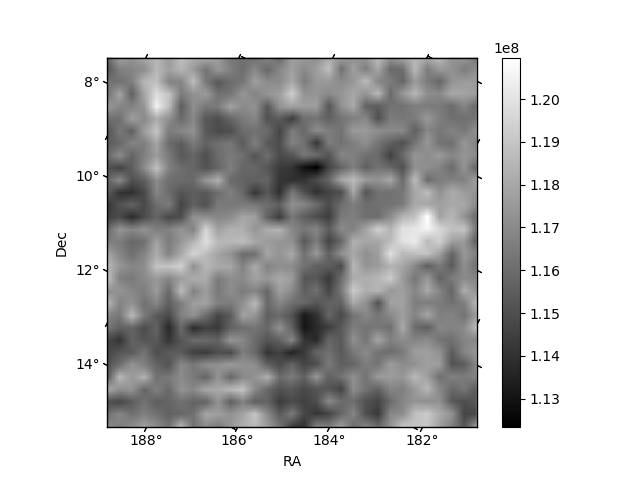
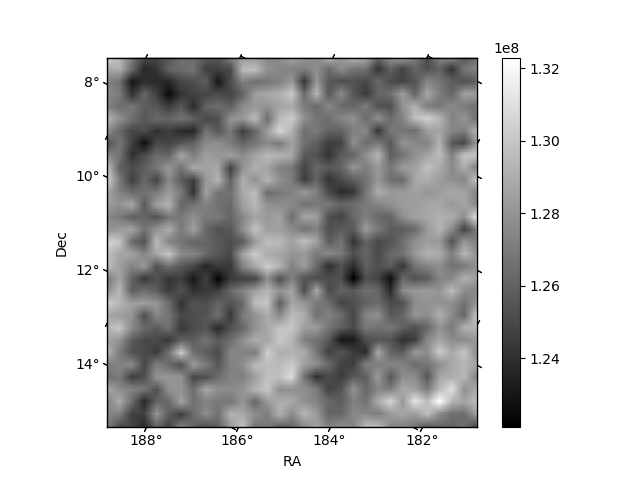
Histogram calculated using DETX and DETY for each event in the final _common_clean file
| Quadrant A | 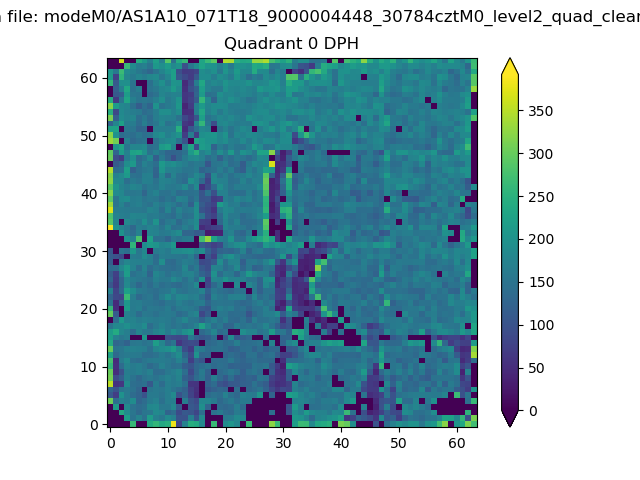 |
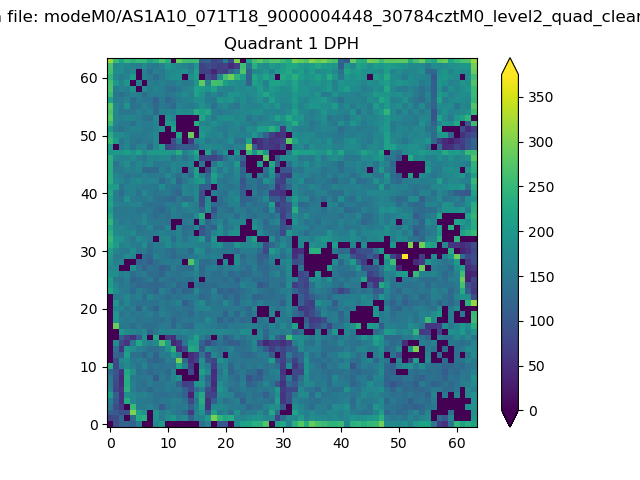 |
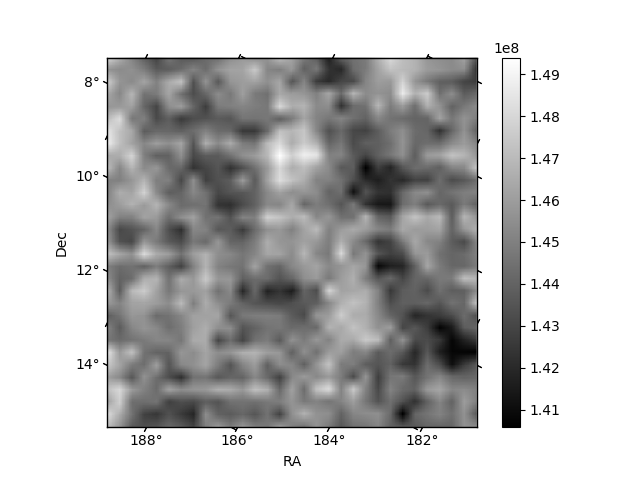
Quadrant B |
|---|---|---|---|
| Quadrant D | 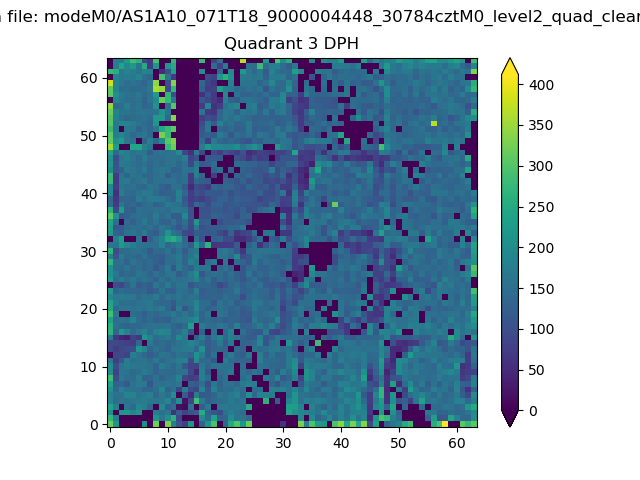 |
 |
Quadrant C |
| Plot type | Count rate plots | Images |
|---|---|---|
| Comparison with Poisson distribution Blue bars denote a histogram of data divided into 1 sec bins. Red curve is a Poisson curve with rate = median count rate of data. |
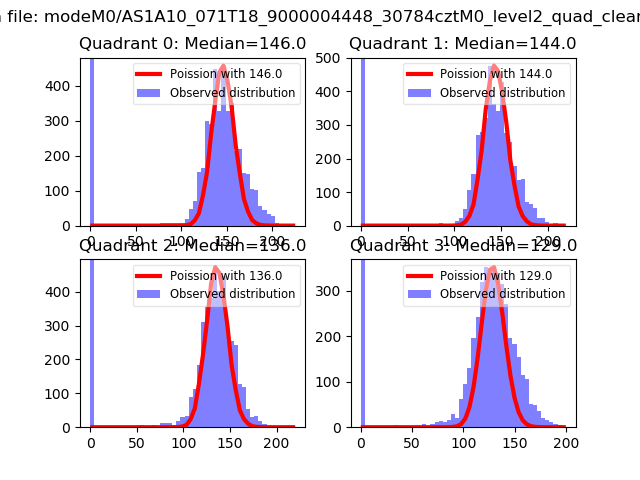 |
 |
| Quadrant-wise count rates Data is divided into 100 sec bins |
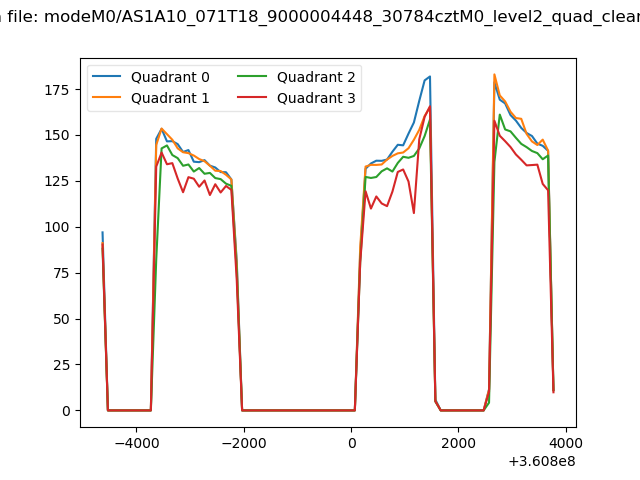 |
|
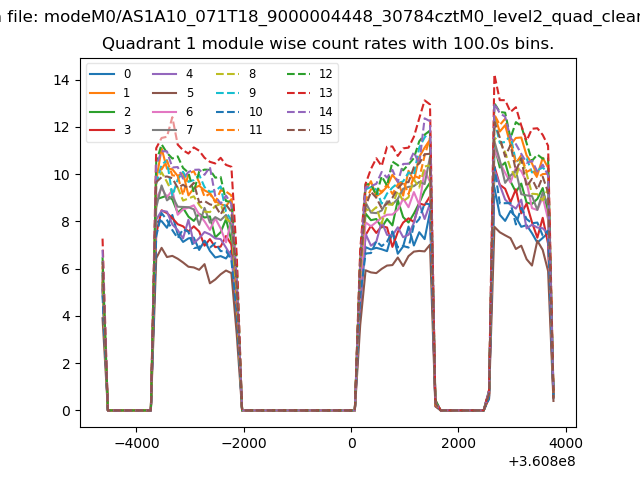
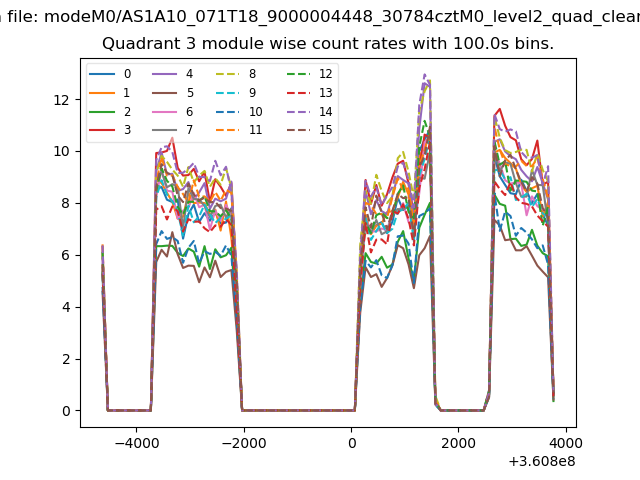
| Module-wise count rates for Quadrant A Data is divided into 100 sec bins |
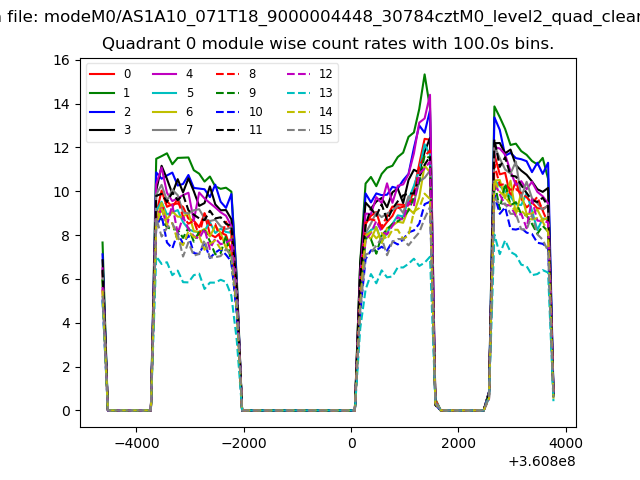 |
 |
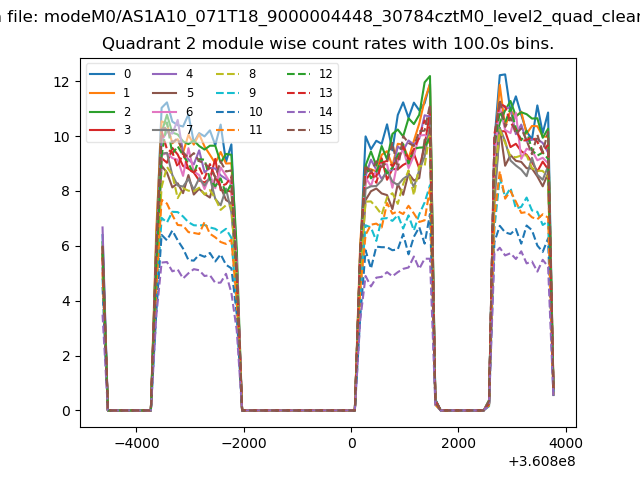
| Module-wise count rates for Quadrant B Data is divided into 100 sec bins |
 |
 |
| Module-wise count rates for Quadrant C Data is divided into 100 sec bins |
 |
 |
| Module-wise count rates for Quadrant D Data is divided into 100 sec bins |
 |
 |
| Parameter | Plot |
|---|---|
| CZT HV Monitor | 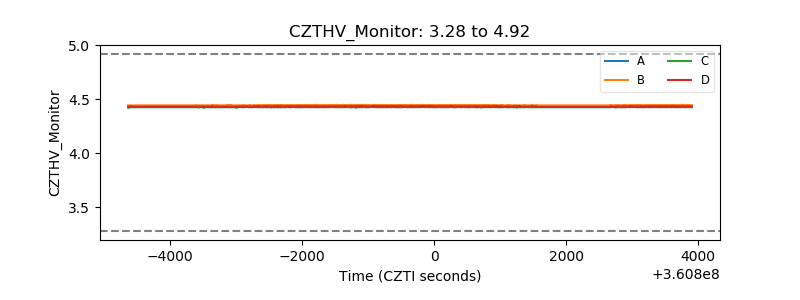 |
| D_VDD | 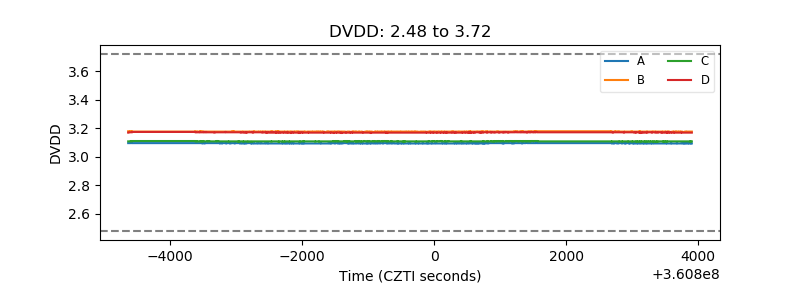 |
| Temperature 1 | 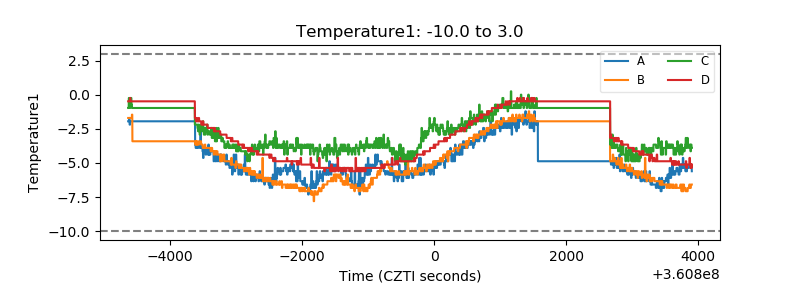 |
| Veto HV Monitor | 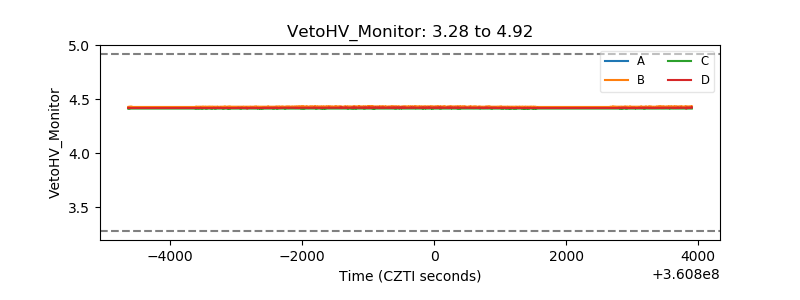 |
| Veto LLD | 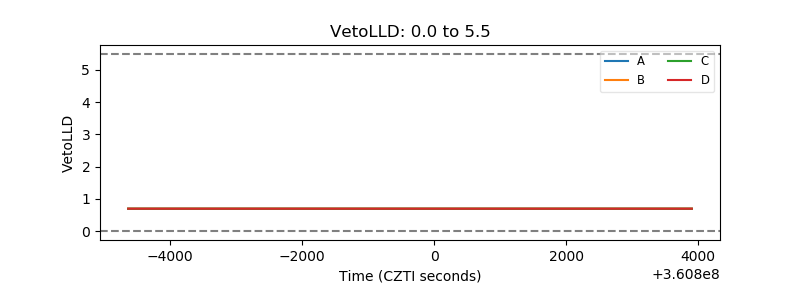 |
| Alpha Counter | 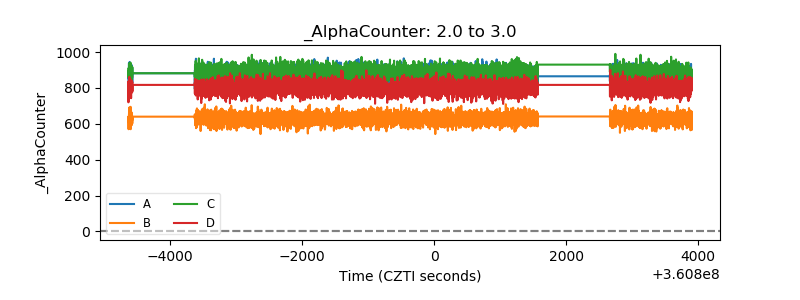 |
| _CPM_Rate | 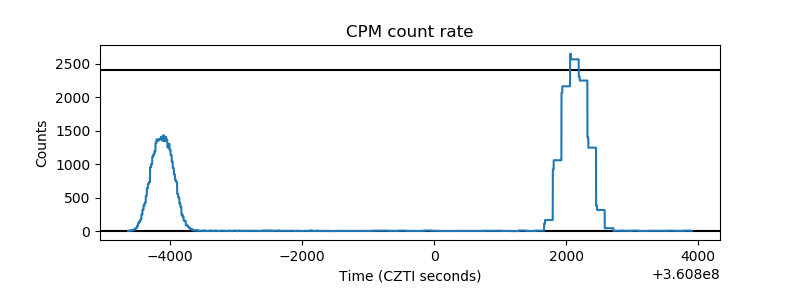 |
| CZT Counter | 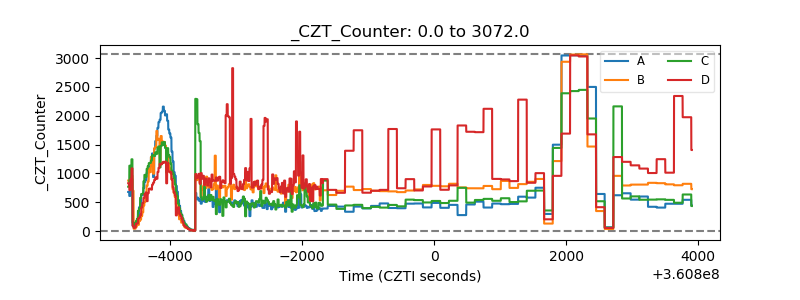 |
| +2.5 Volts monitor |  |
| +5 Volts monitor |  |
| _ROLL_ROT | 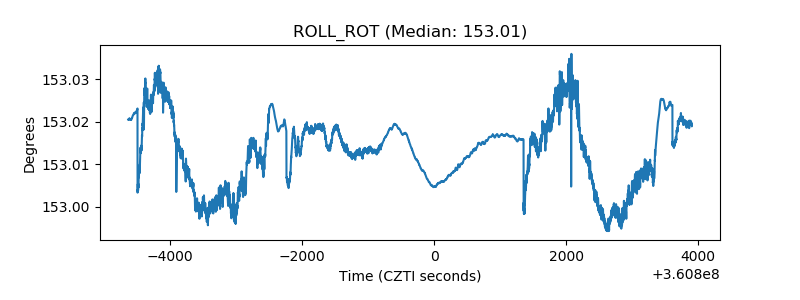 |
| _Roll_DEC | 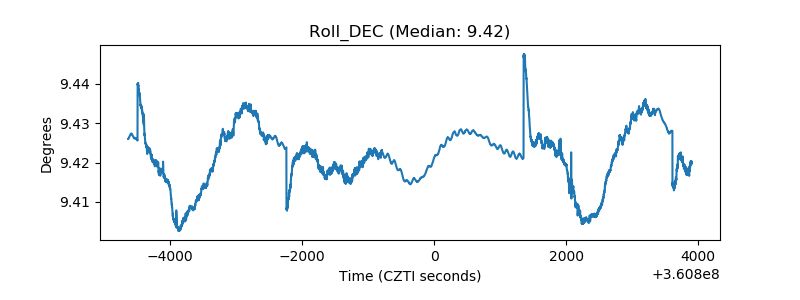 |
| _Roll_RA | 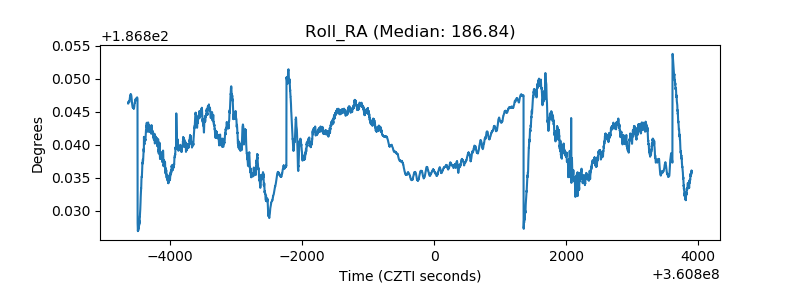 |
| Veto Counter | 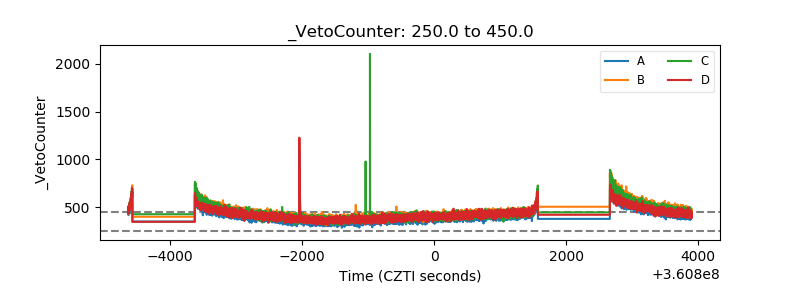 |