| Param | Original file | Final file |
|---|---|---|
| Filename | modeM0/AS1A10_071T18_9000004448_30786cztM0_level2.evt | modeM0/AS1A10_071T18_9000004448_30786cztM0_level2_quad_clean.evt |
| Size (bytes) | 641,620,800 | 82,428,480 |
| Size | 611.9 MB | 78.6 MB |
| Events in quadrant A | 3,210,475 | 539,190 |
| Events in quadrant B | 5,097,442 | 541,275 |
| Events in quadrant C | 3,584,731 | 498,682 |
| Events in quadrant D | 7,109,760 | 472,860 |
| Mode SS | |||
|---|---|---|---|
| Quadrant | BADHDUFLAG | Total packets | Discarded packets |
| A | 0 | 128 | 0 |
| B | 0 | 128 | 0 |
| C | 0 | 128 | 0 |
| D | 0 | 128 | 0 |
| Mode M9 | |||
|---|---|---|---|
| Quadrant | BADHDUFLAG | Total packets | Discarded packets |
| A | 0 | 19 | 0 |
| B | 0 | 20 | 0 |
| C | 0 | 20 | 0 |
| D | 0 | 20 | 0 |
| Mode M0 | |||
|---|---|---|---|
| Quadrant | BADHDUFLAG | Total packets | Discarded packets |
| A | 0 | 13348 | 3 |
| B | 0 | 19420 | 2 |
| C | 0 | 14463 | 2 |
| D | 0 | 25691 | 2 |
| Quadrant | Total seconds | Saturated seconds | Saturation percentage |
|---|---|---|---|
| A | 6363 | 14 | 0.220022% |
| B | 6363 | 56 | 0.880088% |
| C | 6363 | 170 | 2.671696% |
| D | 6363 | 347 | 5.453402% |
Noise dominated data is calculated using 1-second bins in cleaned event files. If a bin has >2000 counts, and if more than 50% of those come from <1% of pixels, then it is considered to be noise-dominated and hence unusable.
| Quadrant | # 1 sec bins | Bins with >0 counts | Bins with >2000 counts | High rate bins dominated by noise | Noise dominated (total time) | Noise dominated (detector-on time) | Marked lightcurve |
|---|---|---|---|---|---|---|---|
| A | 7568 | 6364 | 0 | 0 | 0.00% | 0.00% | 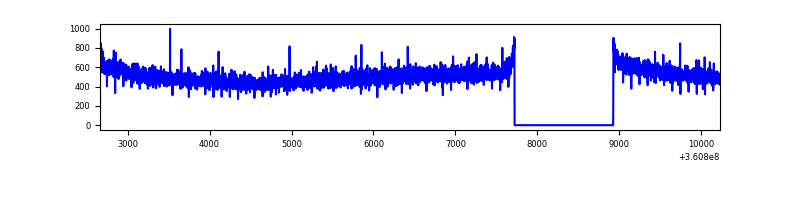 |
| B | 7568 | 6364 | 8 | 8 | 0.11% | 0.13% | 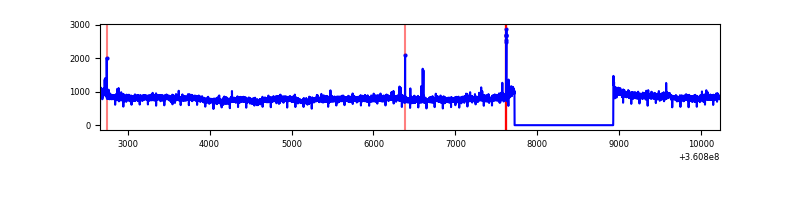 |
| C | 7568 | 6364 | 91 | 91 | 1.20% | 1.43% |  |
| D | 7568 | 6363 | 675 | 675 | 8.92% | 10.61% | 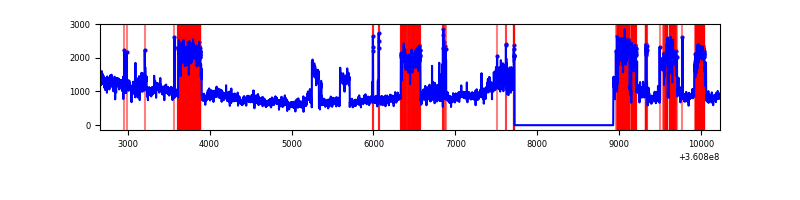 |
Top three noisy pixels from each quadrant. If the there are fewer than three noisy pixels in the level2.evt file, extra rows are filled as -1
| Pixel properties | Quadrant properties | ||||||
|---|---|---|---|---|---|---|---|
| Quadrant | DetID | PixID | Counts | Sigma | Mean | Median | Sigma |
| A | 13 | 254 | 12174 | 68.88 | 830 | 817 | 164.9 |
| A | 3 | 137 | 7899 | 42.95 | 830 | 817 | 164.9 |
| A | 0 | 226 | 7269 | 39.13 | 830 | 817 | 164.9 |
| B | 6 | 159 | 1800666 | 11581.53 | 824 | 806 | 155.4 |
| B | 0 | 190 | 19974 | 123.34 | 824 | 806 | 155.4 |
| B | 12 | 111 | 18901 | 116.44 | 824 | 806 | 155.4 |
| C | 0 | 10 | 326739 | 1799.95 | 779 | 786 | 181.1 |
| C | 14 | 238 | 126936 | 696.61 | 779 | 786 | 181.1 |
| C | 3 | 233 | 54077 | 294.28 | 779 | 786 | 181.1 |
| D | 8 | 195 | 3933607 | 19298.16 | 769 | 756 | 203.8 |
| D | 13 | 249 | 98349 | 478.88 | 769 | 756 | 203.8 |
| D | 2 | 250 | 85439 | 415.53 | 769 | 756 | 203.8 |
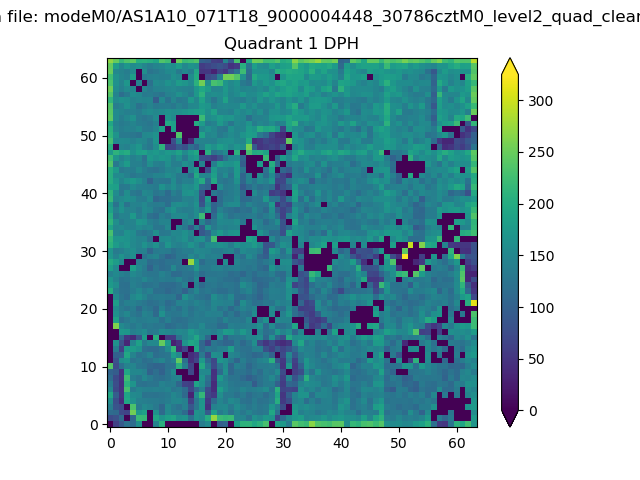
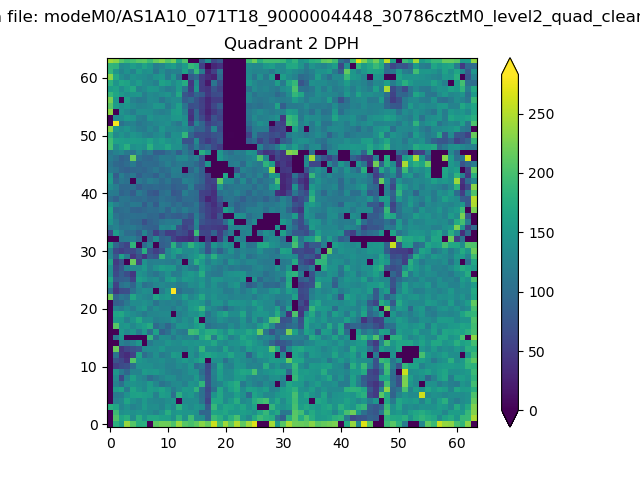
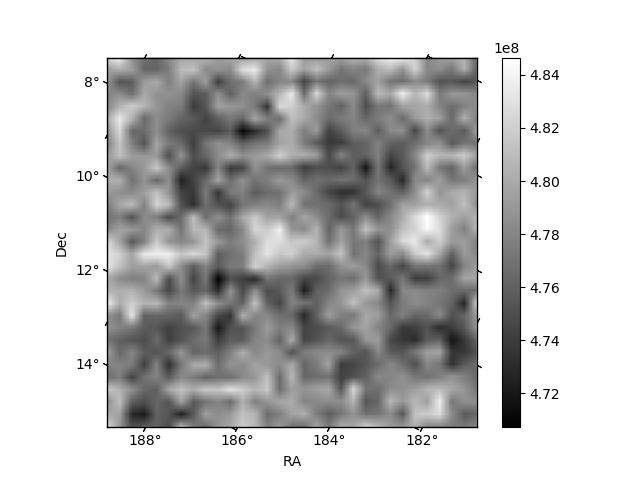
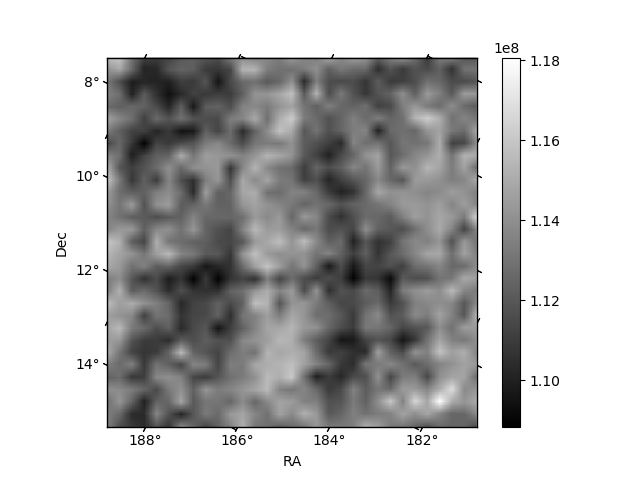
Histogram calculated using DETX and DETY for each event in the final _common_clean file
| Quadrant A | 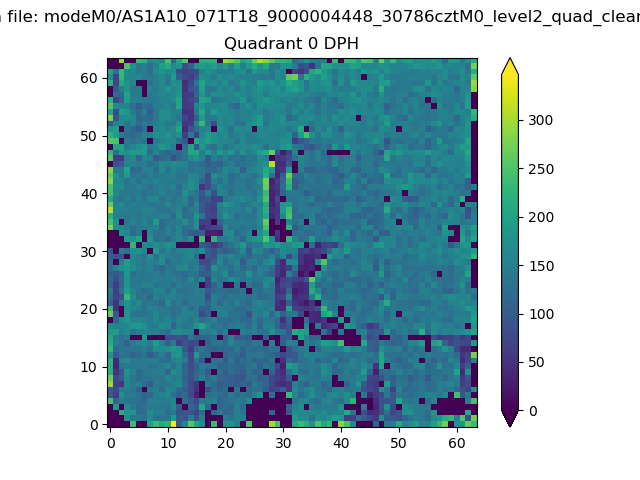 |
 |
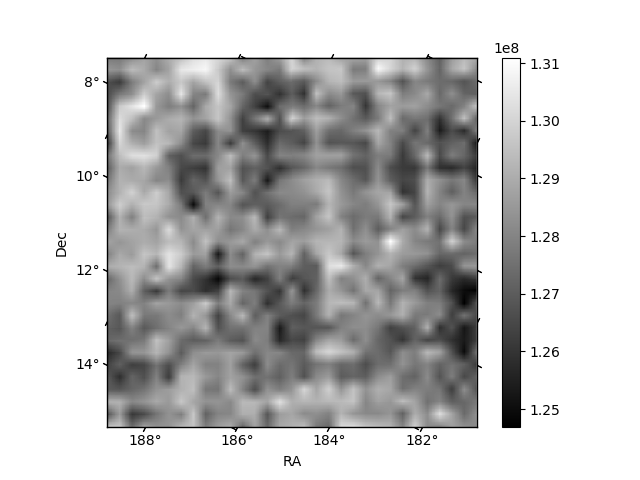
Quadrant B |
|---|---|---|---|
| Quadrant D | 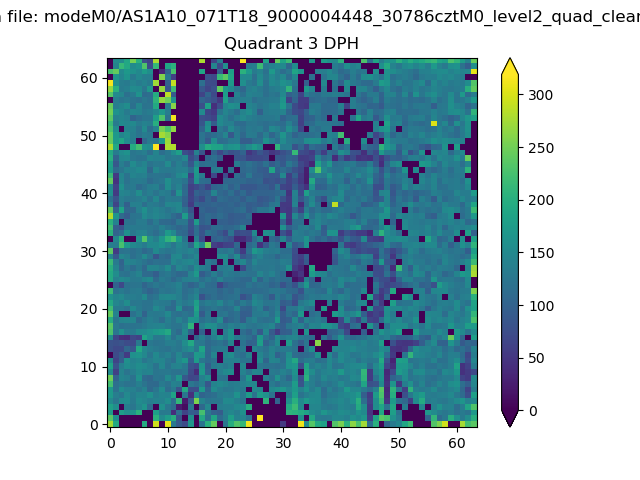 |
 |
Quadrant C |
| Plot type | Count rate plots | Images |
|---|---|---|
| Comparison with Poisson distribution Blue bars denote a histogram of data divided into 1 sec bins. Red curve is a Poisson curve with rate = median count rate of data. |
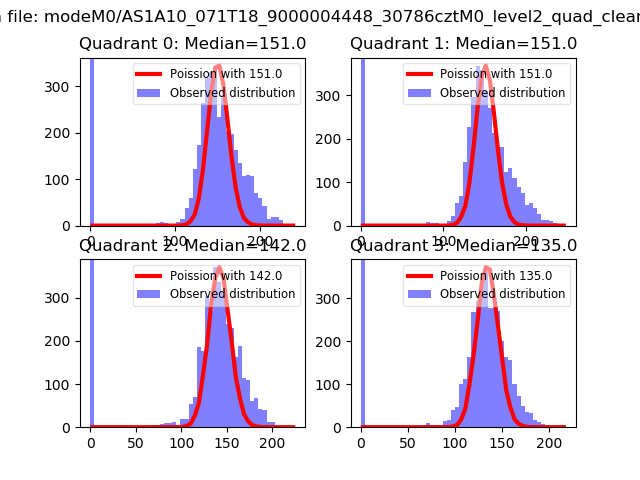 |
 |
| Quadrant-wise count rates Data is divided into 100 sec bins |
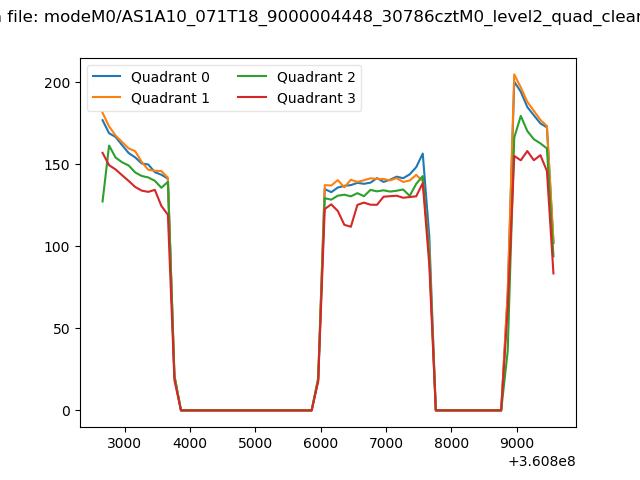 |
|
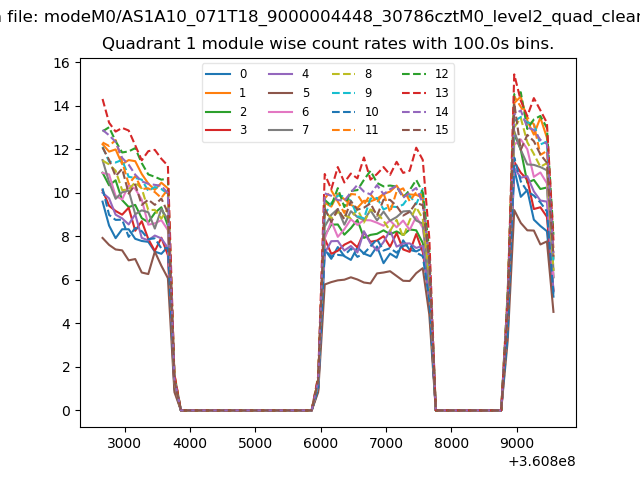
| Module-wise count rates for Quadrant A Data is divided into 100 sec bins |
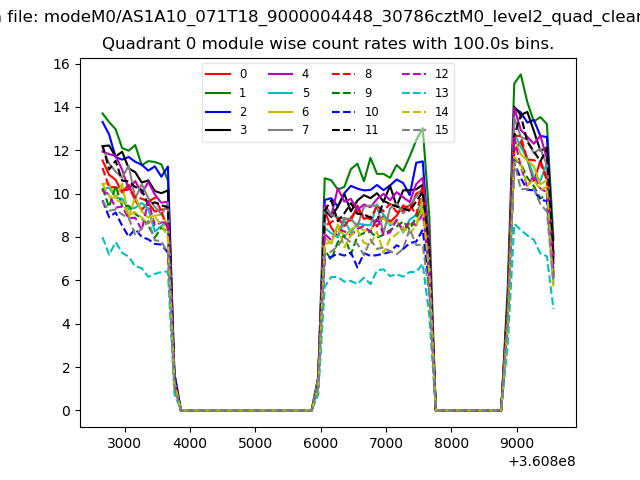 |
 |
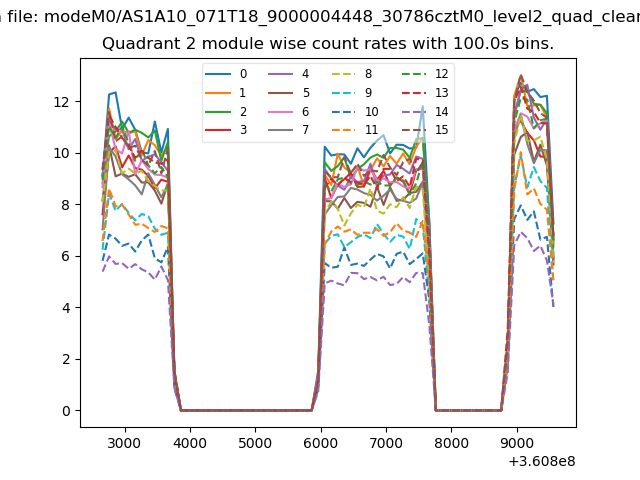
| Module-wise count rates for Quadrant B Data is divided into 100 sec bins |
 |
 |
| Module-wise count rates for Quadrant C Data is divided into 100 sec bins |
 |
 |
| Module-wise count rates for Quadrant D Data is divided into 100 sec bins |
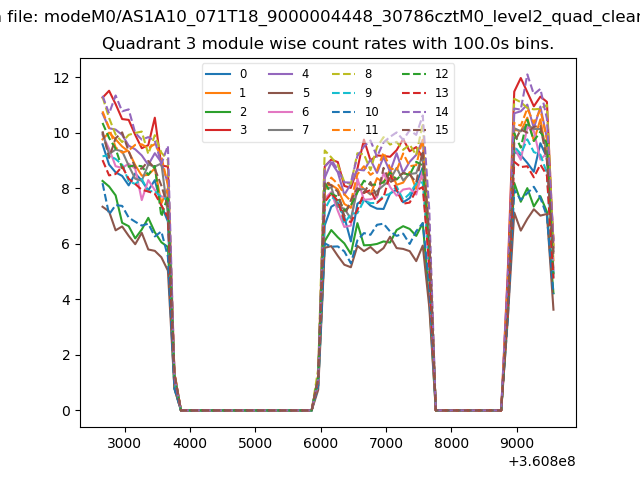 |
 |
| Parameter | Plot |
|---|---|
| CZT HV Monitor | 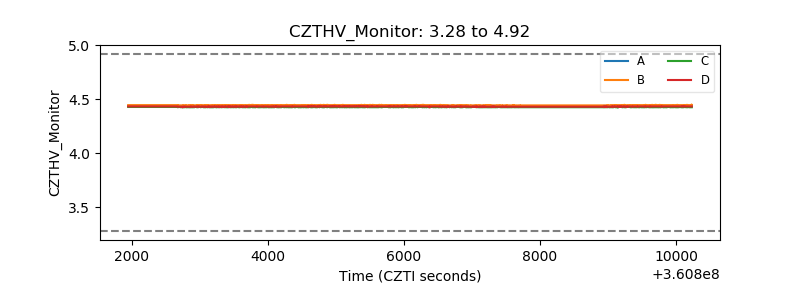 |
| D_VDD | 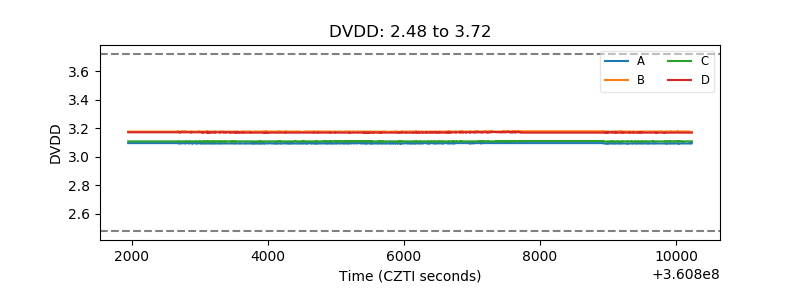 |
| Temperature 1 | 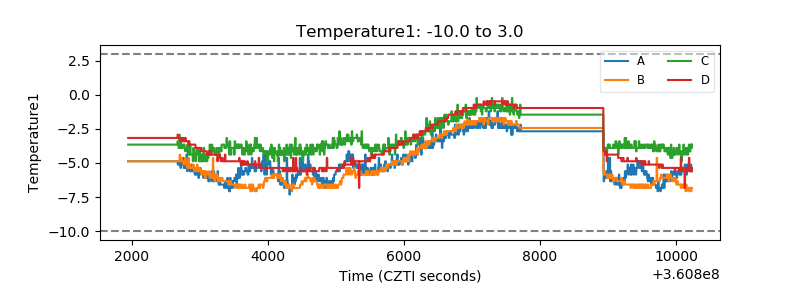 |
| Veto HV Monitor | 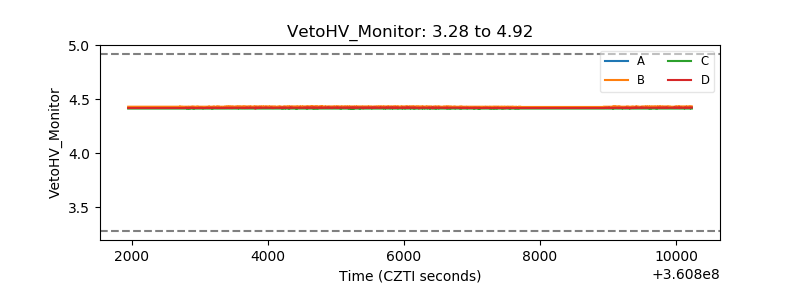 |
| Veto LLD |  |
| Alpha Counter |  |
| _CPM_Rate | 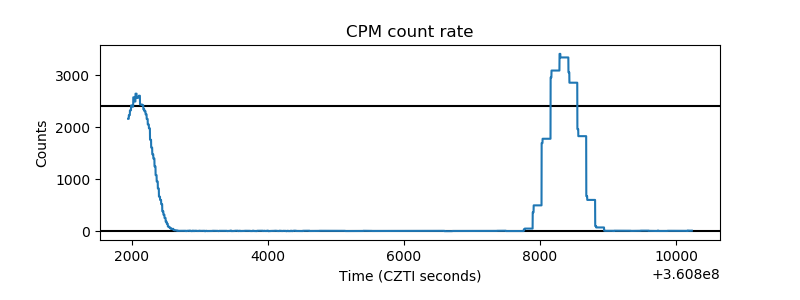 |
| CZT Counter | 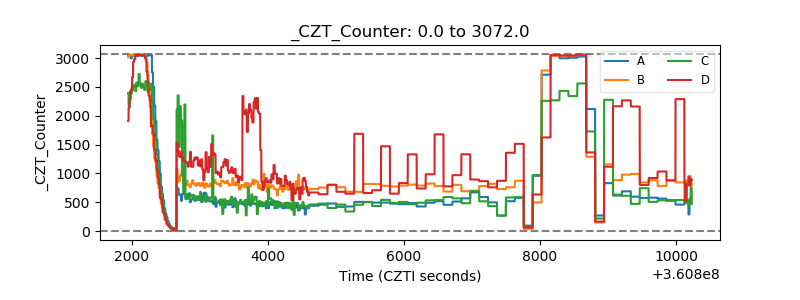 |
| +2.5 Volts monitor |  |
| +5 Volts monitor |  |
| _ROLL_ROT | 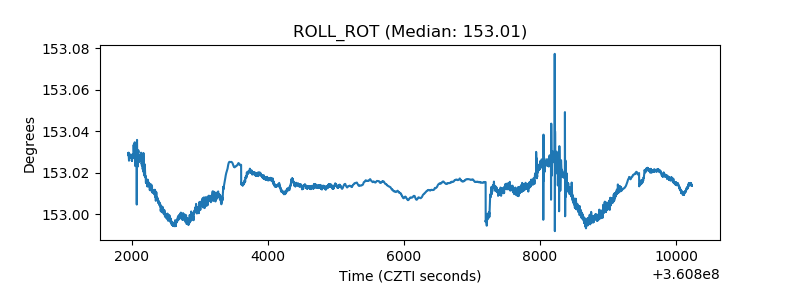 |
| _Roll_DEC | 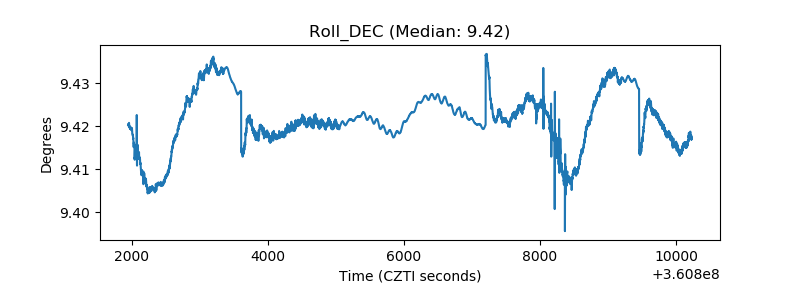 |
| _Roll_RA |  |
| Veto Counter | 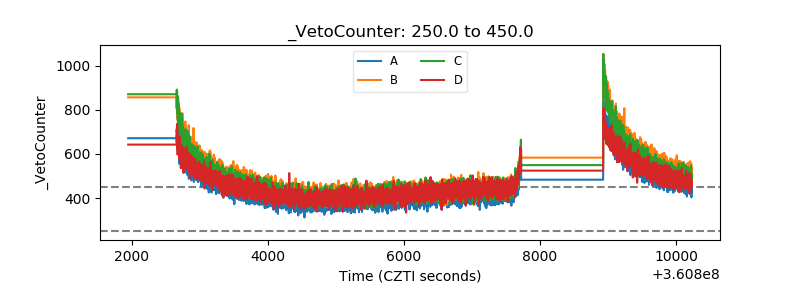 |