| Param | Original file | Final file |
|---|---|---|
| Filename | modeM0/AS1A10_071T18_9000004448_30787cztM0_level2.evt | modeM0/AS1A10_071T18_9000004448_30787cztM0_level2_quad_clean.evt |
| Size (bytes) | 656,210,880 | 74,808,000 |
| Size | 625.8 MB | 71.3 MB |
| Events in quadrant A | 3,349,459 | 481,480 |
| Events in quadrant B | 5,343,093 | 482,360 |
| Events in quadrant C | 3,746,023 | 443,598 |
| Events in quadrant D | 7,010,935 | 418,897 |
| Mode SS | |||
|---|---|---|---|
| Quadrant | BADHDUFLAG | Total packets | Discarded packets |
| A | 0 | 128 | 0 |
| B | 0 | 128 | 0 |
| C | 0 | 128 | 0 |
| D | 0 | 128 | 0 |
| Mode M9 | |||
|---|---|---|---|
| Quadrant | BADHDUFLAG | Total packets | Discarded packets |
| A | 0 | 14 | 0 |
| B | 0 | 15 | 0 |
| C | 0 | 15 | 0 |
| D | 0 | 15 | 0 |
| Mode M0 | |||
|---|---|---|---|
| Quadrant | BADHDUFLAG | Total packets | Discarded packets |
| A | 0 | 13562 | 2 |
| B | 0 | 19951 | 2 |
| C | 0 | 14869 | 2 |
| D | 0 | 25181 | 2 |
| Quadrant | Total seconds | Saturated seconds | Saturation percentage |
|---|---|---|---|
| A | 6285 | 26 | 0.413683% |
| B | 6285 | 137 | 2.179793% |
| C | 6285 | 174 | 2.768496% |
| D | 6285 | 350 | 5.568815% |
Noise dominated data is calculated using 1-second bins in cleaned event files. If a bin has >2000 counts, and if more than 50% of those come from <1% of pixels, then it is considered to be noise-dominated and hence unusable.
| Quadrant | # 1 sec bins | Bins with >0 counts | Bins with >2000 counts | High rate bins dominated by noise | Noise dominated (total time) | Noise dominated (detector-on time) | Marked lightcurve |
|---|---|---|---|---|---|---|---|
| A | 7560 | 6285 | 0 | 0 | 0.00% | 0.00% |  |
| B | 7560 | 6285 | 44 | 44 | 0.58% | 0.70% |  |
| C | 7560 | 6285 | 68 | 68 | 0.90% | 1.08% |  |
| D | 7560 | 6285 | 513 | 513 | 6.79% | 8.16% |  |
Top three noisy pixels from each quadrant. If the there are fewer than three noisy pixels in the level2.evt file, extra rows are filled as -1
| Pixel properties | Quadrant properties | ||||||
|---|---|---|---|---|---|---|---|
| Quadrant | DetID | PixID | Counts | Sigma | Mean | Median | Sigma |
| A | 13 | 254 | 11590 | 62.32 | 868 | 854 | 172.3 |
| A | 3 | 137 | 8082 | 41.96 | 868 | 854 | 172.3 |
| A | 0 | 226 | 7391 | 37.95 | 868 | 854 | 172.3 |
| B | 6 | 159 | 1724208 | 10598.85 | 862 | 843 | 162.6 |
| B | 10 | 247 | 194369 | 1190.2 | 862 | 843 | 162.6 |
| B | 12 | 111 | 19181 | 112.78 | 862 | 843 | 162.6 |
| C | 0 | 10 | 247141 | 1320.15 | 807 | 813 | 186.6 |
| C | 3 | 233 | 196137 | 1046.81 | 807 | 813 | 186.6 |
| C | 14 | 238 | 133397 | 710.56 | 807 | 813 | 186.6 |
| D | 8 | 195 | 3779136 | 18117.97 | 795 | 781 | 208.5 |
| D | 13 | 249 | 108932 | 518.61 | 795 | 781 | 208.5 |
| D | 2 | 250 | 50973 | 240.68 | 795 | 781 | 208.5 |
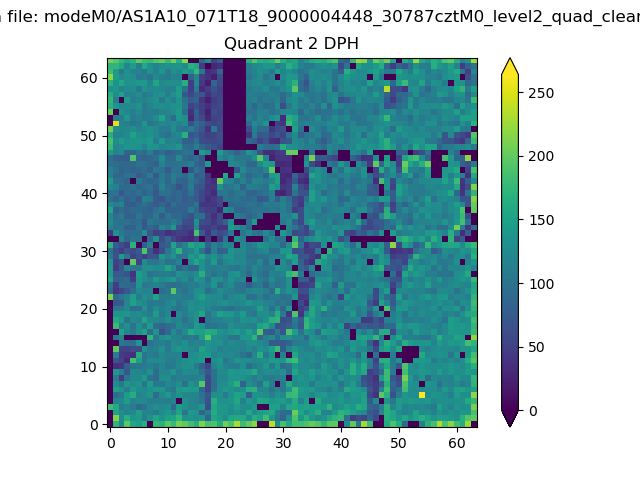
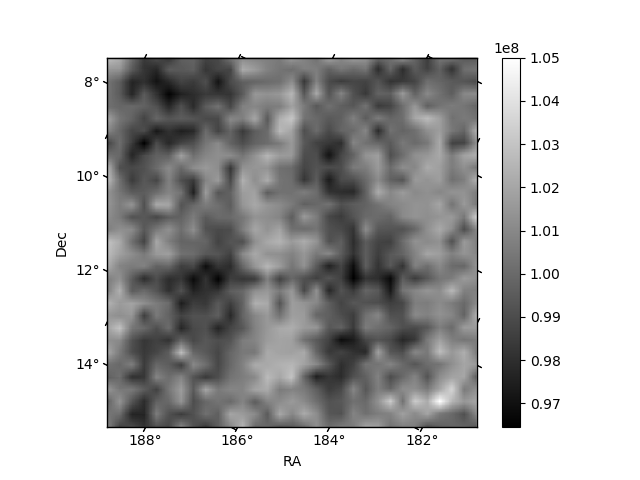
Histogram calculated using DETX and DETY for each event in the final _common_clean file
| Quadrant A |  |
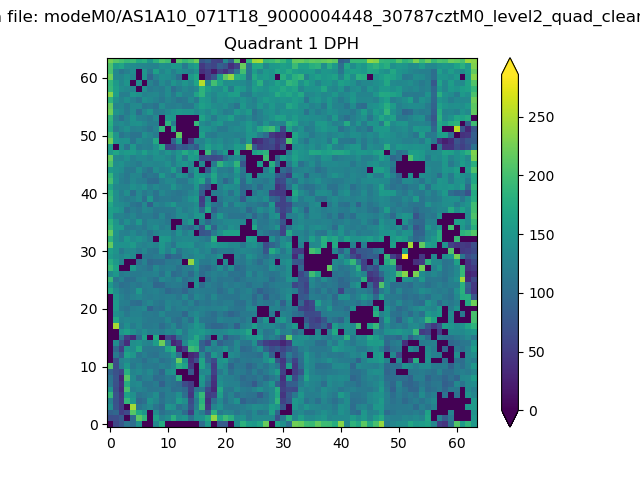 |
Quadrant B |
|---|---|---|---|
| Quadrant D | 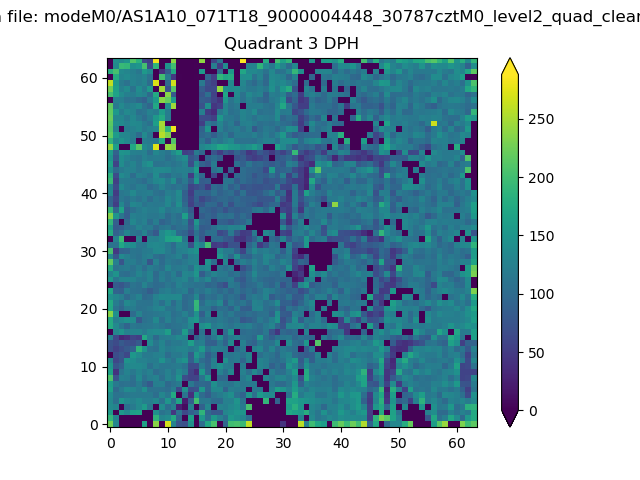 |
 |
Quadrant C |
| Plot type | Count rate plots | Images |
|---|---|---|
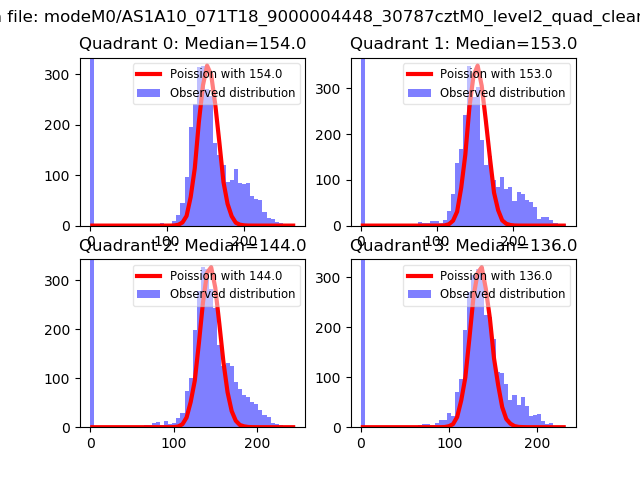
| Comparison with Poisson distribution Blue bars denote a histogram of data divided into 1 sec bins. Red curve is a Poisson curve with rate = median count rate of data. |
 |
 |
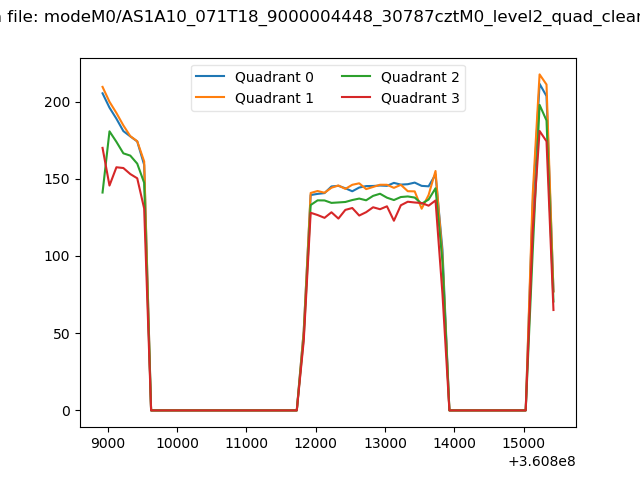
| Quadrant-wise count rates Data is divided into 100 sec bins |
 |
|
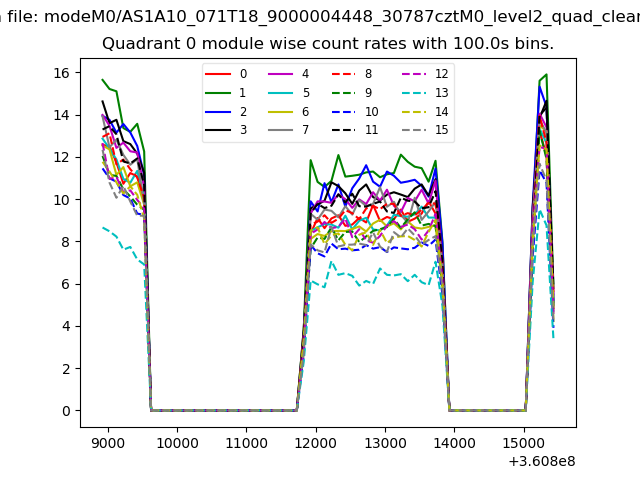
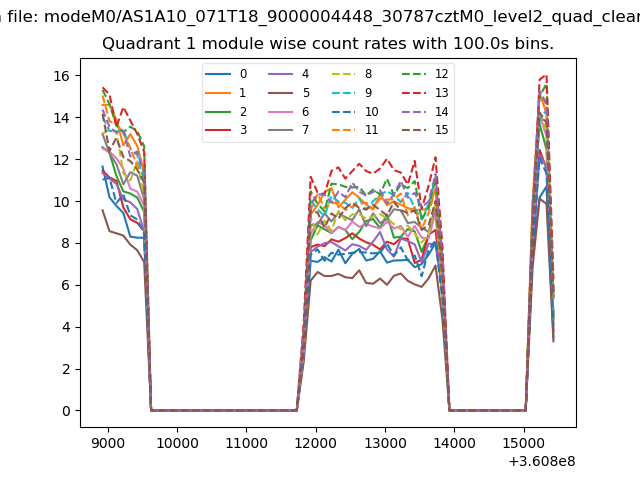
| Module-wise count rates for Quadrant A Data is divided into 100 sec bins |
 |
 |
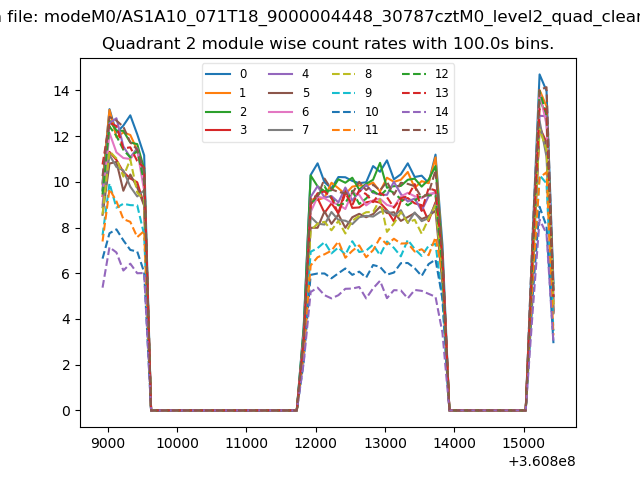
| Module-wise count rates for Quadrant B Data is divided into 100 sec bins |
 |
 |
| Module-wise count rates for Quadrant C Data is divided into 100 sec bins |
 |
 |
| Module-wise count rates for Quadrant D Data is divided into 100 sec bins |
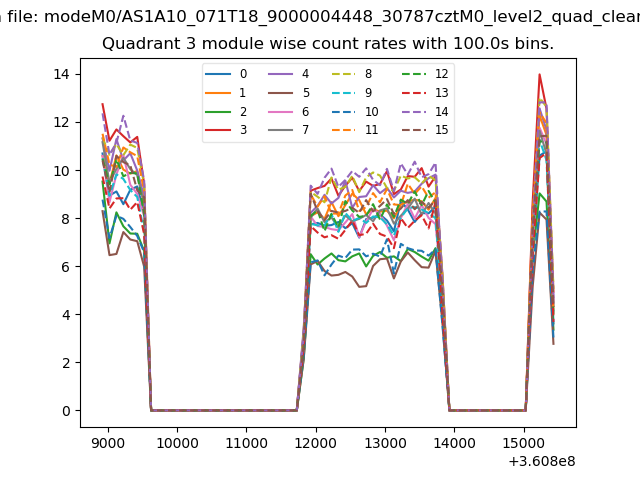 |
 |
| Parameter | Plot |
|---|---|
| CZT HV Monitor | 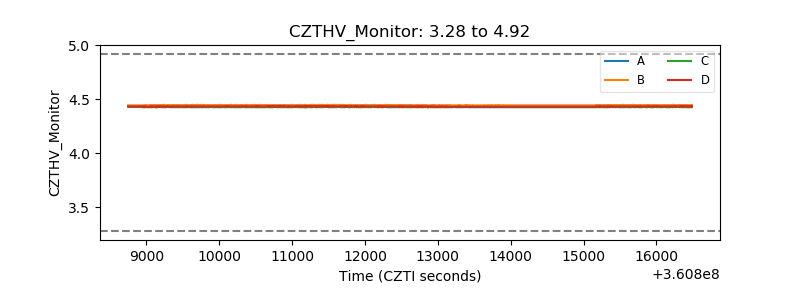 |
| D_VDD | 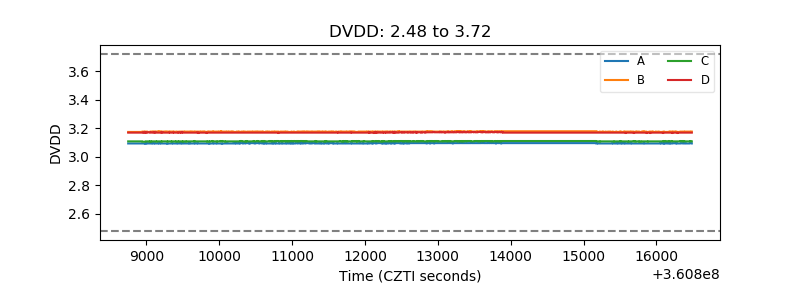 |
| Temperature 1 | 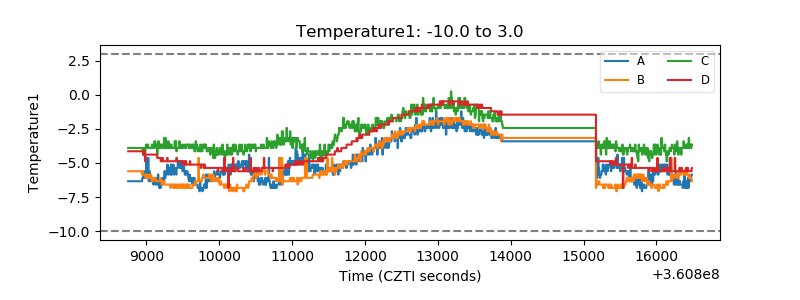 |
| Veto HV Monitor | 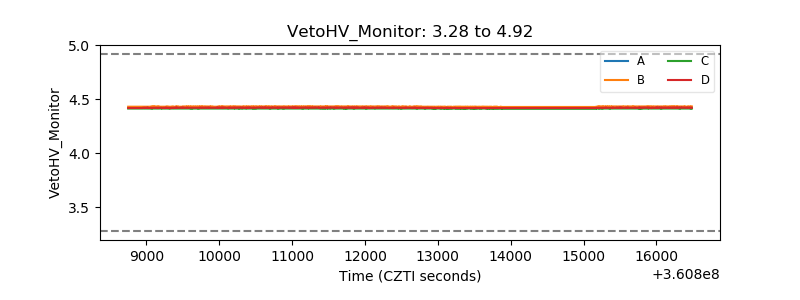 |
| Veto LLD | 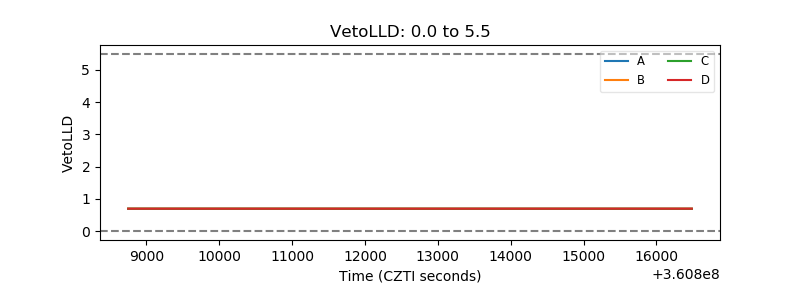 |
| Alpha Counter | 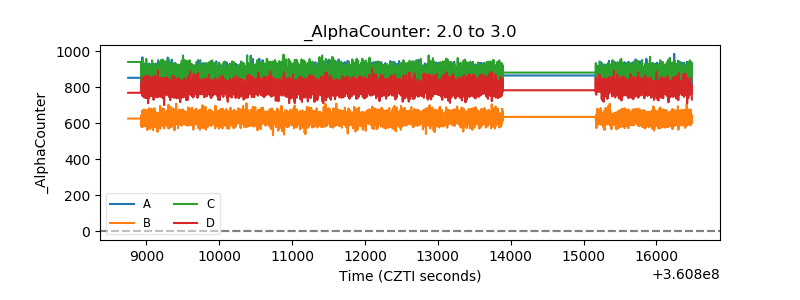 |
| _CPM_Rate |  |
| CZT Counter | 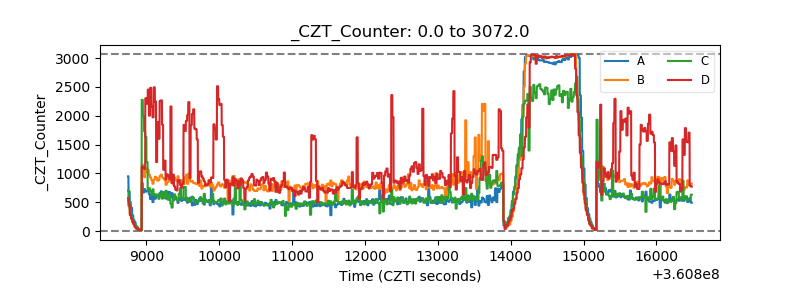 |
| +2.5 Volts monitor |  |
| +5 Volts monitor | 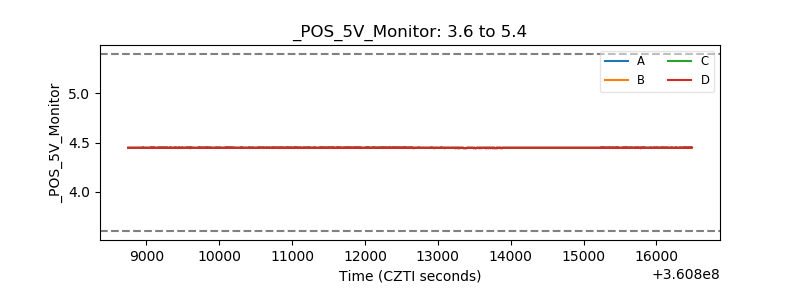 |
| _ROLL_ROT | 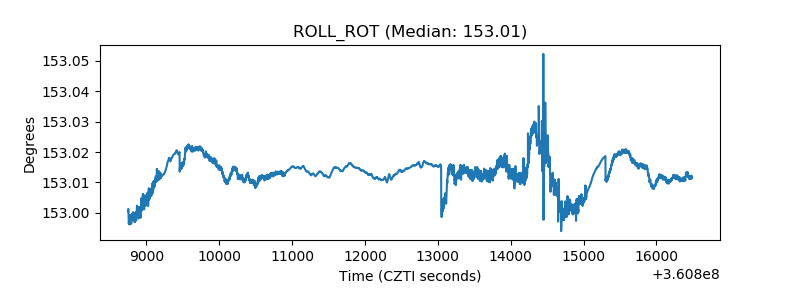 |
| _Roll_DEC | 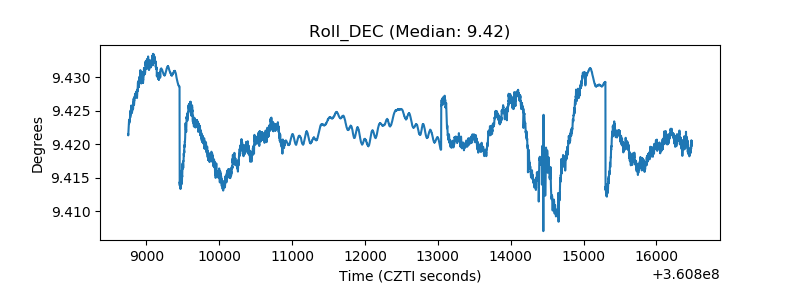 |
| _Roll_RA | 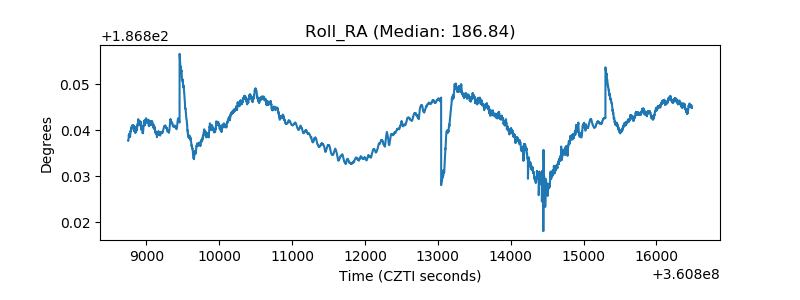 |
| Veto Counter | 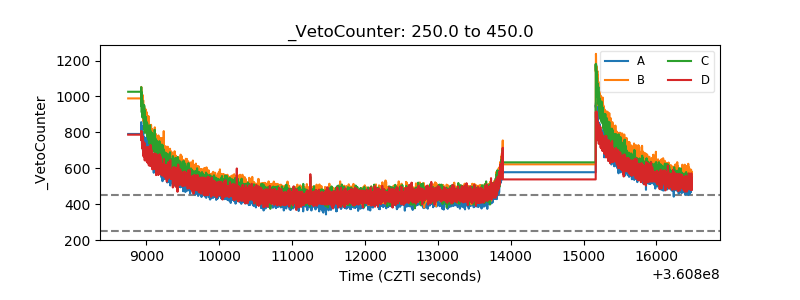 |