| Param | Original file | Final file |
|---|---|---|
| Filename | modeM0/AS1A10_071T18_9000004448_30789cztM0_level2.evt | modeM0/AS1A10_071T18_9000004448_30789cztM0_level2_quad_clean.evt |
| Size (bytes) | 655,580,160 | 67,896,000 |
| Size | 625.2 MB | 64.8 MB |
| Events in quadrant A | 3,524,494 | 422,382 |
| Events in quadrant B | 5,286,035 | 422,063 |
| Events in quadrant C | 4,651,311 | 390,265 |
| Events in quadrant D | 5,963,042 | 376,604 |
| Mode SS | |||
|---|---|---|---|
| Quadrant | BADHDUFLAG | Total packets | Discarded packets |
| A | 0 | 128 | 0 |
| B | 0 | 128 | 0 |
| C | 0 | 128 | 0 |
| D | 0 | 128 | 0 |
| Mode M9 | |||
|---|---|---|---|
| Quadrant | BADHDUFLAG | Total packets | Discarded packets |
| A | 0 | 19 | 0 |
| B | 0 | 20 | 0 |
| C | 0 | 20 | 0 |
| D | 0 | 20 | 0 |
| Mode M0 | |||
|---|---|---|---|
| Quadrant | BADHDUFLAG | Total packets | Discarded packets |
| A | 0 | 14022 | 2 |
| B | 0 | 19643 | 2 |
| C | 0 | 18479 | 5 |
| D | 0 | 21803 | 2 |
| Quadrant | Total seconds | Saturated seconds | Saturation percentage |
|---|---|---|---|
| A | 6372 | 73 | 1.145637% |
| B | 6372 | 133 | 2.087257% |
| C | 6371 | 298 | 4.677445% |
| D | 6371 | 266 | 4.175169% |
Noise dominated data is calculated using 1-second bins in cleaned event files. If a bin has >2000 counts, and if more than 50% of those come from <1% of pixels, then it is considered to be noise-dominated and hence unusable.
| Quadrant | # 1 sec bins | Bins with >0 counts | Bins with >2000 counts | High rate bins dominated by noise | Noise dominated (total time) | Noise dominated (detector-on time) | Marked lightcurve |
|---|---|---|---|---|---|---|---|
| A | 7682 | 6372 | 0 | 0 | 0.00% | 0.00% | 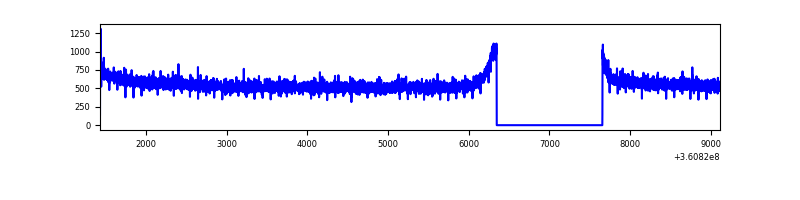 |
| B | 7682 | 6372 | 1 | 1 | 0.01% | 0.02% | 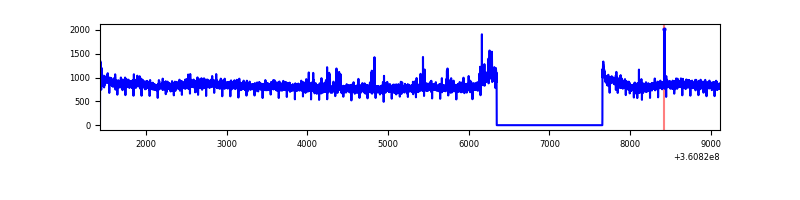 |
| C | 7681 | 6371 | 101 | 101 | 1.31% | 1.59% | 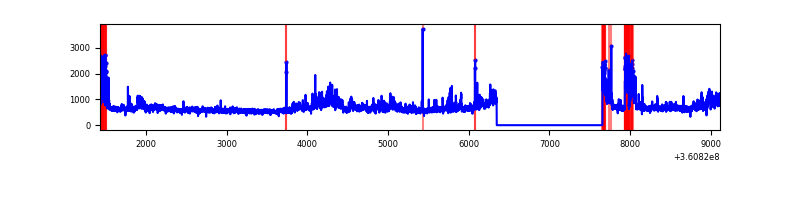 |
| D | 7681 | 6371 | 188 | 188 | 2.45% | 2.95% | 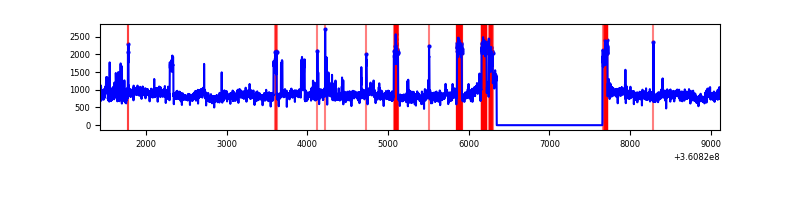 |
Top three noisy pixels from each quadrant. If the there are fewer than three noisy pixels in the level2.evt file, extra rows are filled as -1
| Pixel properties | Quadrant properties | ||||||
|---|---|---|---|---|---|---|---|
| Quadrant | DetID | PixID | Counts | Sigma | Mean | Median | Sigma |
| A | 13 | 254 | 11242 | 57.29 | 914 | 900 | 180.5 |
| A | 3 | 137 | 8456 | 41.86 | 914 | 900 | 180.5 |
| A | 0 | 226 | 7775 | 38.08 | 914 | 900 | 180.5 |
| B | 6 | 159 | 1692307 | 10029.77 | 901 | 881 | 168.6 |
| B | 0 | 190 | 42696 | 247.95 | 901 | 881 | 168.6 |
| B | 12 | 111 | 20128 | 114.13 | 901 | 881 | 168.6 |
| C | 3 | 233 | 839241 | 4290.32 | 839 | 848 | 195.4 |
| C | 0 | 10 | 385096 | 1966.32 | 839 | 848 | 195.4 |
| C | 14 | 238 | 138714 | 705.5 | 839 | 848 | 195.4 |
| D | 8 | 195 | 2694275 | 12456.93 | 846 | 831 | 216.2 |
| D | 2 | 250 | 26956 | 120.83 | 846 | 831 | 216.2 |
| D | 2 | 234 | 23775 | 106.11 | 846 | 831 | 216.2 |
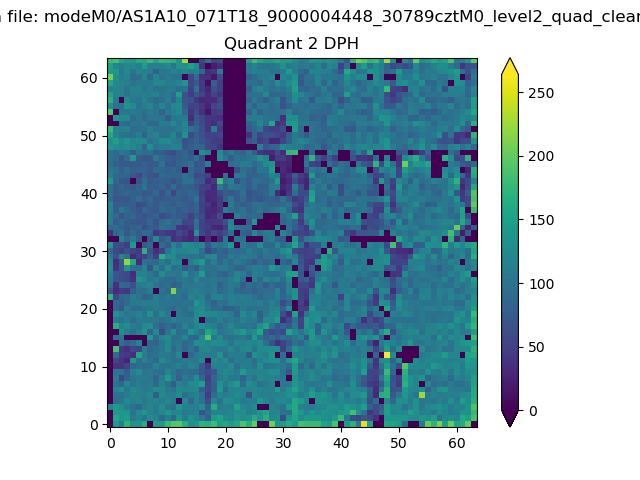
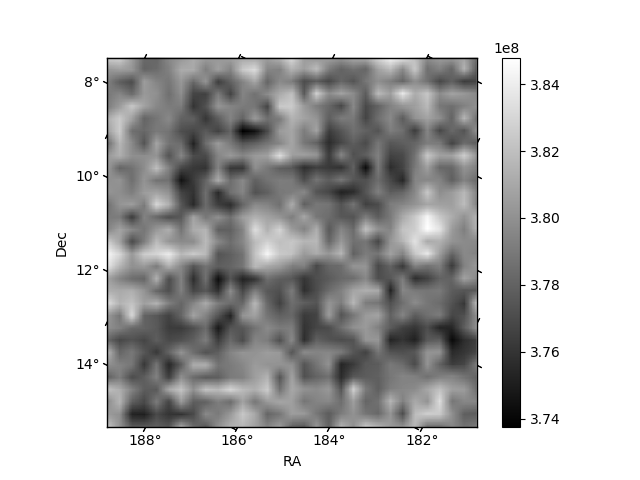
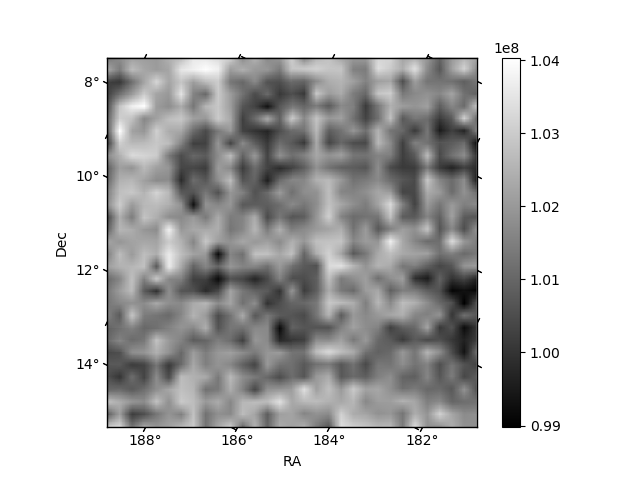
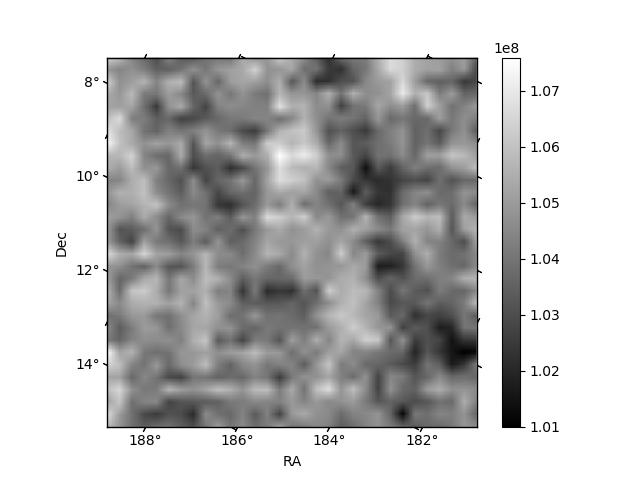
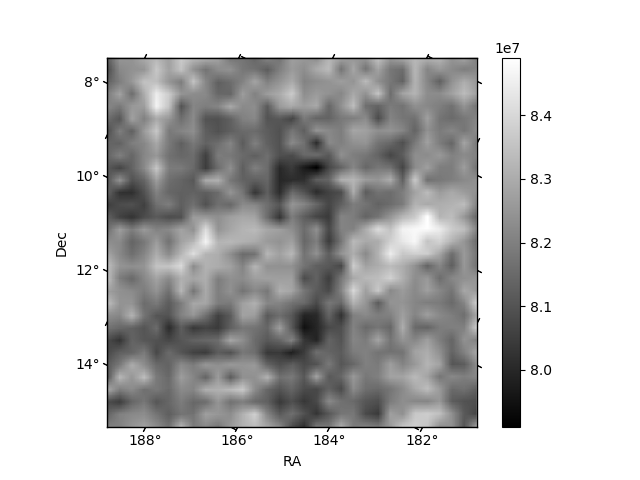
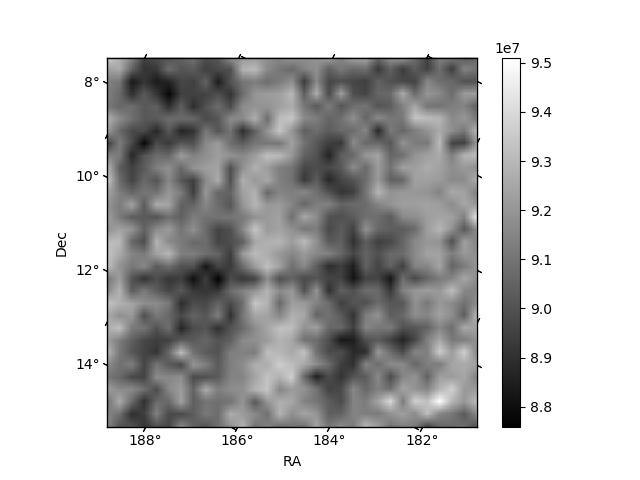
Histogram calculated using DETX and DETY for each event in the final _common_clean file
| Quadrant A | 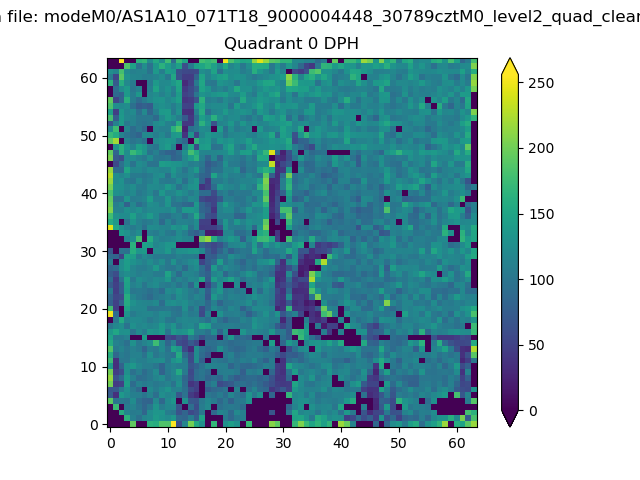 |
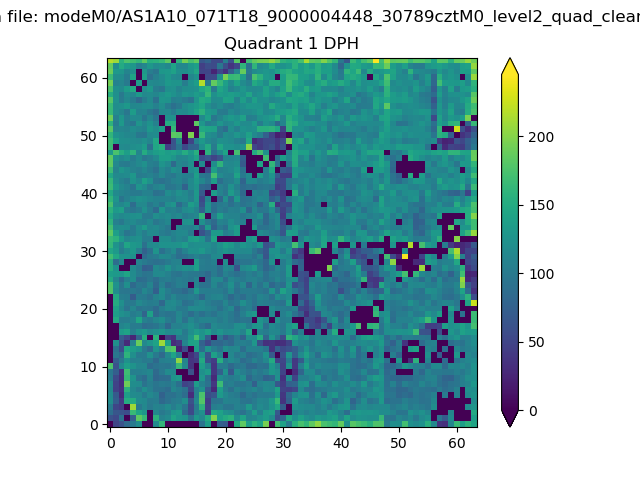 |
Quadrant B |
|---|---|---|---|
| Quadrant D | 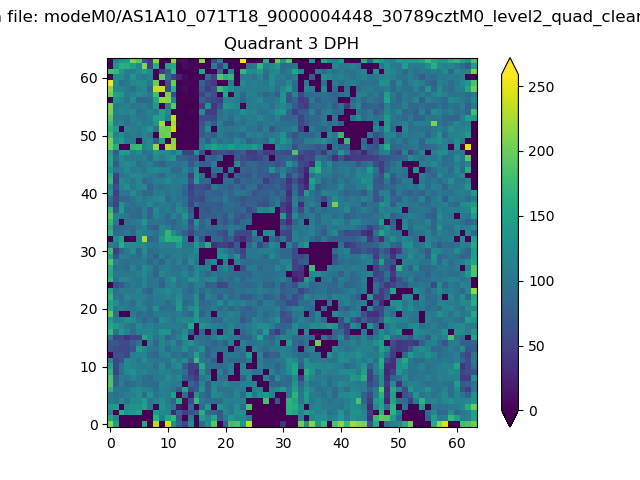 |
 |
Quadrant C |
| Plot type | Count rate plots | Images |
|---|---|---|
| Comparison with Poisson distribution Blue bars denote a histogram of data divided into 1 sec bins. Red curve is a Poisson curve with rate = median count rate of data. |
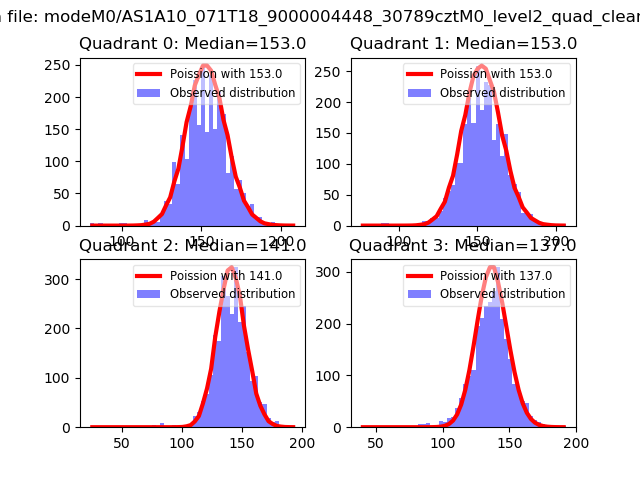 |
 |
| Quadrant-wise count rates Data is divided into 100 sec bins |
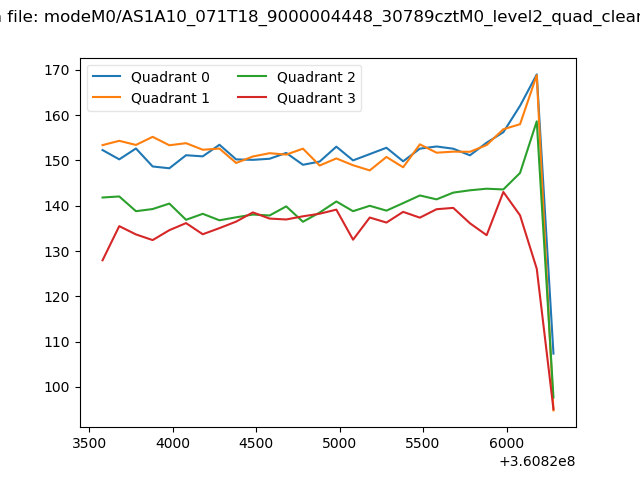 |
|
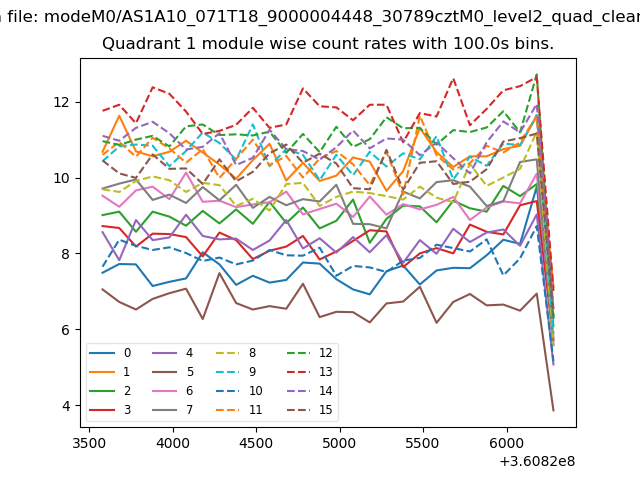
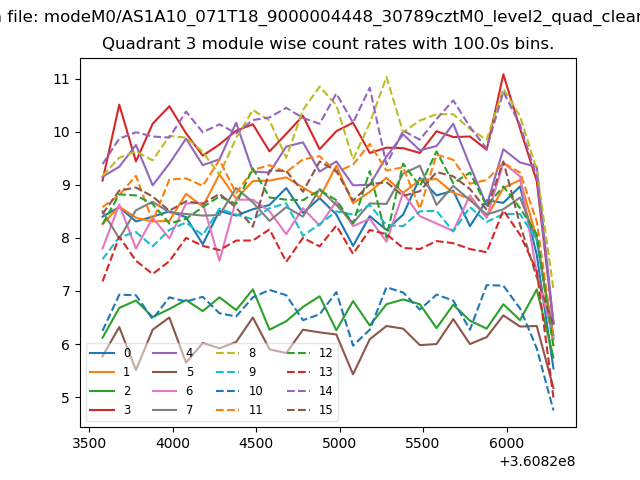
| Module-wise count rates for Quadrant A Data is divided into 100 sec bins |
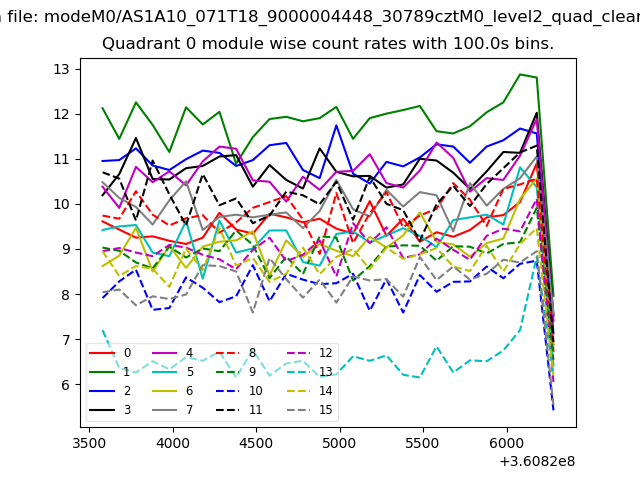 |
 |
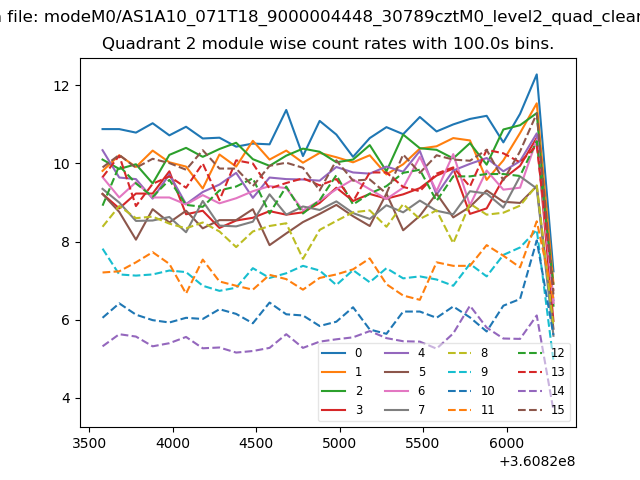
| Module-wise count rates for Quadrant B Data is divided into 100 sec bins |
 |
 |
| Module-wise count rates for Quadrant C Data is divided into 100 sec bins |
 |
 |
| Module-wise count rates for Quadrant D Data is divided into 100 sec bins |
 |
 |
| Parameter | Plot |
|---|---|
| CZT HV Monitor | 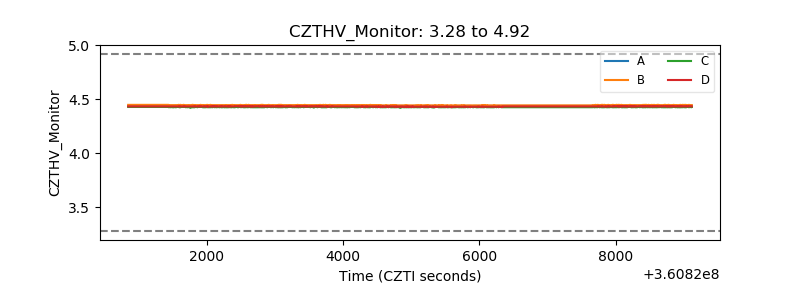 |
| D_VDD | 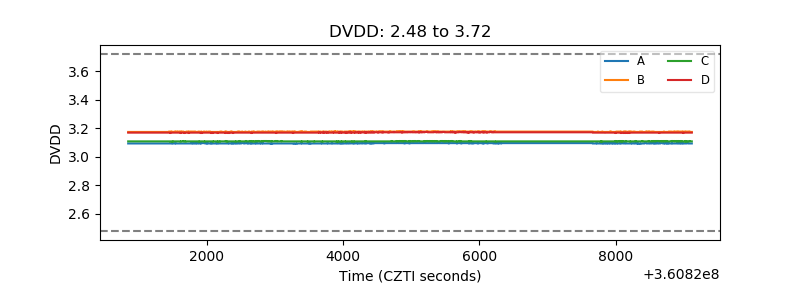 |
| Temperature 1 | 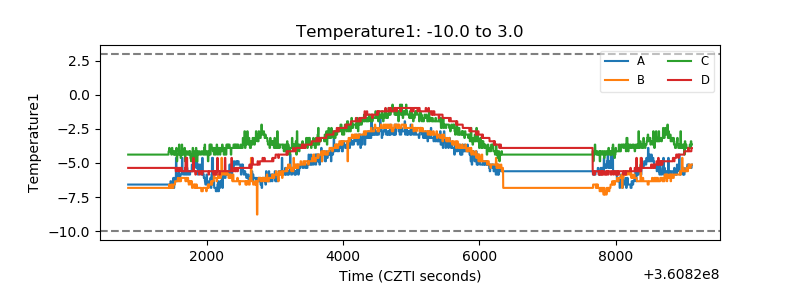 |
| Veto HV Monitor | 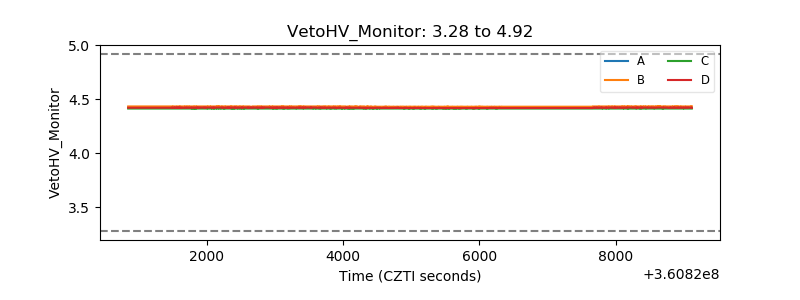 |
| Veto LLD | 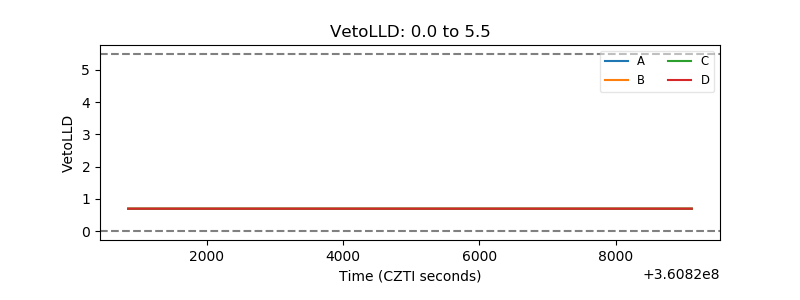 |
| Alpha Counter | 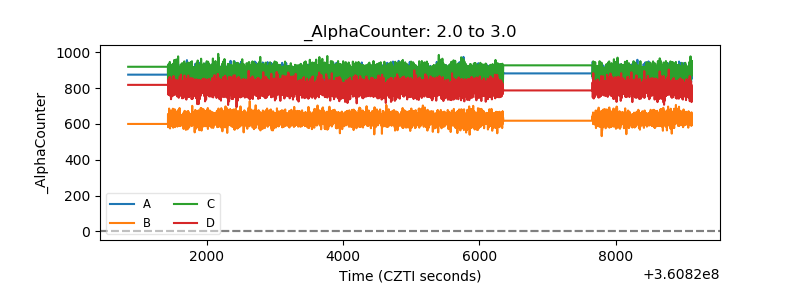 |
| _CPM_Rate | 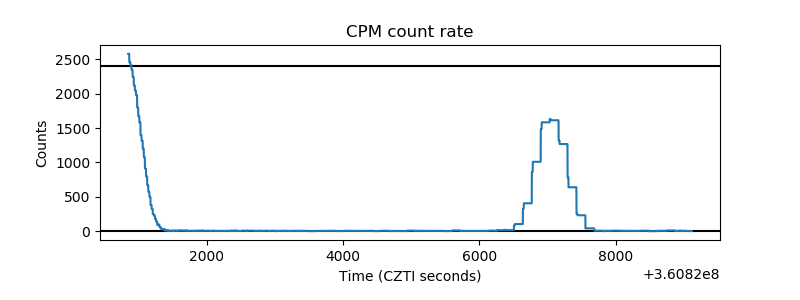 |
| CZT Counter | 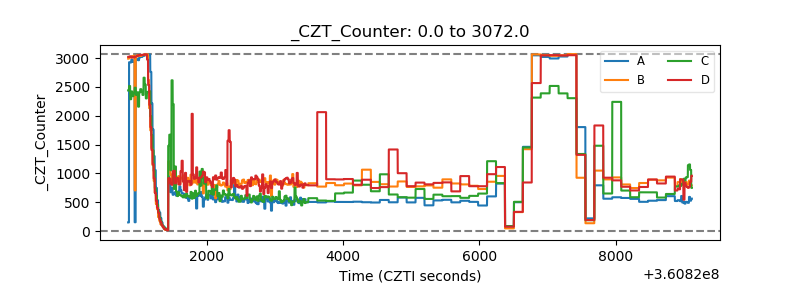 |
| +2.5 Volts monitor | 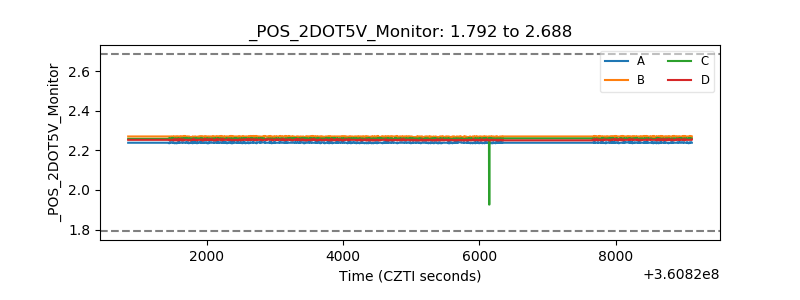 |
| +5 Volts monitor | 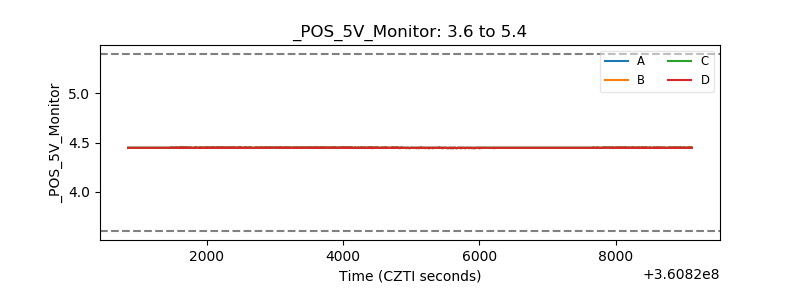 |
| _ROLL_ROT | 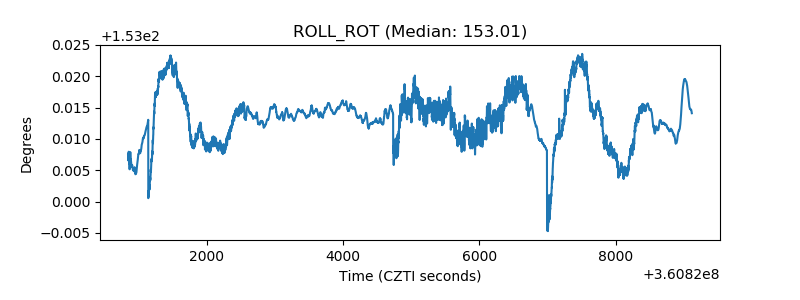 |
| _Roll_DEC | 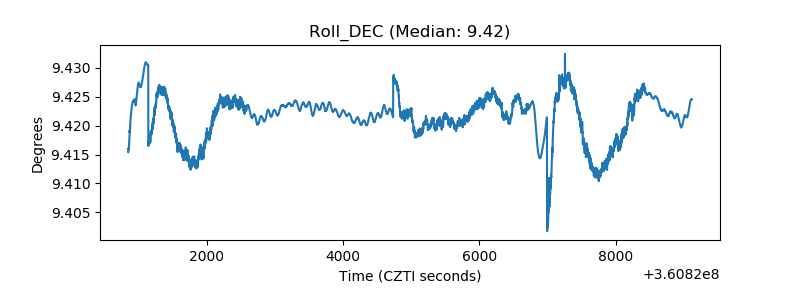 |
| _Roll_RA | 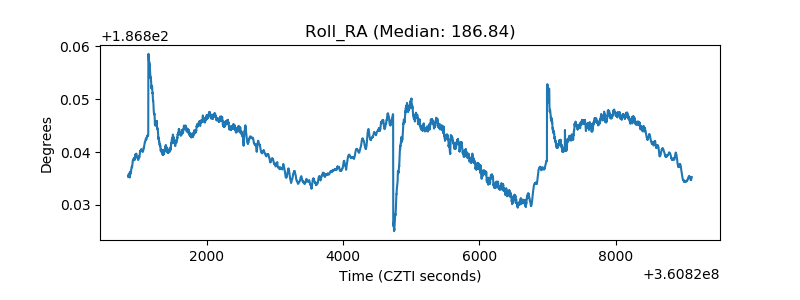 |
| Veto Counter | 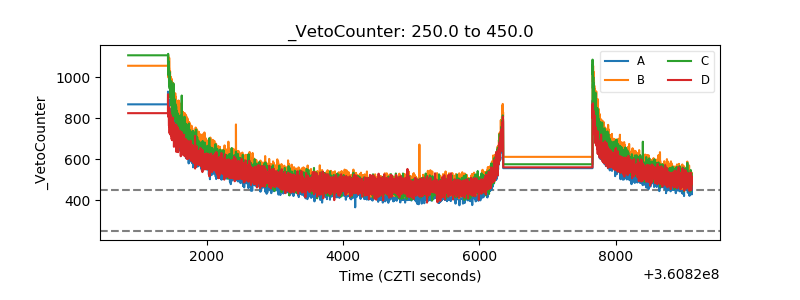 |