| Param | Original file | Final file |
|---|---|---|
| Filename | modeM0/AS1A10_071T18_9000004448_30790cztM0_level2.evt | modeM0/AS1A10_071T18_9000004448_30790cztM0_level2_quad_clean.evt |
| Size (bytes) | 674,357,760 | 77,520,960 |
| Size | 643.1 MB | 73.9 MB |
| Events in quadrant A | 3,494,049 | 496,140 |
| Events in quadrant B | 5,251,474 | 496,211 |
| Events in quadrant C | 4,836,221 | 458,515 |
| Events in quadrant D | 6,403,298 | 443,687 |
| Mode SS | |||
|---|---|---|---|
| Quadrant | BADHDUFLAG | Total packets | Discarded packets |
| A | 0 | 130 | 0 |
| B | 0 | 130 | 0 |
| C | 0 | 130 | 0 |
| D | 0 | 130 | 0 |
| Mode M9 | |||
|---|---|---|---|
| Quadrant | BADHDUFLAG | Total packets | Discarded packets |
| A | 0 | 12 | 0 |
| B | 0 | 13 | 0 |
| C | 0 | 13 | 0 |
| D | 0 | 13 | 0 |
| Mode M0 | |||
|---|---|---|---|
| Quadrant | BADHDUFLAG | Total packets | Discarded packets |
| A | 0 | 13977 | 2 |
| B | 0 | 19876 | 2 |
| C | 0 | 19207 | 2 |
| D | 0 | 23348 | 2 |
| Quadrant | Total seconds | Saturated seconds | Saturation percentage |
|---|---|---|---|
| A | 6498 | 117 | 1.800554% |
| B | 6498 | 190 | 2.923977% |
| C | 6498 | 351 | 5.401662% |
| D | 6498 | 355 | 5.463219% |
Noise dominated data is calculated using 1-second bins in cleaned event files. If a bin has >2000 counts, and if more than 50% of those come from <1% of pixels, then it is considered to be noise-dominated and hence unusable.
| Quadrant | # 1 sec bins | Bins with >0 counts | Bins with >2000 counts | High rate bins dominated by noise | Noise dominated (total time) | Noise dominated (detector-on time) | Marked lightcurve |
|---|---|---|---|---|---|---|---|
| A | 7653 | 6498 | 1 | 1 | 0.01% | 0.02% |  |
| B | 7653 | 6498 | 2 | 2 | 0.03% | 0.03% |  |
| C | 7653 | 6498 | 95 | 95 | 1.24% | 1.46% |  |
| D | 7652 | 6497 | 269 | 269 | 3.52% | 4.14% |  |
Top three noisy pixels from each quadrant. If the there are fewer than three noisy pixels in the level2.evt file, extra rows are filled as -1
| Pixel properties | Quadrant properties | ||||||
|---|---|---|---|---|---|---|---|
| Quadrant | DetID | PixID | Counts | Sigma | Mean | Median | Sigma |
| A | 13 | 254 | 11041 | 56.39 | 905 | 892 | 180.0 |
| A | 3 | 137 | 8494 | 42.24 | 905 | 892 | 180.0 |
| A | 0 | 226 | 7671 | 37.67 | 905 | 892 | 180.0 |
| B | 6 | 159 | 1741225 | 10352.39 | 888 | 869 | 168.1 |
| B | 12 | 111 | 20586 | 117.29 | 888 | 869 | 168.1 |
| B | 11 | 111 | 18577 | 105.33 | 888 | 869 | 168.1 |
| C | 3 | 233 | 1000321 | 5148.02 | 834 | 843 | 194.1 |
| C | 0 | 10 | 424198 | 2180.58 | 834 | 843 | 194.1 |
| C | 14 | 238 | 136020 | 696.26 | 834 | 843 | 194.1 |
| D | 8 | 195 | 2850778 | 13210.88 | 845 | 829 | 215.7 |
| D | 12 | 227 | 181233 | 836.26 | 845 | 829 | 215.7 |
| D | 2 | 250 | 56499 | 258.06 | 845 | 829 | 215.7 |
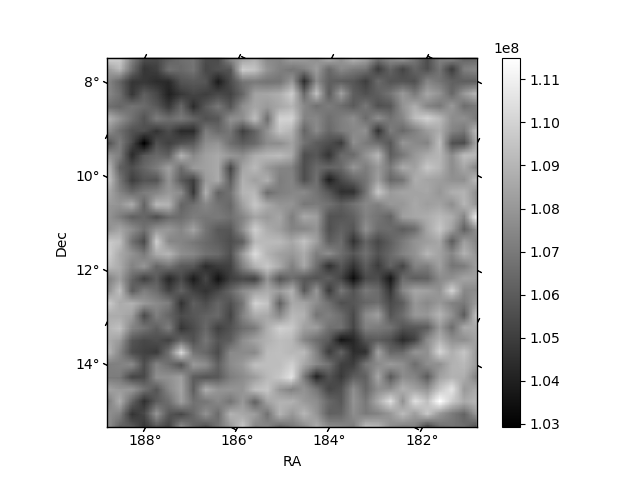
Histogram calculated using DETX and DETY for each event in the final _common_clean file
| Quadrant A | 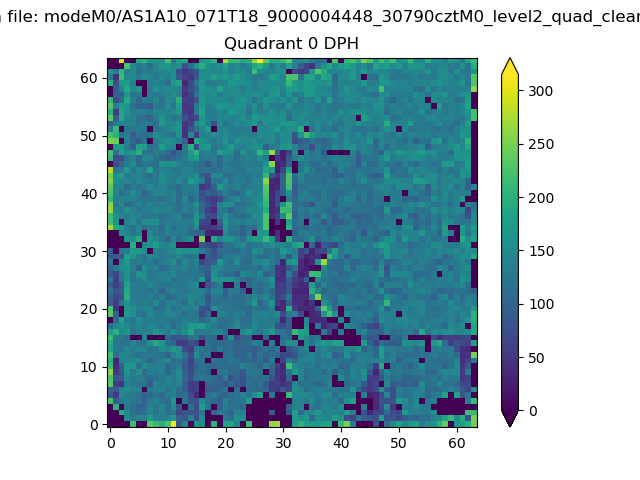 |
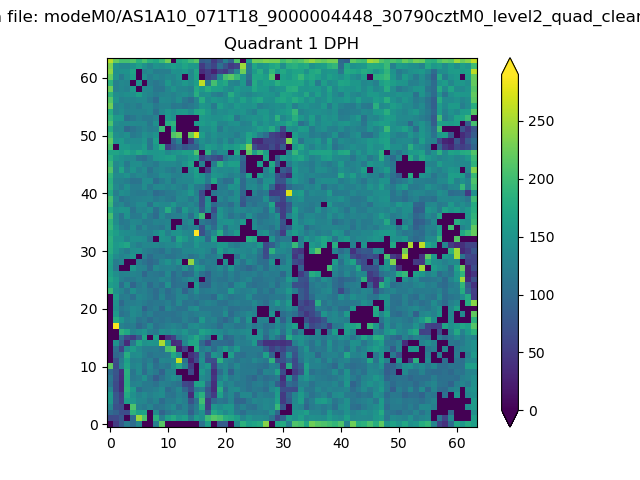 |
Quadrant B |
|---|---|---|---|
| Quadrant D | 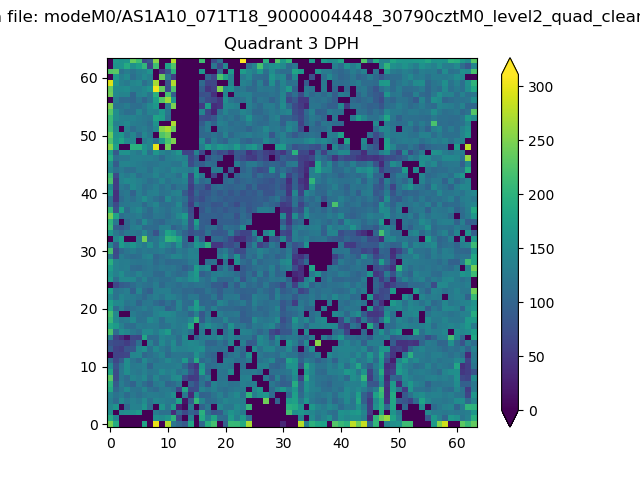 |
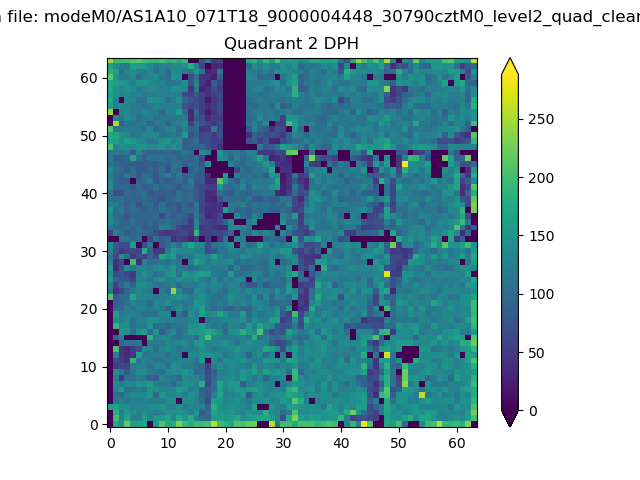 |
Quadrant C |
| Plot type | Count rate plots | Images |
|---|---|---|
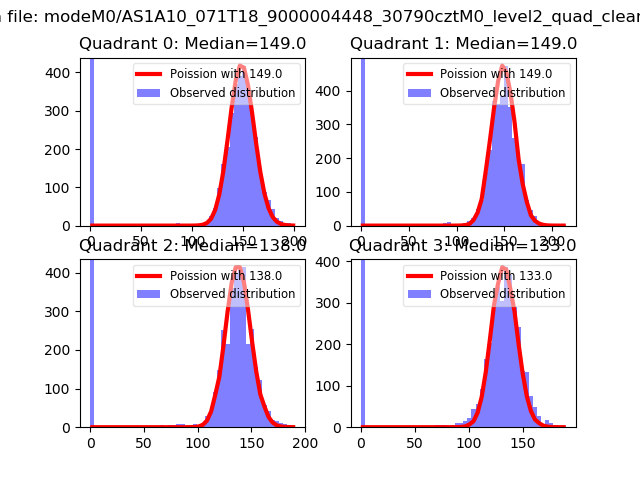
| Comparison with Poisson distribution Blue bars denote a histogram of data divided into 1 sec bins. Red curve is a Poisson curve with rate = median count rate of data. |
 |
 |
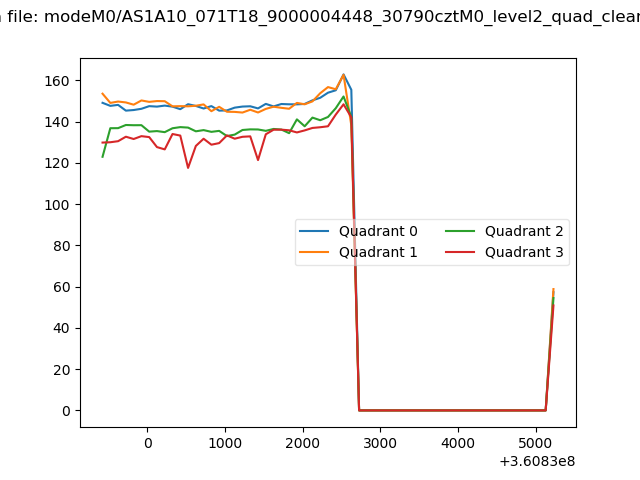
| Quadrant-wise count rates Data is divided into 100 sec bins |
 |
|
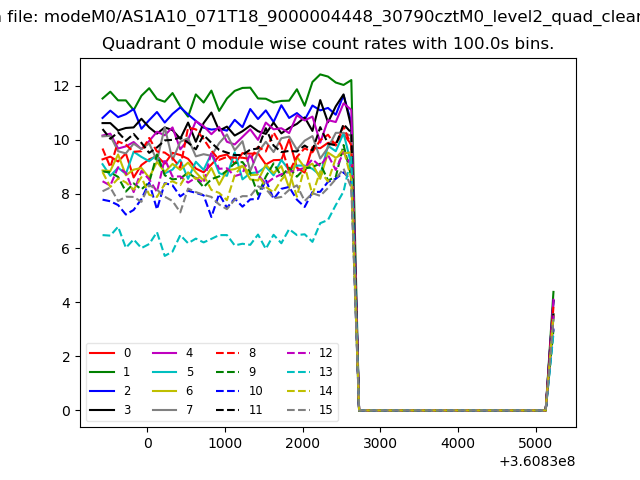
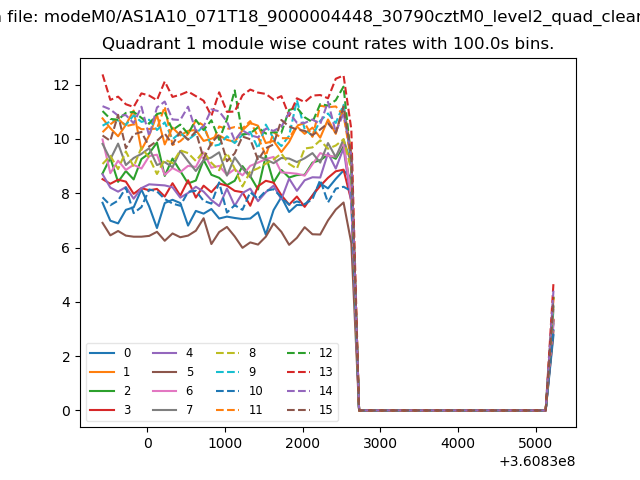
| Module-wise count rates for Quadrant A Data is divided into 100 sec bins |
 |
 |
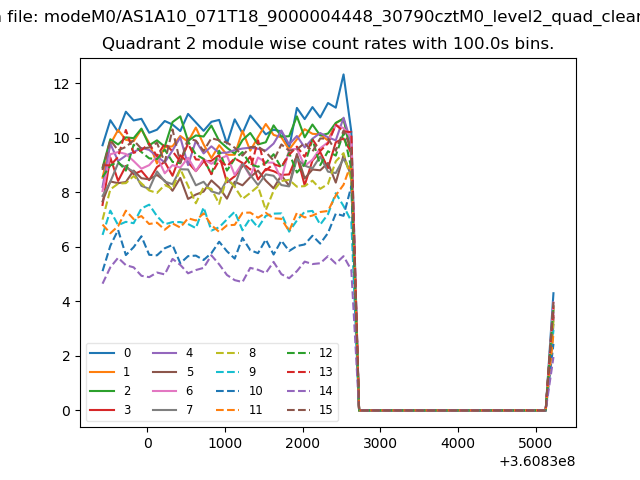
| Module-wise count rates for Quadrant B Data is divided into 100 sec bins |
 |
 |
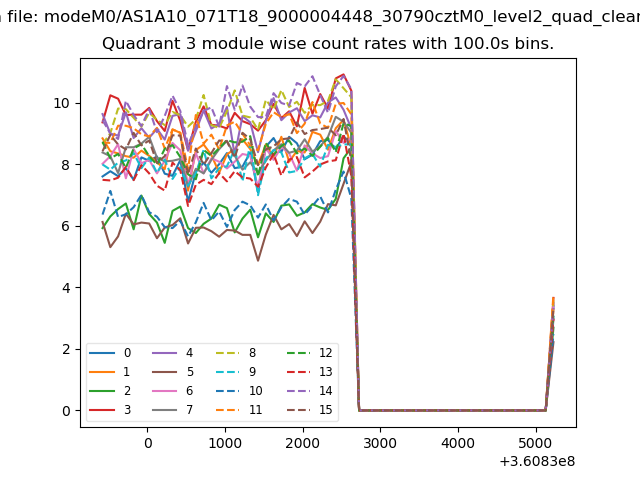
| Module-wise count rates for Quadrant C Data is divided into 100 sec bins |
 |
 |
| Module-wise count rates for Quadrant D Data is divided into 100 sec bins |
 |
 |
| Parameter | Plot |
|---|---|
| CZT HV Monitor | 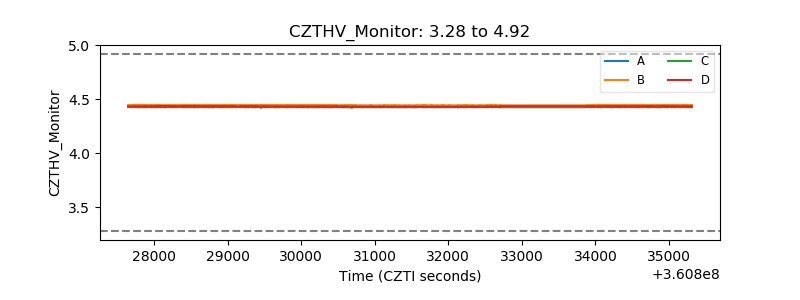 |
| D_VDD | 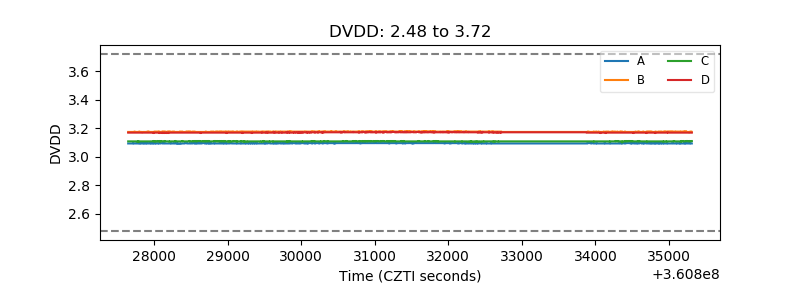 |
| Temperature 1 | 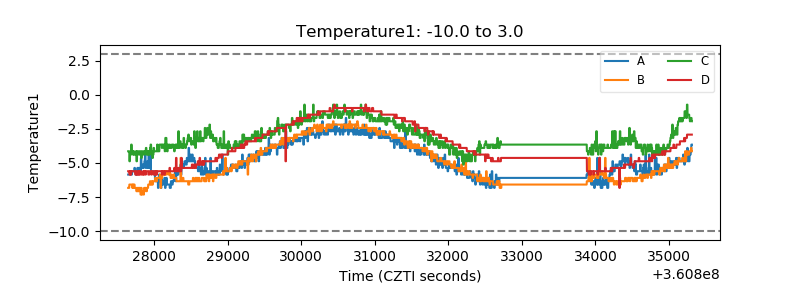 |
| Veto HV Monitor | 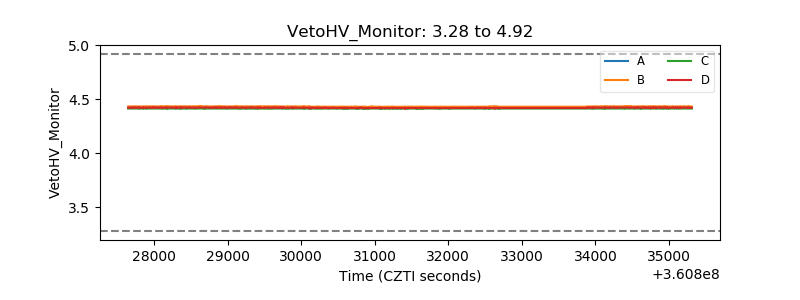 |
| Veto LLD | 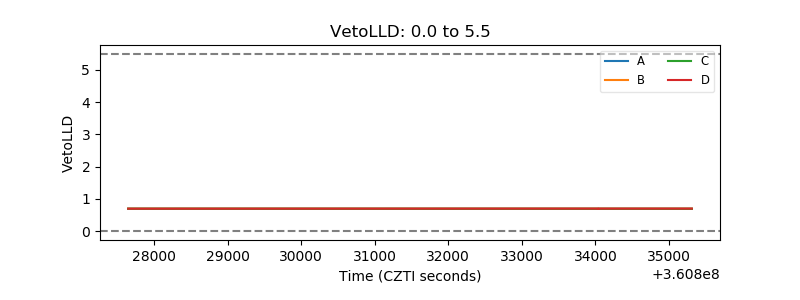 |
| Alpha Counter | 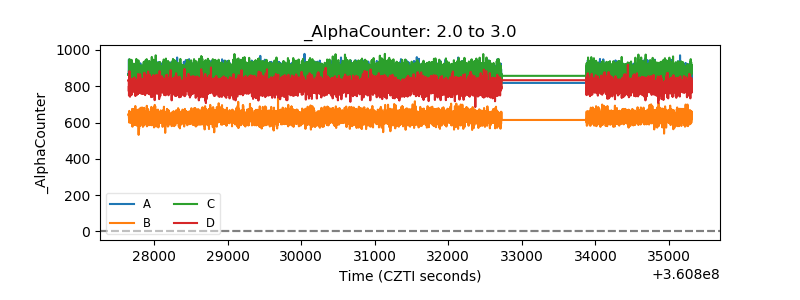 |
| _CPM_Rate | 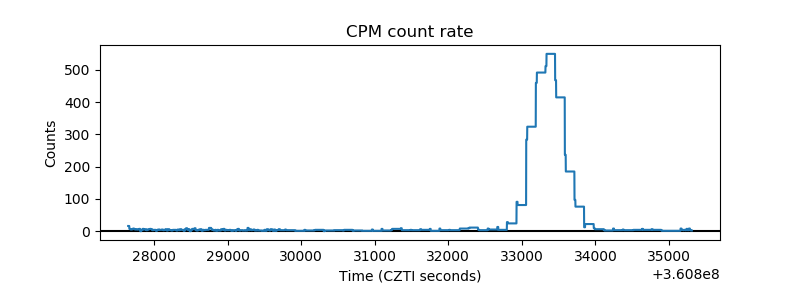 |
| CZT Counter |  |
| +2.5 Volts monitor |  |
| +5 Volts monitor |  |
| _ROLL_ROT | 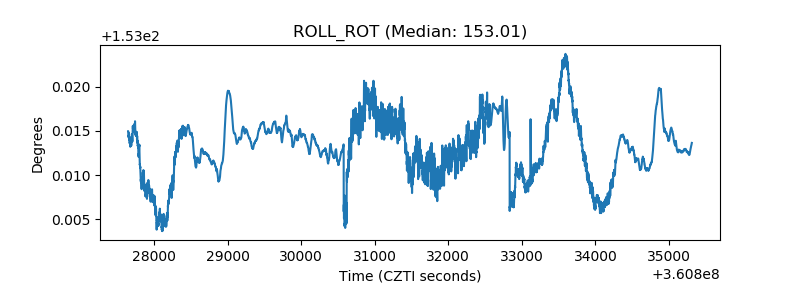 |
| _Roll_DEC | 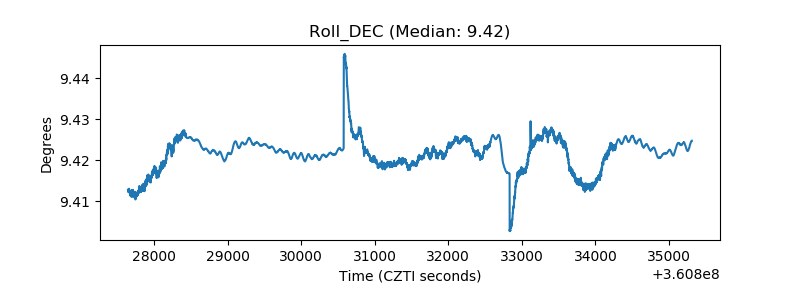 |
| _Roll_RA |  |
| Veto Counter | 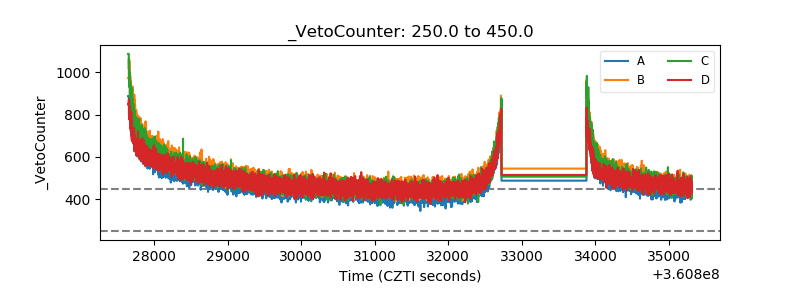 |