| Param | Original file | Final file |
|---|---|---|
| Filename | modeM0/AS1A10_071T18_9000004448_30791cztM0_level2.evt | modeM0/AS1A10_071T18_9000004448_30791cztM0_level2_quad_clean.evt |
| Size (bytes) | 731,494,080 | 85,521,600 |
| Size | 697.6 MB | 81.6 MB |
| Events in quadrant A | 3,460,624 | 558,454 |
| Events in quadrant B | 5,413,942 | 554,422 |
| Events in quadrant C | 5,491,679 | 512,510 |
| Events in quadrant D | 7,329,616 | 491,106 |
| Mode SS | |||
|---|---|---|---|
| Quadrant | BADHDUFLAG | Total packets | Discarded packets |
| A | 0 | 138 | 0 |
| B | 0 | 138 | 0 |
| C | 0 | 138 | 0 |
| D | 0 | 138 | 0 |
| Mode M9 | |||
|---|---|---|---|
| Quadrant | BADHDUFLAG | Total packets | Discarded packets |
| A | 0 | 15 | 0 |
| B | 0 | 16 | 0 |
| C | 0 | 16 | 0 |
| D | 0 | 16 | 0 |
| Mode M0 | |||
|---|---|---|---|
| Quadrant | BADHDUFLAG | Total packets | Discarded packets |
| A | 0 | 14163 | 2 |
| B | 0 | 20699 | 4 |
| C | 0 | 21060 | 2 |
| D | 0 | 26454 | 2 |
| Quadrant | Total seconds | Saturated seconds | Saturation percentage |
|---|---|---|---|
| A | 6788 | 134 | 1.974072% |
| B | 6787 | 219 | 3.226757% |
| C | 6787 | 596 | 8.781494% |
| D | 6787 | 607 | 8.943569% |
Noise dominated data is calculated using 1-second bins in cleaned event files. If a bin has >2000 counts, and if more than 50% of those come from <1% of pixels, then it is considered to be noise-dominated and hence unusable.
| Quadrant | # 1 sec bins | Bins with >0 counts | Bins with >2000 counts | High rate bins dominated by noise | Noise dominated (total time) | Noise dominated (detector-on time) | Marked lightcurve |
|---|---|---|---|---|---|---|---|
| A | 7653 | 6788 | 1 | 1 | 0.01% | 0.01% | 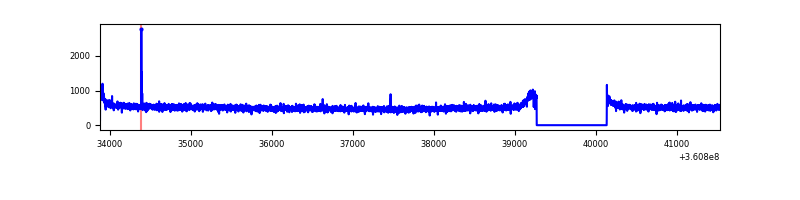 |
| B | 7652 | 6787 | 6 | 6 | 0.08% | 0.09% | 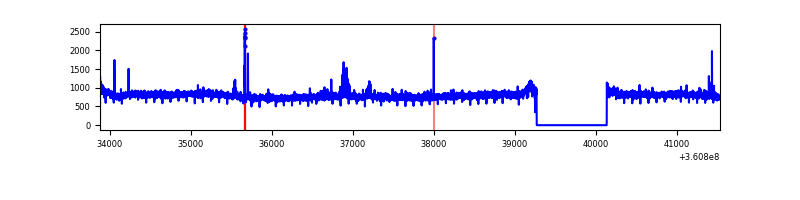 |
| C | 7652 | 6787 | 87 | 87 | 1.14% | 1.28% | 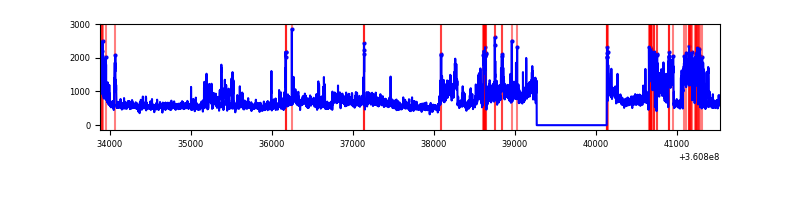 |
| D | 7652 | 6787 | 517 | 517 | 6.76% | 7.62% | 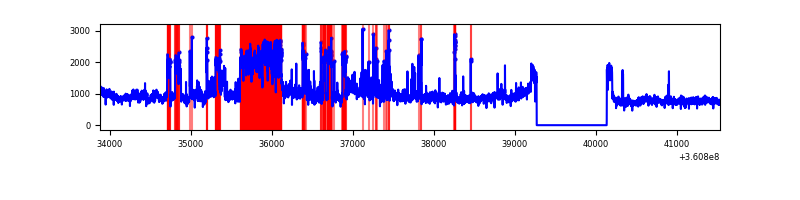 |
Top three noisy pixels from each quadrant. If the there are fewer than three noisy pixels in the level2.evt file, extra rows are filled as -1
| Pixel properties | Quadrant properties | ||||||
|---|---|---|---|---|---|---|---|
| Quadrant | DetID | PixID | Counts | Sigma | Mean | Median | Sigma |
| A | 13 | 254 | 12811 | 66.59 | 895 | 881 | 179.2 |
| A | 3 | 137 | 8756 | 43.95 | 895 | 881 | 179.2 |
| A | 0 | 226 | 7586 | 37.42 | 895 | 881 | 179.2 |
| B | 6 | 159 | 1869552 | 11045.43 | 878 | 857 | 169.2 |
| B | 5 | 172 | 35658 | 205.7 | 878 | 857 | 169.2 |
| B | 4 | 171 | 24852 | 141.83 | 878 | 857 | 169.2 |
| C | 3 | 233 | 1892070 | 9809.07 | 825 | 831 | 192.8 |
| C | 0 | 10 | 205717 | 1062.66 | 825 | 831 | 192.8 |
| C | 14 | 238 | 132816 | 684.55 | 825 | 831 | 192.8 |
| D | 8 | 195 | 3468683 | 16047.39 | 834 | 817 | 216.1 |
| D | 12 | 227 | 439669 | 2030.77 | 834 | 817 | 216.1 |
| D | 13 | 249 | 182373 | 840.14 | 834 | 817 | 216.1 |
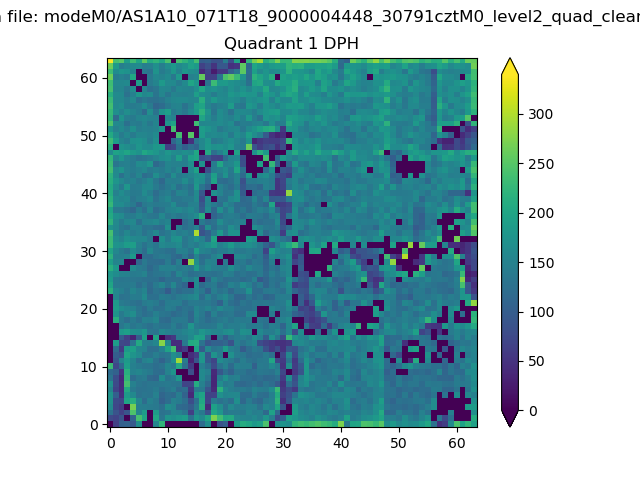
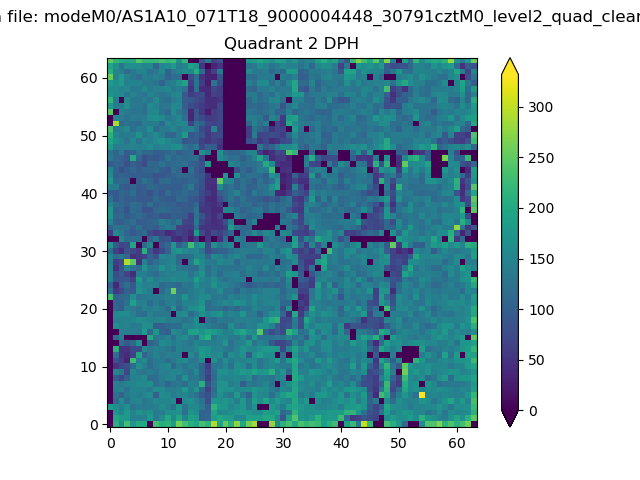
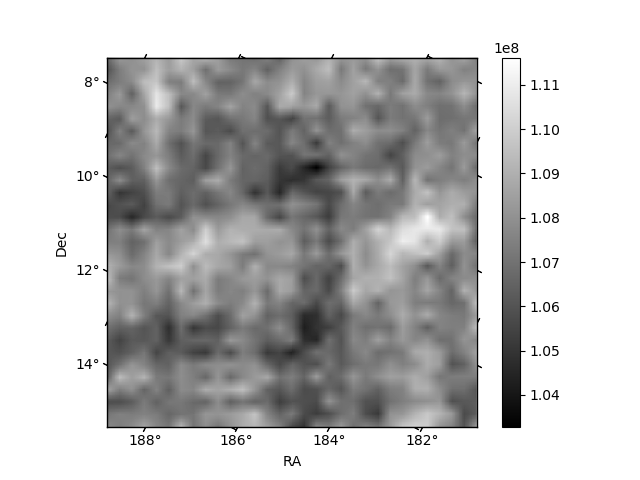
Histogram calculated using DETX and DETY for each event in the final _common_clean file
| Quadrant A |  |
 |
Quadrant B |
|---|---|---|---|
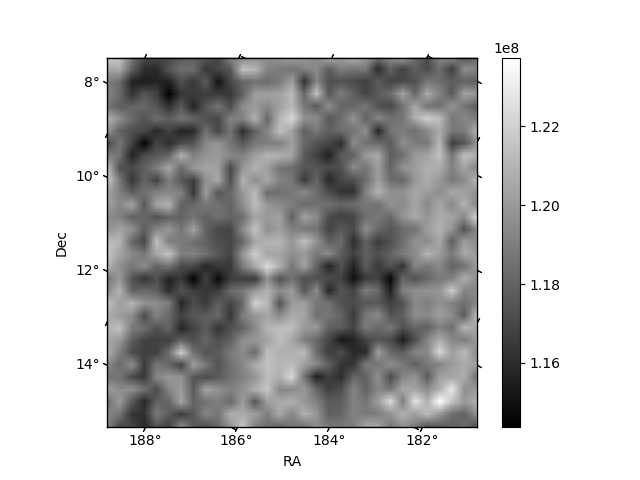
| Quadrant D |  |
 |
Quadrant C |
| Plot type | Count rate plots | Images |
|---|---|---|
| Comparison with Poisson distribution Blue bars denote a histogram of data divided into 1 sec bins. Red curve is a Poisson curve with rate = median count rate of data. |
 |
 |
| Quadrant-wise count rates Data is divided into 100 sec bins |
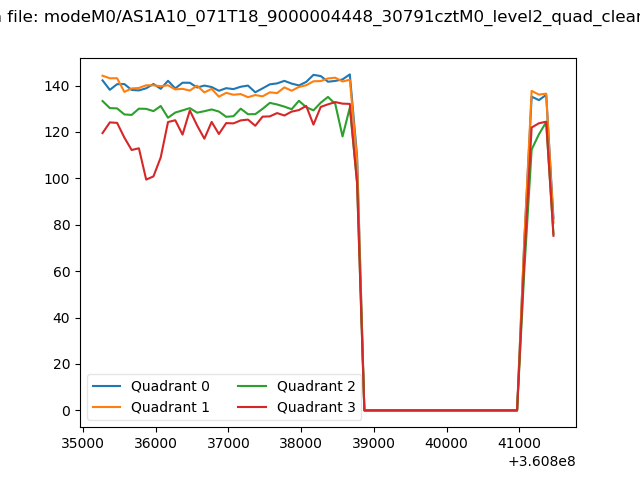 |
|
| Module-wise count rates for Quadrant A Data is divided into 100 sec bins |
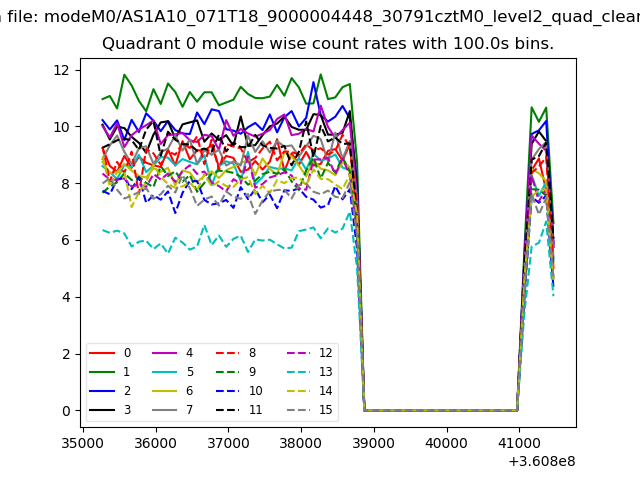 |
 |
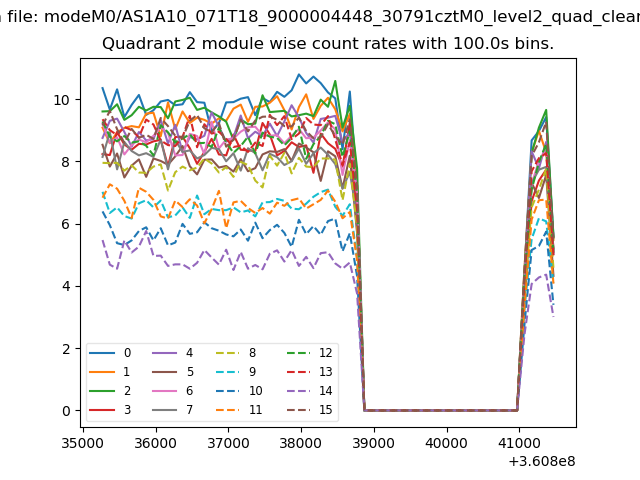
| Module-wise count rates for Quadrant B Data is divided into 100 sec bins |
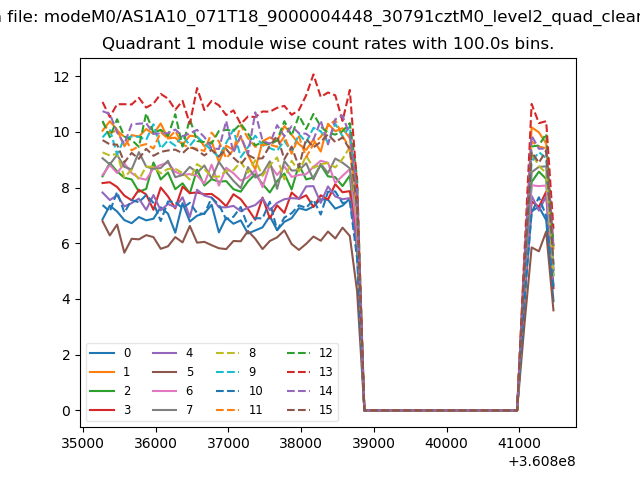 |
 |
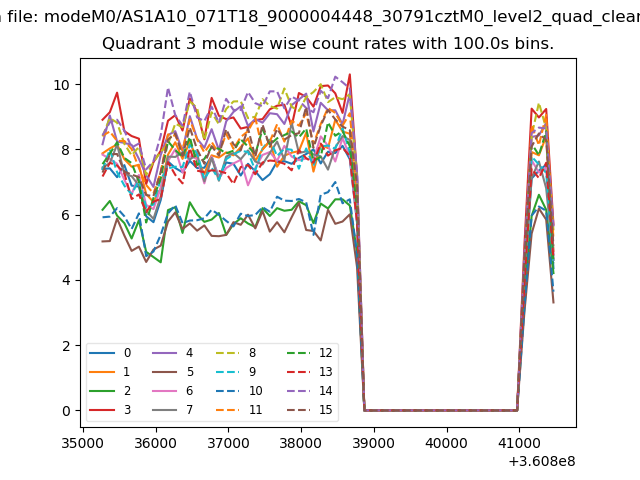
| Module-wise count rates for Quadrant C Data is divided into 100 sec bins |
 |
 |
| Module-wise count rates for Quadrant D Data is divided into 100 sec bins |
 |
 |
| Parameter | Plot |
|---|---|
| CZT HV Monitor |  |
| D_VDD | 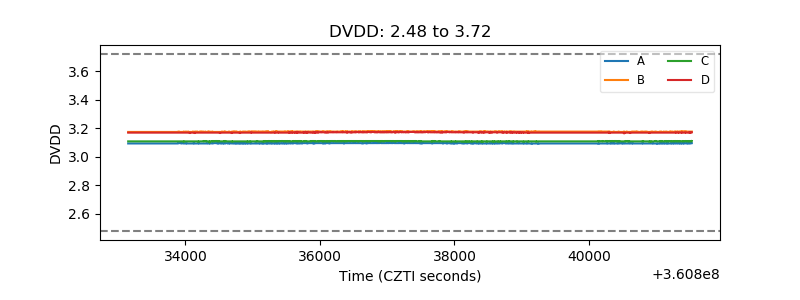 |
| Temperature 1 |  |
| Veto HV Monitor | 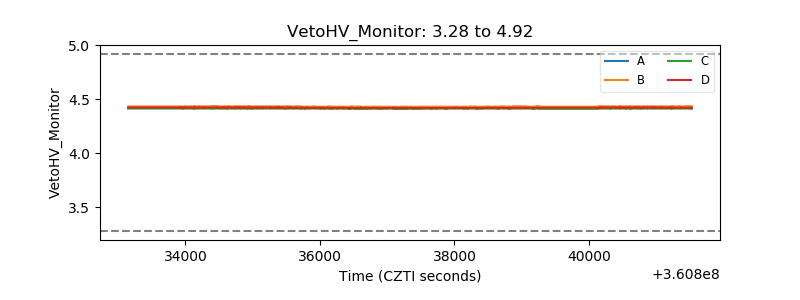 |
| Veto LLD | 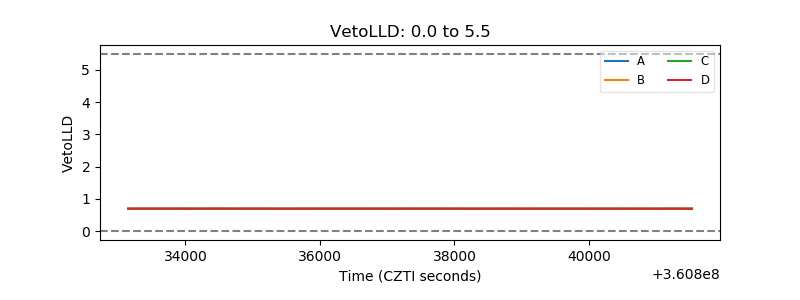 |
| Alpha Counter | 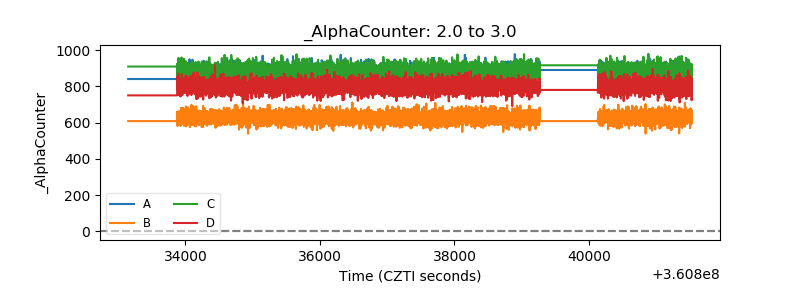 |
| _CPM_Rate | 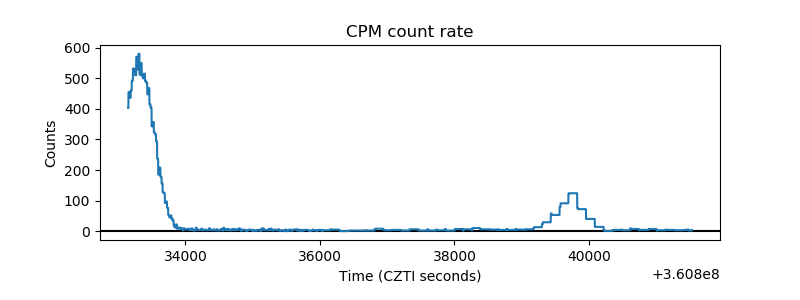 |
| CZT Counter | 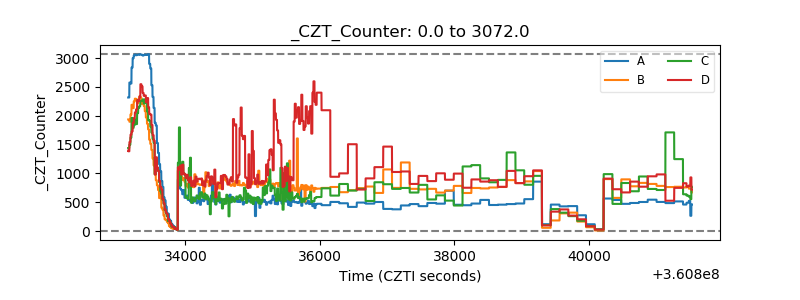 |
| +2.5 Volts monitor |  |
| +5 Volts monitor | 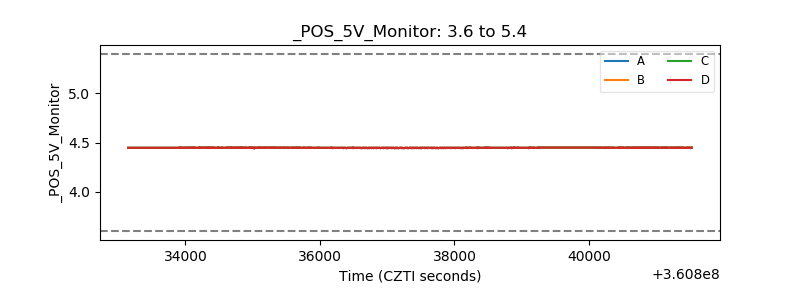 |
| _ROLL_ROT | 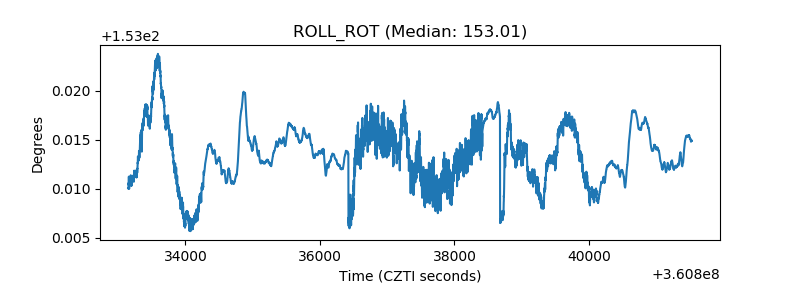 |
| _Roll_DEC | 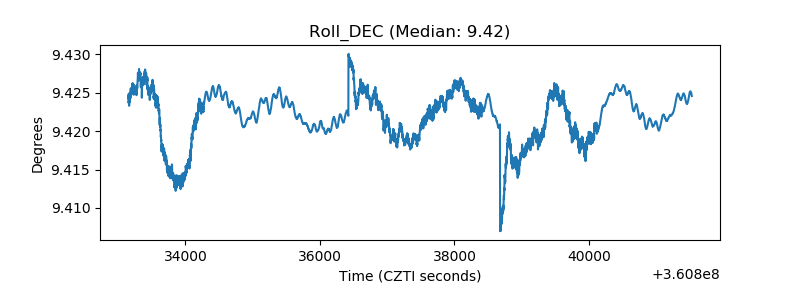 |
| _Roll_RA | 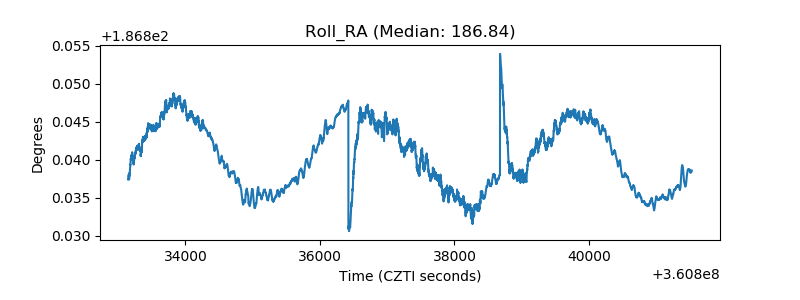 |
| Veto Counter | 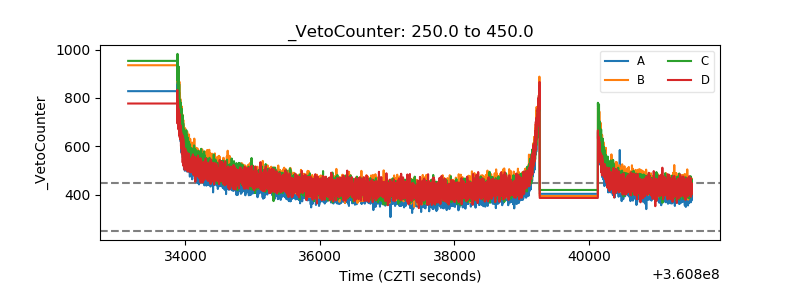 |